
TradingEdge Weekly for Jan 13 - Recovering markets, easing conditions, emerging surging

Key points:
- The net percentage of securities at 52-week highs minus lows hit a one-year high
- The jump in new highs coincides with breadth thrusts across indexes, sectors, and even bonds
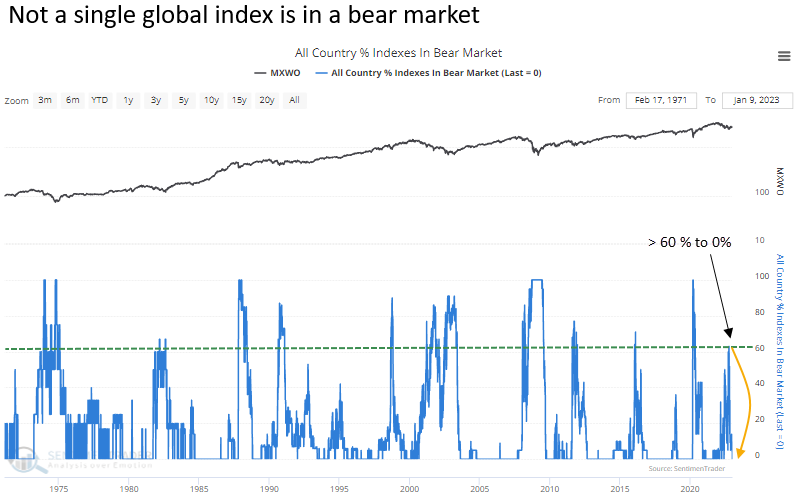
- Global stock markets have fully recovered from a rash of bear markets
- The recovery has occurred on the heels of extreme Panic among investors
- Thanks in part to rallies in stocks and bonds, financial conditions are easing
- Fewer than half of Consumer Discretionary stocks are now in bear markets
- Big tech stocks are in the midst of a "perfect" seasonal window
- Fundamentals remain a worry, including the widely-discussed yield curve
- Emerging markets have entered a new bull market
- They also have tailwinds from a falling dollar and positive seasonality
- That's in large part to a drastic recovery in Asian stocks
A big test for the changing market environment
One of the hallmarks of this bear market has been the near-total domination of stocks falling to 52-week lows versus the relatively few managing to tick at a 52-week high.
That has finally changed. You gotta squint, but Monday's reading was the highest in over a year. There have been a few other fakeouts over the past year, so a positive reading is not an iron-clad guarantee that buyers are now in control.
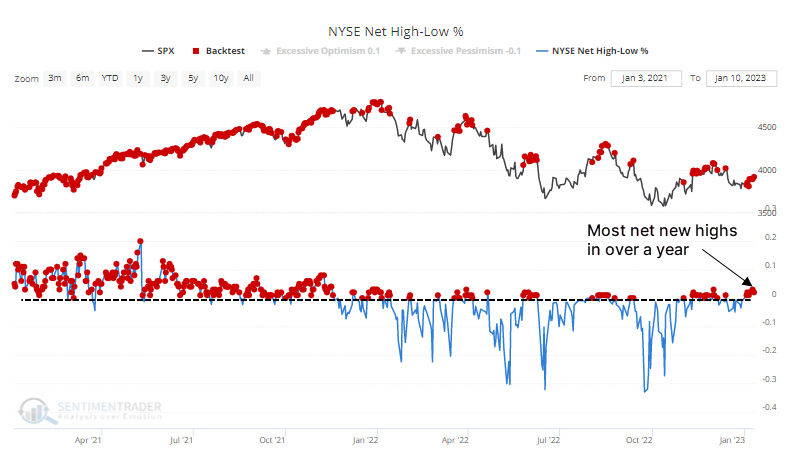
Even though there are more securities at new highs than new lows, it's still weak. It has now been over a year since there has been more than a net 3% of new highs versus new lows. It's the 2nd-longest streak since at least 1965.
The table below shows other times when the net percentage of securities at highs minus lows cycled from -20% to a positive reading and the highest figure in at least a year. Over the following year, returns tended to be fairly strong, with low risk and high reward. Out of the 19 signals, there were 3 distinct failures.
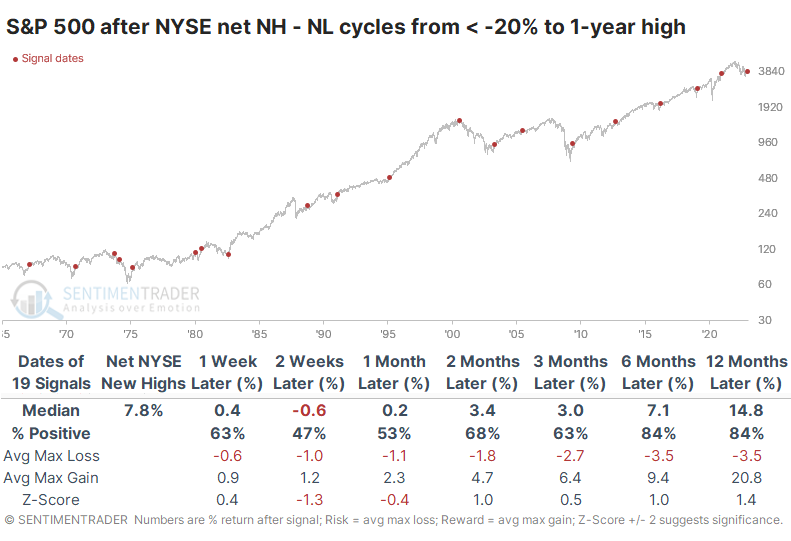
There was a +0.43 correlation (on a scale of -1.0 to +1.0) between the S&P's one-week and one-year returns. It's a modest suggestion that if buyers continue to find interest in stocks short-term, it bodes well long term. It's not fool-proof, but generally, if sellers dominated soon after these new one-year highs in breadth, forward returns were significantly worse than if buyers dominated short-term.
So...many...thrusts
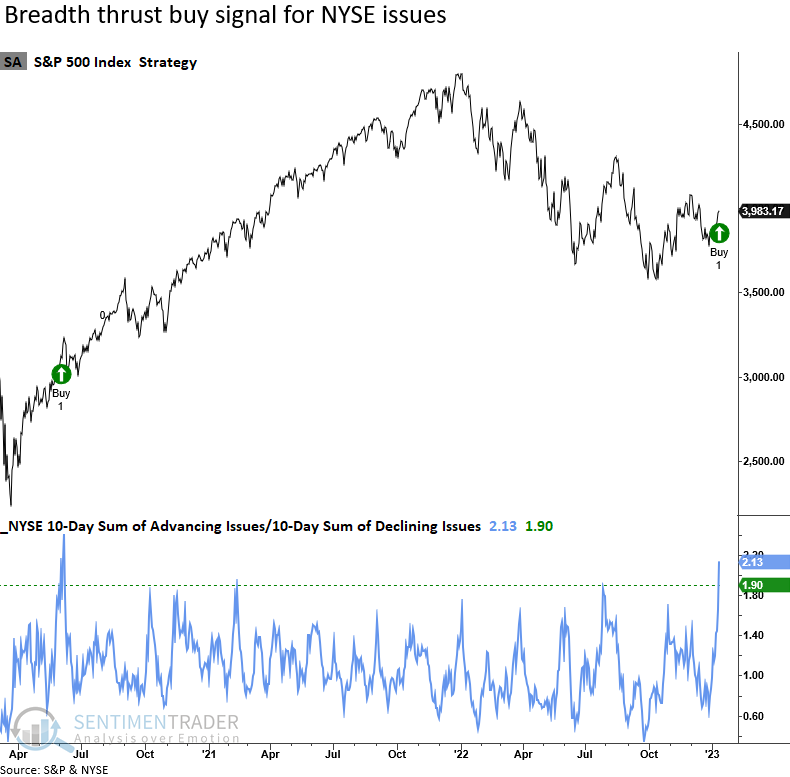
Dean showed that NYSE issues generated a breadth thrust signal for the first time since June 2020. Keep in mind these are all issues traded on the NYSE. So, an exchange that contains over 3000 securities is less likely to be influenced by passive vehicles that create all-or-nothing volatility in day-to-day breadth figures.
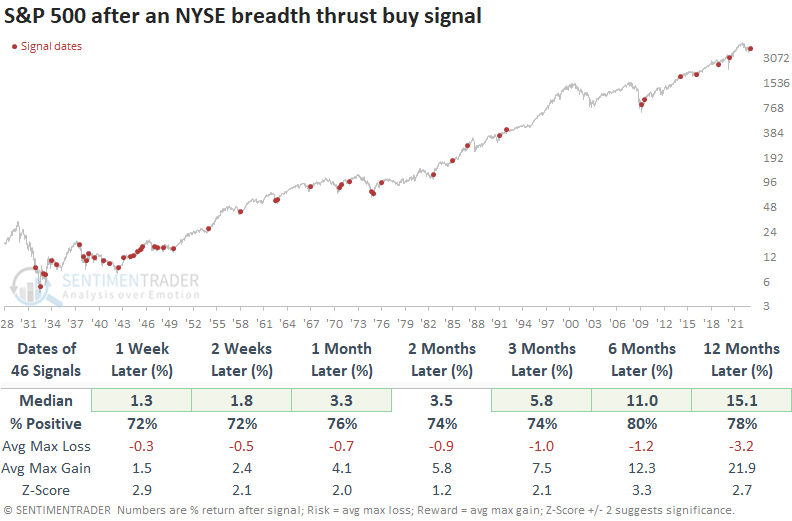
The NYSE breadth thrust model generated a signal 46 other times since 1932. Results were excellent across all time frames. Since 1942, the alert showed a gain in every case sometime in the next twelve months.
Dean also looked at thrusts in several other indexes/sectors:
- Nasdaq exchange members triggered its first breadth thrust signal since October 2020
- The economically-sensitive S&P 600 Index registered its third signal in the ongoing bear market
- Consumer Discretionary stocks (see more info below) triggered their first thrust signal since June 2020
High Yield bonds, which act similarly to the economically sensitive small caps, triggered their third breadth thrust signal in the current bear market.
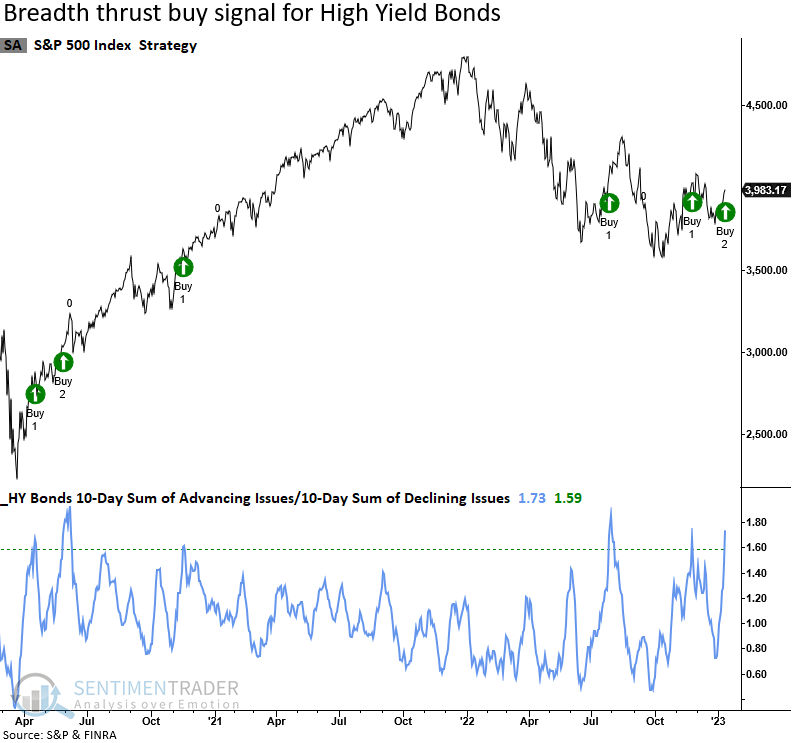
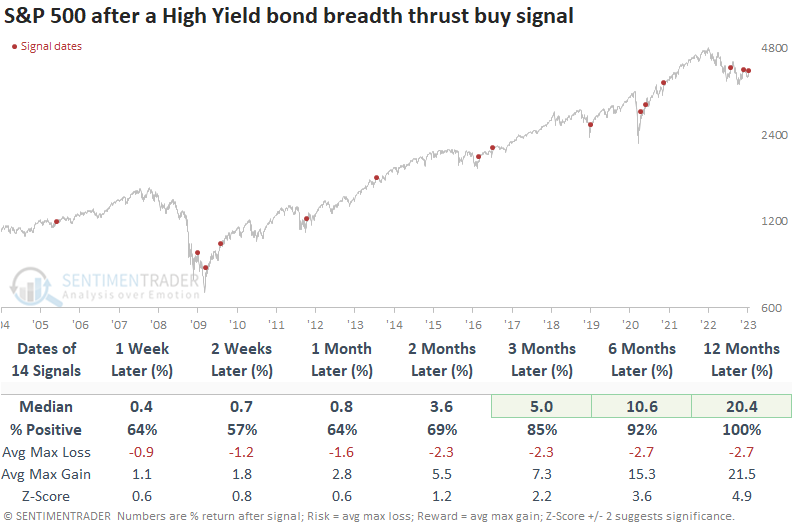
While the history is limited, the S&P 500 performs exceptionally well after high-yield bonds surge, especially a year later.
Global indexes are recovering, too
Dean showed that global Indexes continue to recover from the depths of the 2022 drawdown. The percentage of global indexes in a bear market cycled from > 60% to 0% for only the 11th time since 1972.
When the percentage of global indexes in a bear market cycles from > 60% to 0%, the MSCI World Index tends to rally, with the best results occurring six to twelve months later. The signal was positive at some point in the next twelve months in 9 out of 10 cases.
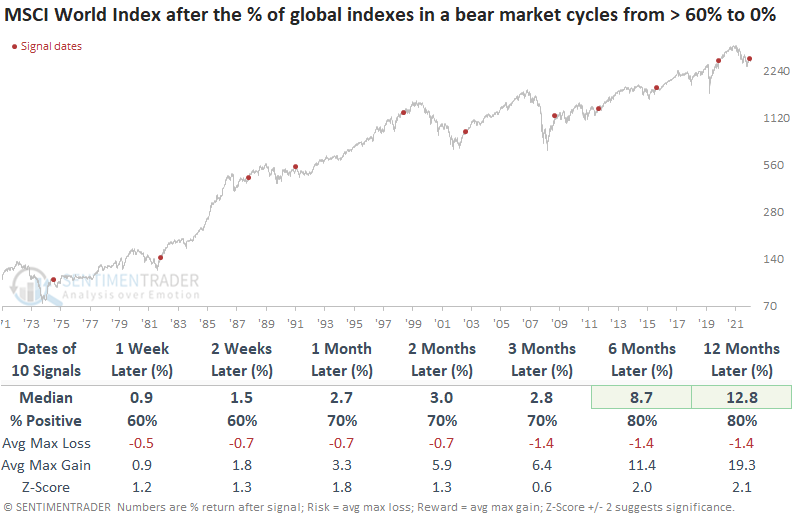
When applied to the S&P 500, the results look even more impressive than the MSCI World Index, with a 100% win rate a year later. After all but one of the signals, the Index enjoyed a more significant maximum gain than maximum loss over the next twelve months.
The recovery comes on the heels of panicked investors
Jay noted that the Panic/Euphoria Model is moving out of extreme Panic territory.
The model is based on the Citi Panic / Euphoria model published in Barron's magazine. Our interpretation of the model inputs differs modestly from the published figures. It is comprised of the following primary inputs: NYSE short interest, margin debt, Nasdaq vs. NYSE volume, Investor's Intelligence survey, AAII survey, retail money market funds, put/call ratios, commodities prices, and retail gasoline prices.
Let's focus on all readings below -0.15 only on the most recent 20 years of data. Whenever the model got this low, the S&P 500 averaged a one-year return of 25%.
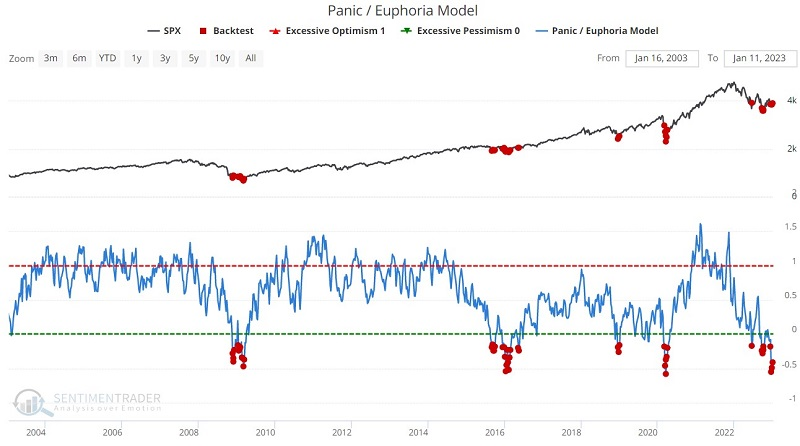
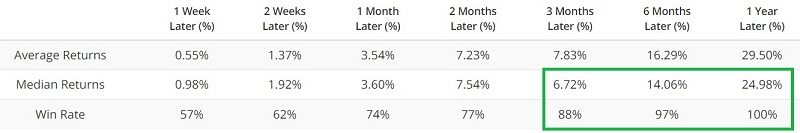
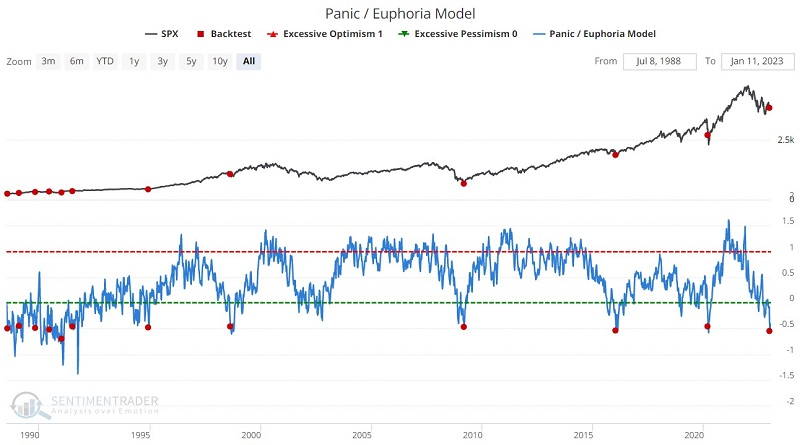
Now let's look at an extreme case. In this test, we look only for days when the Panic/Euphoria Model crossed below -0.45 for the first time in six months. We ignore any signals that occur within six months of a previous signal. The most recent signal occurred on 2022-12-23.
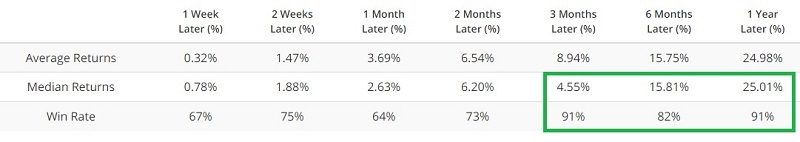
If we extend the test above over the full database history, we get the results below.
Financial conditions are easing
Dean noted that stock markets thrive when financial conditions are easing, not tightening, as was the case for most of 2022. A trading system that measures when financial conditions are tightening or easing triggered the first buy signal in almost a year.
When the range rank declines below the 34th percentile and S&P 500 price momentum is positive, the system goes long. Conversely, the model issues a sell signal when the range rank increases above the 95th percentile and the S&P 500 exhibits negative price momentum.
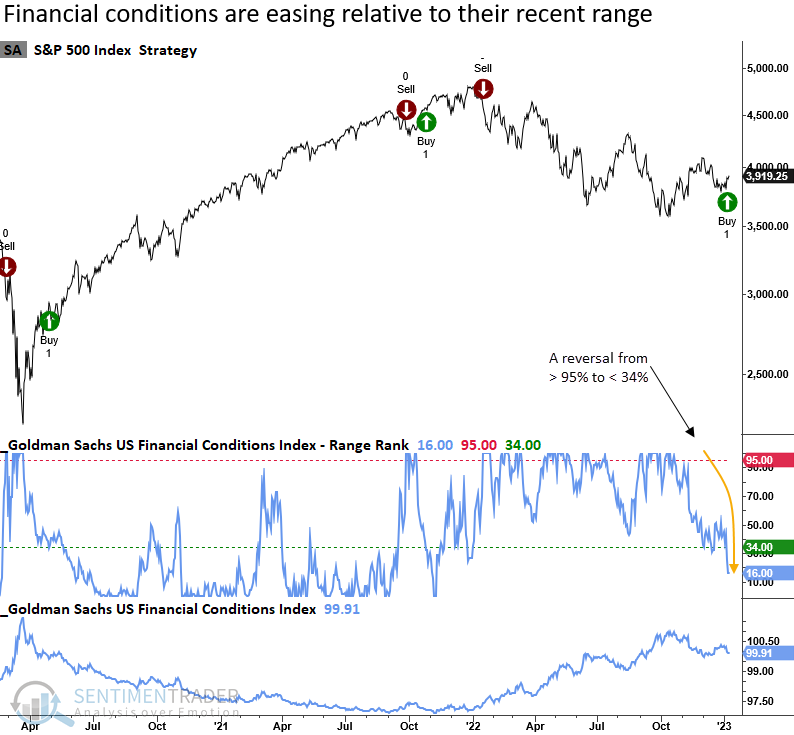
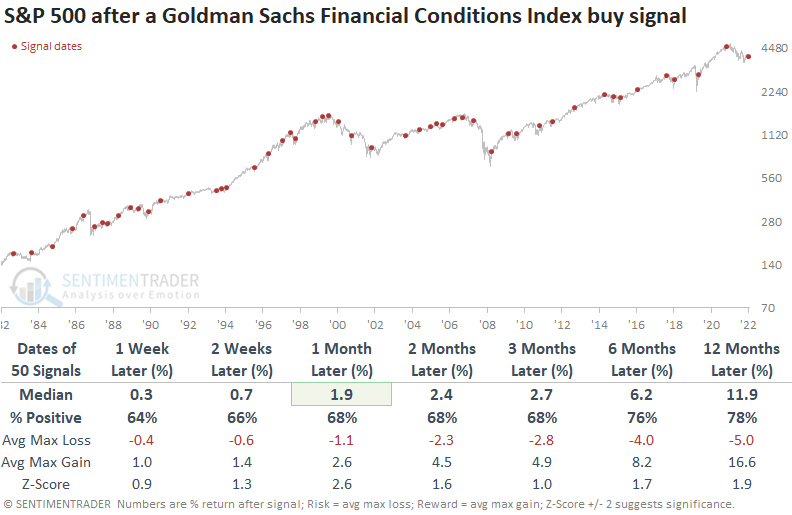
When the range rank for the Goldman Sachs Financial Conditions Index reverses from a period of tightening to easing conditions, the S&P 500 shows a positive upward bias with solid z-scores across most time frames.
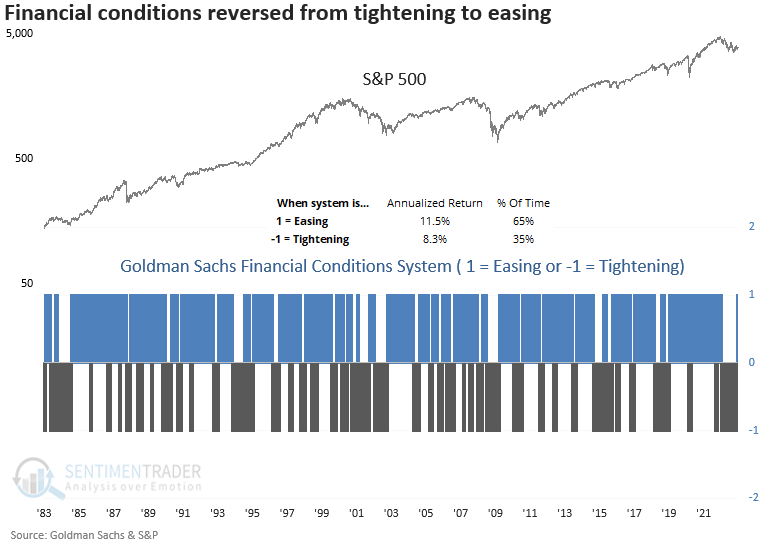
Because the system is either all in or out, annualizing returns for the buy or sell periods is a better performance measure. For instance, when the system issues a buy signal, the S&P 500 annualized at 11.5%, which is 3% more than when the model triggered a sell signal.
Fewer Discretionary stocks are in bear markets
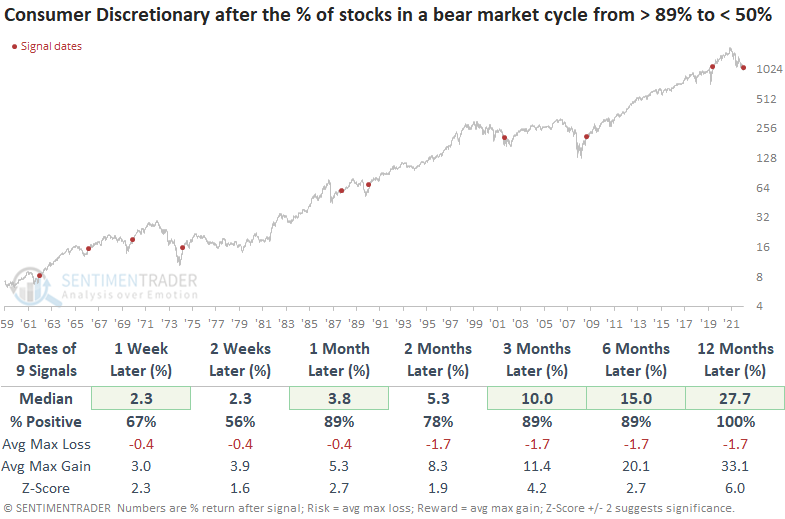
The percentage of S&P 500 Consumer Discretionary stocks in a bear market cycled from > 89% to < 50% for the 10th time in more than 70 years. Dean showed that the improvement in Discretionary stocks is a significant development in the debate around whether the broad market has formed a bear market bottom.
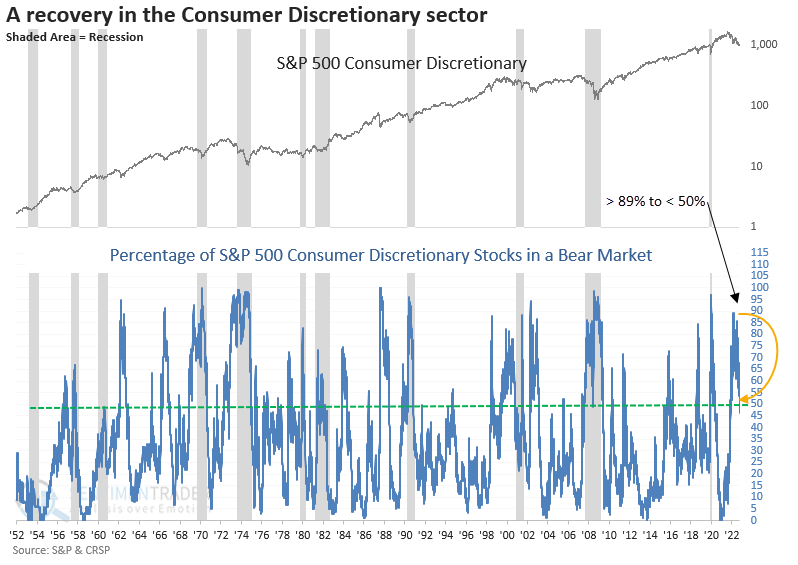
When the percentage of Consumer Discretionary stocks in a bear market cycle from > 89% to < 50%, the Consumer Discretionary sector performed extremely well over the next year. The signal was triggered a few months early in 2002, which is unsurprising as the sector can exhibit strength before a broad market bottom.
With the advent of ETFs, it's now more accessible and cheaper than ever to allocate to a basket of stocks to take advantage of historical trends. Suppose the recovery in consumer discretionary stocks signals that the bear market is over. In that case, one might consider a position in the equal-weighted discretionary ETF (RCD) versus the cap-weighted discretionary ETF (XLY).
After bear market bottoms, the equal-weighted Consumer Discretionary sector consistently outperforms the cap-weighted version.
A good seasonal time for tech
The Nasdaq 100 is off to a quick start in early 2023. Jay noted that investors should not be taken by surprise as it has a strong history during the first seven months of pre-election years.
The NDX was first calculated in 1985. Since then, nine pre-election years have been completed, plus the first few trading days of 2023. The chart below displays the cumulative growth of $1 invested in NDX only during January 1st through July 31st of each pre-election year - including the first few days of January 2023.
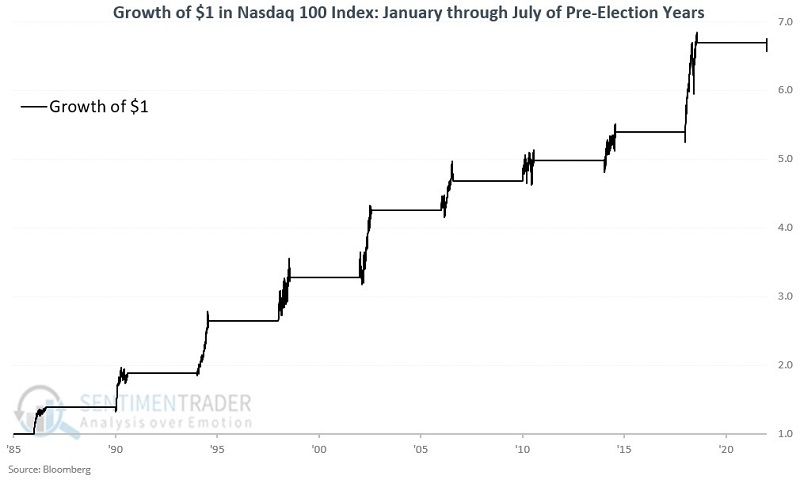
During these seasonal windows, NDX rose all nine times, with no losers. Its average return was over 24%, notching gains of more than 20% on six occasions.
Fundamentals remain a worry, as they have for a year
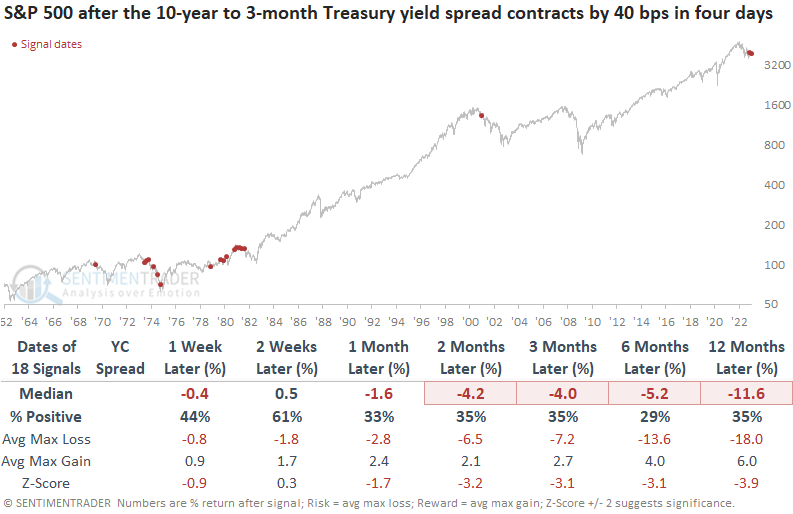
Bond traders wasted no time in the new year bidding up the 10-year bond price in the holiday-shortened first week of the year. Dean noted that the increase in price means the bond yield declined, and the widely-followed 10-year to 3-month Treasury yield spread contracted by -54 bps in four days.
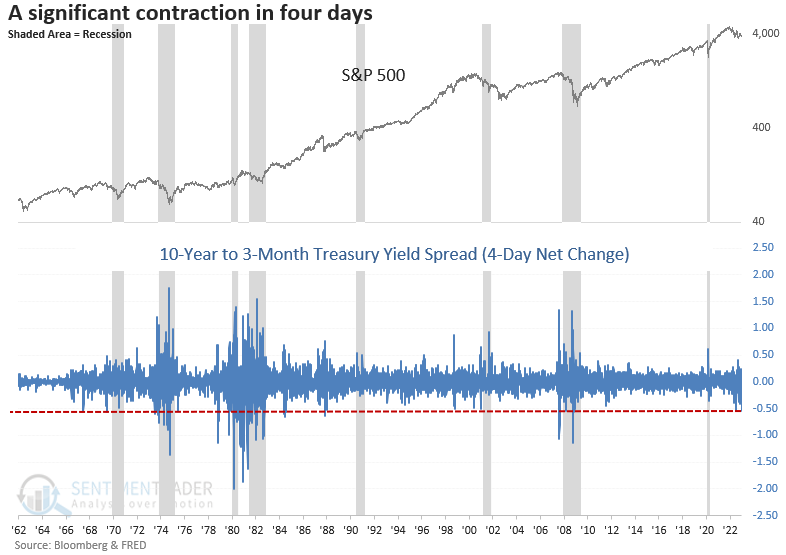
When the Treasury yield spread declines by -40 bps in four days, and the spread is inverted, the outlook for the S&P 500 is grim across most time frames. Historical signals typically occur within the context of stock market drawdowns, especially during the 1966-82 secular bear market period when the Federal Reserve was fighting elevated inflation similar to the current environment.
Emerging markets have entered a new bull market
At the risk of upsetting the delicate sensibilities of FinTwit hall monitors, emerging market stocks just entered a new bull market.
The precise definition doesn't matter because there are no rules in auction markets. For bull and bear markets, the financial media took hold of a 20% rally or decline, respectively. For consistency and ease, that's what we'll go with, and using that definition, the most popular fund for betting on emerging markets just surpassed that threshold.
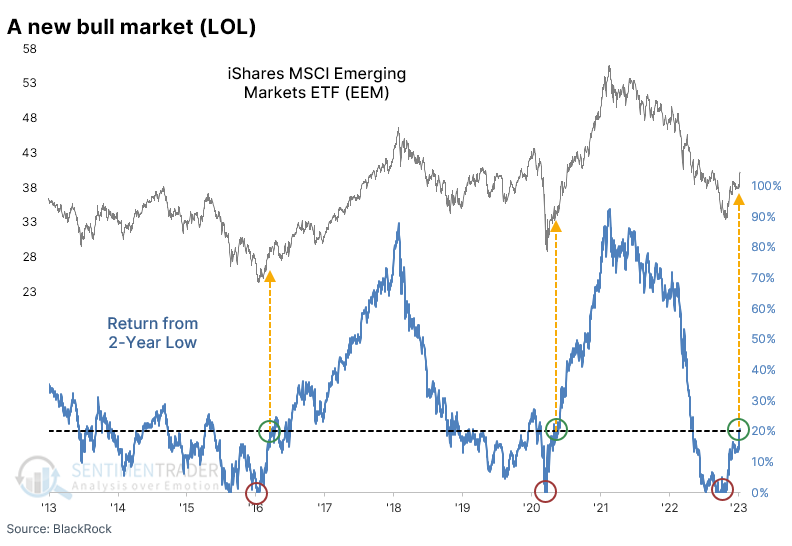
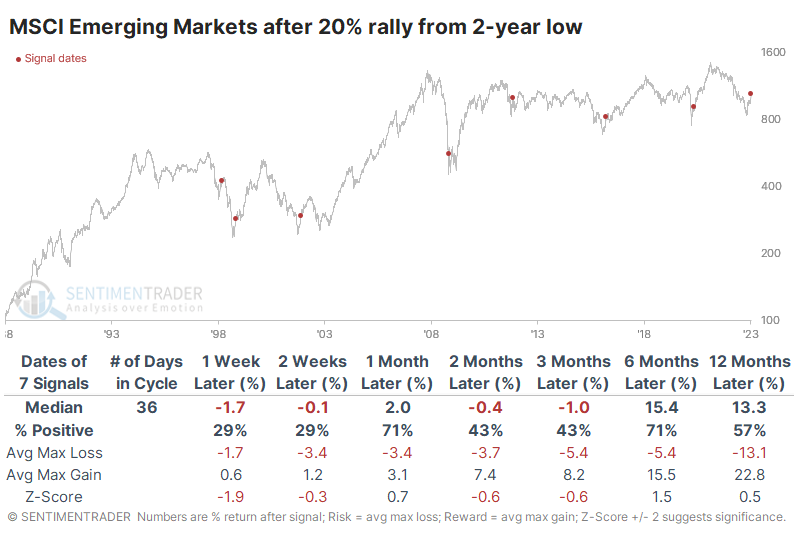
If we use the index underlying that fund, this is the 8th time in 35 years that it has rallied 20% from at least a two-year low. Once it reached the 20% rally level, the stocks tended to give back some gains over the next 1-2 weeks. The only times they didn't, in 1998 and 2001, they continued to soar in the months ahead. The only true failure was earlier in 1998.
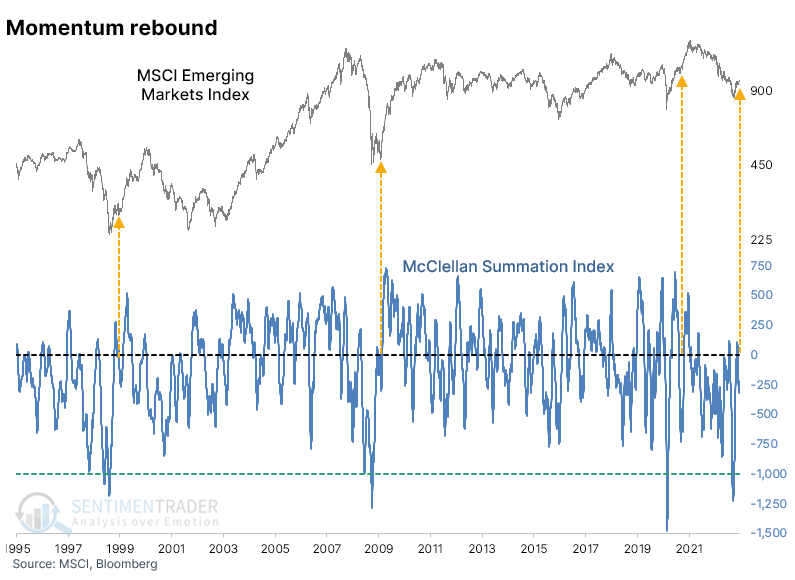
Thanks to the protracted and severe decline in many stocks populating the index, the McClellan Summation Index for emerging markets declined below -1000, noted in October. The recovery has been broad-based enough to push the Summation Index above zero. It has since pulled back to a modest negative reading.
After each of the others, the stocks managed to gain 20% over the next six months. A table of maximum losses and gains over each time frame shows how skewed the returns were. Losses were minimal, while there was a rally of at least 30% within the next six months every time.
Emerging market stocks are enjoying a tailwind from trends and seasonality
Jay noted that the US dollar has offered a confirming signal for emerging markets and seasonality remains a tailwind during the first half of 2023.
It is favorable for emerging markets when:
- The MSCI Emerging Markets Index's 5-week moving average is ABOVE its 30-week moving average
- The US dollar's 5-week moving average is BELOW its 30-week moving average
The chart below displays the growth of $1 in the MSCI Emerging Markets Index when both of the above are true. The cumulative growth since 1988 was +828% versus +622% using a buy-and-hold approach.
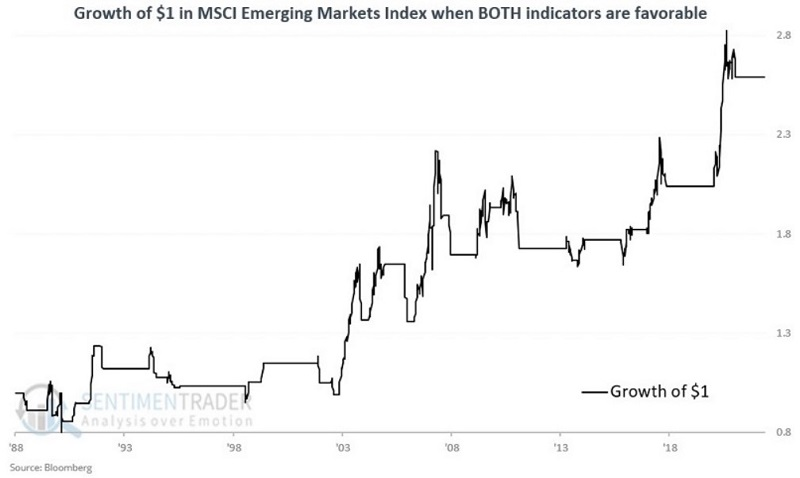
As of the week ending 2023-01-06, both indicators above are favorable.
Seasonally, emerging markets enjoy a positive seasonal period that extends from Trading Day of Year (TDY) #227 through TDY #78 the following year. For this cycle, that period extends from the close on 2022-11-25 through the closing on 2023-4-25. So far, EEM has been up 7.7% since 2022-11-25. The chart below displays the performance of EEM during this favorable seasonal period starting in 2003.
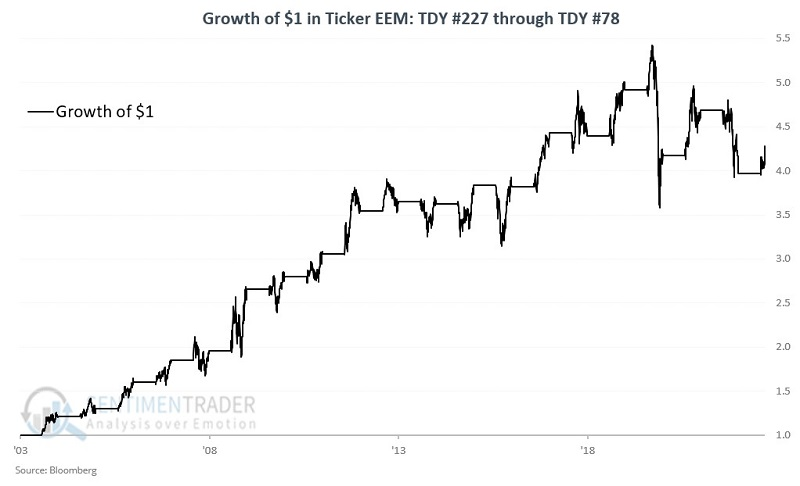
During these windows, EEM rallied 14 out of 19 years, with an average gain more than double the average loss, and four times more likely to enjoy a 10% gain than a 10% loss.
Asian stocks are helping to drive the gains in emerging markets
Two months ago, we looked at the nascent recovery in the Hang Seng, which appeared positive for longer-term returns in those stocks. The index has rallied almost 30% since then, furthering the case that this time should be different from the other rally attempts over the past year.
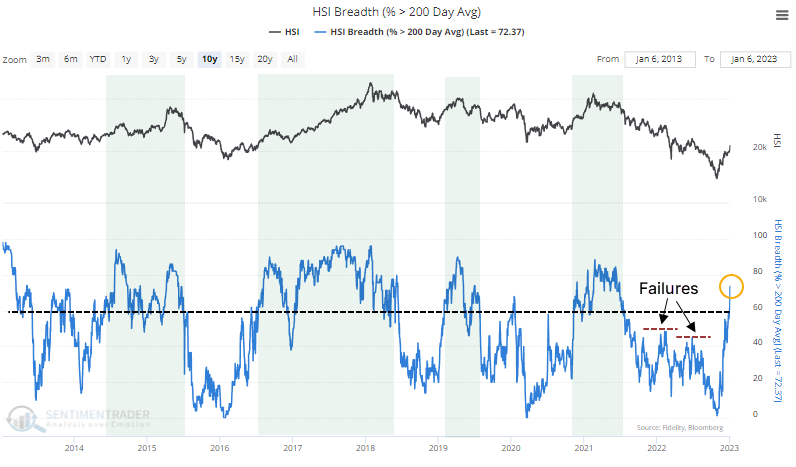
The recovery has been broad-based, and more than 70% of members in the index are now trading above their 200-day moving average. The previous two bear market rallies in the Hang Seng ended when fewer than half of stocks were above their averages. The current surge is a definite change in character.
Over the past 22 years, when there was a cycle of fewer than 10% of members holding above their long-term averages to more than 70% of members, the Hang Seng tended to hold its upside momentum for at least the next couple of weeks, and typically longer.
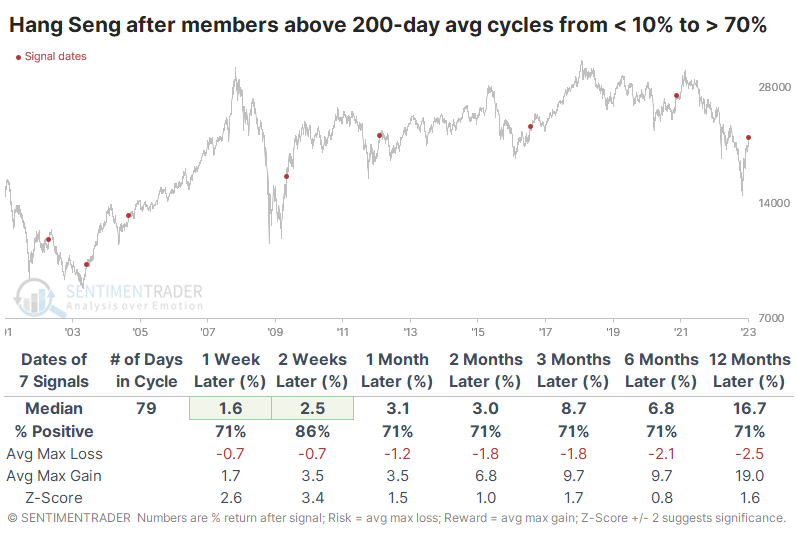
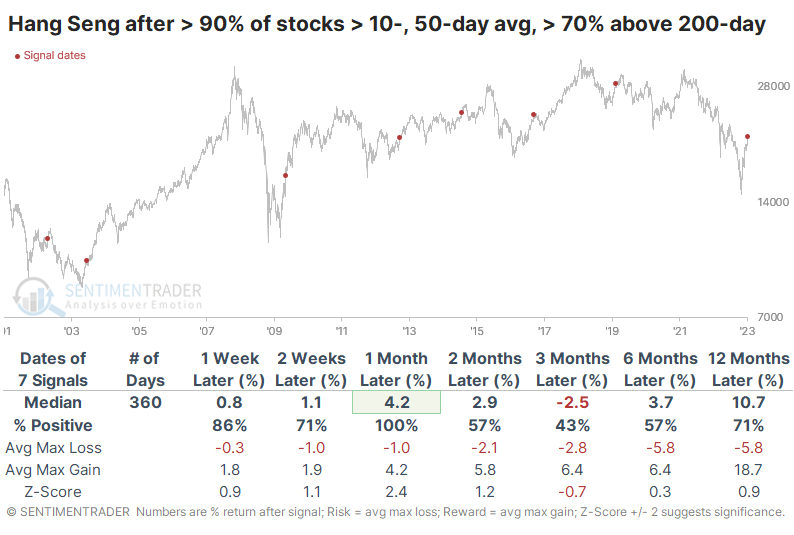
After all but one of the signals, the index enjoyed a larger maximum gain than maximum loss over the next two months. The push above long-term averages means surges in shorter time frames, almost by definition. Indeed, more than 90% of Hang Seng members traded above their 10-day and 50-day moving averages last week, not something that usually happens during protracted bear markets.
About TradingEdge Weekly...
The goal of TradingEdge Weekly is to summarize some of the research published to SentimenTrader over the past week. Sometimes there is a lot to digest and this summary is meant to highlight the highest conviction or most compelling ideas we discussed. This is NOT the full research that's published, rather it pulls out some of the most relevant parts. It includes links to the published research for convenience; if you don't subscribe to those products it will present the options for access.