
TradingEdge Weekly for Feb 24 - Inflation trading, economic breakout, risk-on mentality

Key points:
- Three models of PPI inflation show massive differences in future stock market performance
- A combined model using those inputs is currently in bullish mode
- Economic surprises have broken out to the upside, with ramifications for asset classes
- Even adjusting for increased volatility in breadth metrics, the last four months are impressive
- Investors clearly favored risk-on factors to start 2023
- Stocks in Hong Kong have triggered an IBD sell signal
- There is some good and some bad when it comes to gold stocks
Inflation as a stock market indicator
Extremes in inflation have historically been unfavorable for stocks. Jay discussed in depth three separate stock market indicators based on changes in the Producer Price Index and their impact on forward stock returns.
The Producer Price Index (PPI) measures the average change over time in the prices domestic producers receive for their output. The PPI is different from the consumer price index (CPI), which measures the changes in the price of goods and services paid by consumers.
What really matters is not the raw value of the PPI but the rate of change of the raw value over time. We refer to the 12-month rate-of-change as the PPI inflation rate. The chart below displays the PPI inflation rate since 1914. This chart highlights the +9% and -12% levels for reasons we will discuss in a moment.
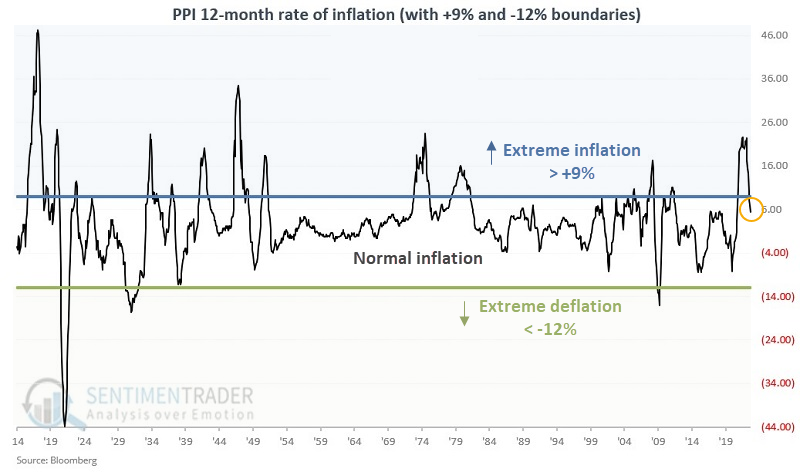
For our purposes:
- PPI change > +9% = Extreme inflation
- PPI change < -12% = Extreme deflation
- Everything in between = Normal inflation
Jay showed three models based on the PPI and CPI. The first indicator measures the 12-month rate-of-change in the Producer Price Index monthly raw value, as shown above. The rule is simple: if the rate-of-change is less than +9% but greater than -12%, then the indicator is bullish; otherwise, it's bearish.
The logarithmic chart below displays the growth of $1 in the Dow Jones Industrials Index since 1914 if PPI Indicator #1 is bullish. The cumulative growth was +799,187%.
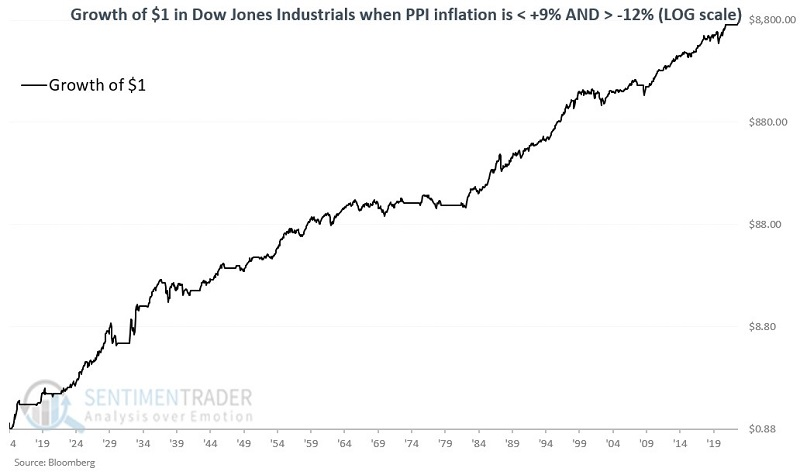
If the indicator was not bullish, the Dow's cumulative decline was -93%.
The second indicator measured the difference between the 12-month percentage rate-of-change in the Producer Price Index versus the same measure for the Consumer Price Index. If Indicator #2 was bullish, the Dow's cumulative growth was +158,563% versus a -64.8% decline if it was bearish.
The third indicator simply measures the one-month percentage change in the Producer Price Index. If PPI Indicator #3 was bullish, the Dow's cumulative growth was +203,131%; if not bullish, the cumulative decline was -73%.
Combining three inflation models into one
As Jay noted, there are a variety of useful ways to interpret PPI inflation, as covered above. He then combined the indicators discussed in Part I into one comprehensive model.
This model considers the state of all three PPI indicators at the end of each month. If a given indicator is bullish at the end of a month, that adds one point to the model. As such, at the end of any month, the model can read +3, +2, +1, or 0.
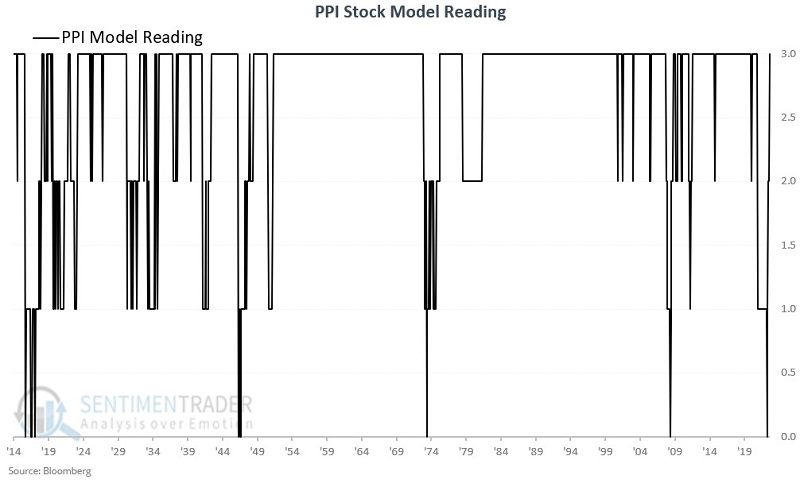
Now let's look at how these readings relate to stock market performance.
The logarithmic chart below displays the growth of $1 in the Dow Jones Industrials since 1914 if held only when the PPI Model = +3. This means that all three PPI indicators were rated as bullish at the end of the previous month. The cumulative gain was +908,379%.
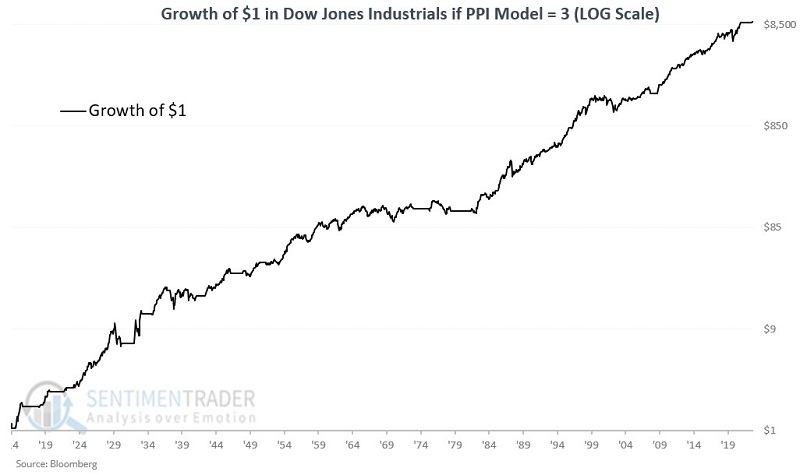
These signals showed a gain 69% of the time, with a median gain of +22.7%, versus a median loss of only -6.6% during the losing signals. More impressively, there were 16 gains of more than +15% versus only a single loss of more than -15%.
The chart below displays the growth of $1 in the Dow Jones Industrials since 1914 if the PPI Model = +2, +1, or 0.
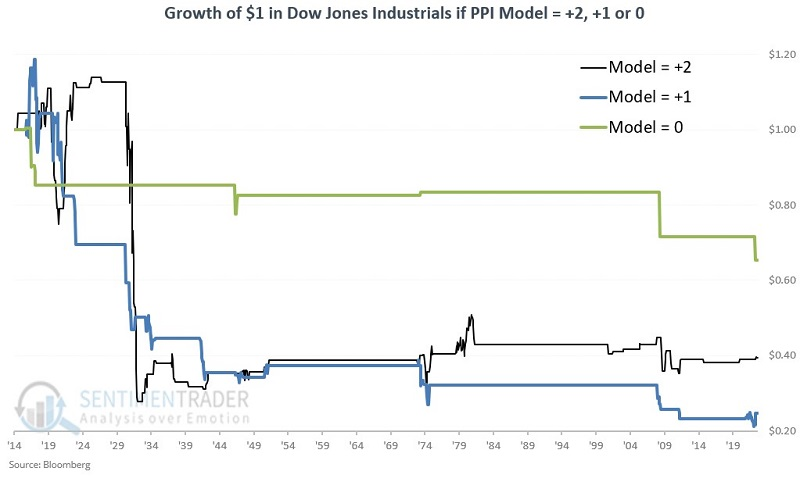
The results were uniformly unfavorable, with a cumulative loss of -94%. The Dow showed a gain 66% of the time during sell signals. So a sell signal from this model is not a death sentence for the stock market, but several significant bear market declines occurred while the model was bearish.
The PPI Stock Market Model was unfavorable from May 2021 through December 2022, at which point it turned favorable once again. As of February, all three PPI indicators are rated bullish.
So, the combined PPI Model is reading +3 and is considered favorable for stocks.
Economic surprises are breaking out to the upside
Dean noted that the Citigroup Economic Surprise Index closed at a new 6-month high. After similar breakouts, the S&P 500 was higher a year later in all but one case, while bonds and gold tended to struggle.
The Citigroup Economic Surprise Index (CESI) measures economic data relative to market expectations. Index readings above zero indicate economic releases have been coming in better than expected. Last week, it closed at the highest level in six months, with the index above zero. The breakout occurred after the index cycled from a pessimistic reading of -50.
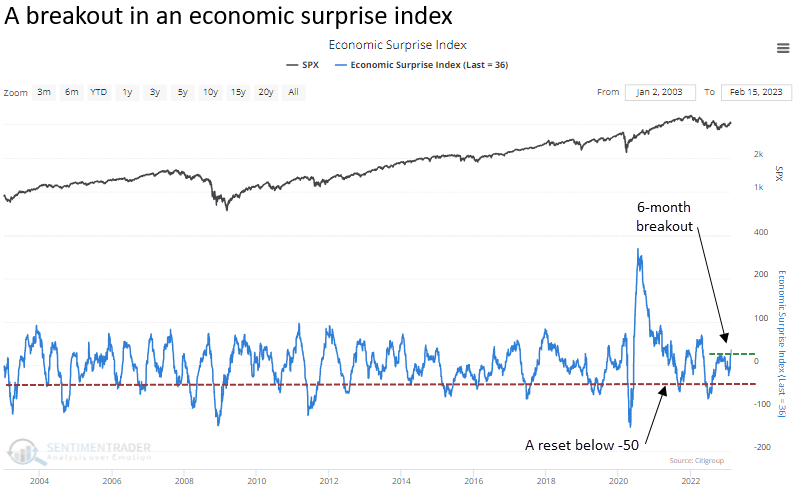
When it cycled like this in the past, it tended to keep rising. In the long run, fundamentals drive stock prices. However, in the short run, especially in bear markets, surprises relative to expectations dictate price action.
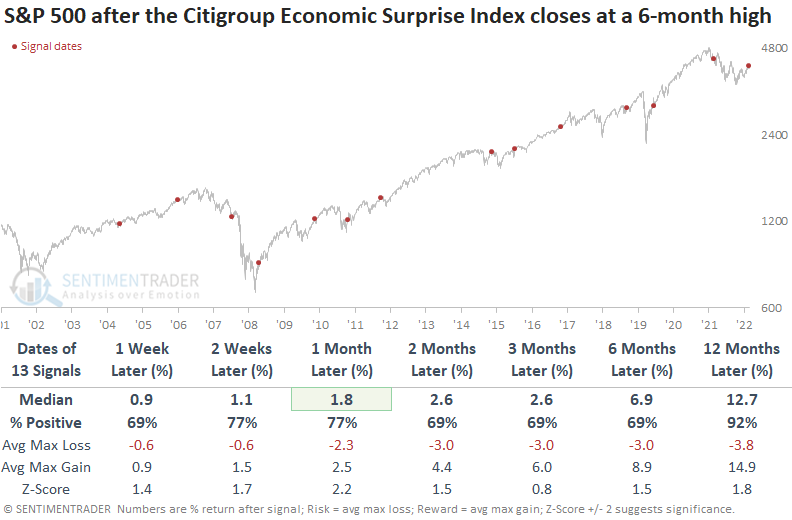
From a sector perspective, cyclical groups performed better than defensive ones when economic releases beat expectations. The TLT ETF was lower two months later in 11 out of 13 previous instances, and gold tended to struggle with gains two months later only 38% of the time.
Adjusting breadth trusts for volatility
Whenever we look at something like breadth thrusts or evidence of overwhelming pressure either way, as we have in recent months, we get the usual poo-poos about their efficacy given high-frequency trading, zero-dated options, or a handful of other excuses.
For over 20 years, we've acknowledged that breadth statistics are fluid and influenced by various factors. The most significant factor is one that few discuss anymore - the impact of decimalization when stocks ceased trading in fractions.
The chart below shows the daily Up Issues Ratio (Up Issues / (Up Issues + Down Issues)) for the S&P 500 since 1950, along with its rolling one-year standard deviation. The impact of decimalization seems clear, and it's really the only factor we've looked at that seems to have had a pronounced and lasting impact.
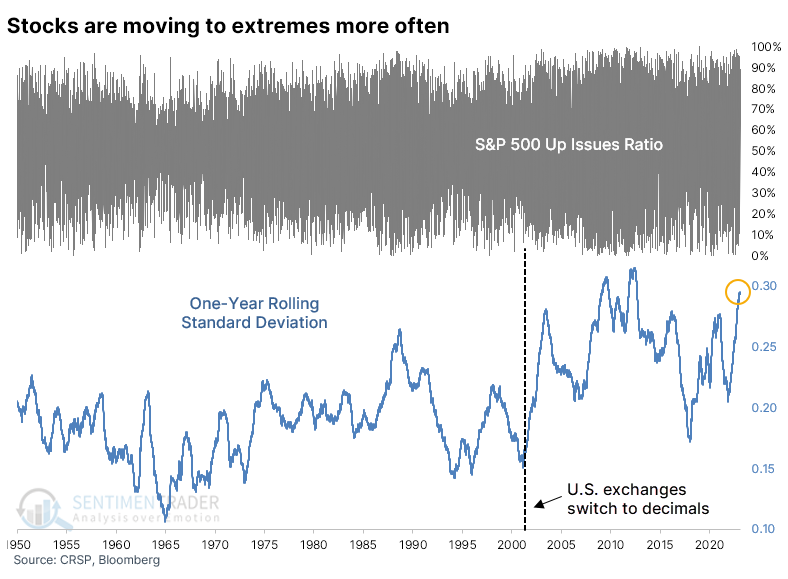
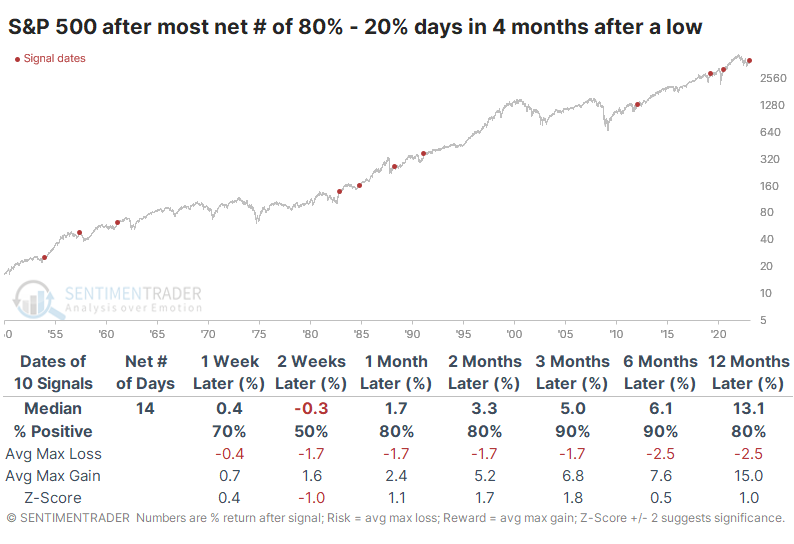
If we net out the number of 80% days (overwhelming buying pressure) minus 20% days (overwhelming selling pressure), the last four months since the S&P 500's bottom still rank among the best.
The table below is similar to the one we looked at last week. It shows the four-month periods following a 52-week low in the S&P 500 with the highest net number of heavy buying days. While not as compelling as the study from last week, the S&P's returns were still very good, with only one meaningful loss within the following year. That was in 1957 when the S&P was trading near an all-time high; not the case now.
After the opposite scenarios, those four-month periods following a bottom with the fewest net number of overwhelming buying days, returns were quite a bit worse. Again, this isn't as drastic as what we saw last week, but it still showed worse consistency and more risk than bottoms with many days of buying interest.
Risk-on factors outperforming to start the year
Through the first 30 days of 2023, risk-on factors handily outperformed risk-off factors. The average difference between multiple factors was the 2nd-largest of any year since 1950.
Until recently, investors had a clear risk-on mentality to start the year. Through the first 30 sessions of 2023, Cyclical stocks outperformed Defensive stocks, Small-caps outperformed Large-caps, and Growth outperformed Value.
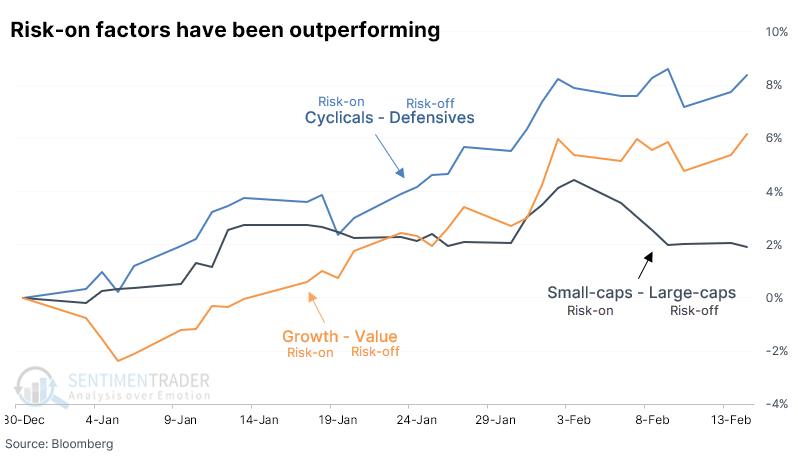
The average outperformance of risk-on versus risk-off factors at the start of the year, at +5.5%, has been the 2nd-largest since 1950.
As we saw with the Nasdaq vs. the Dow, when investors have been in a clear risk-on mood to start a year, they tend to continue in the months ahead. Only one of those years ended up with a (minor) loss over the next three months, though in 1987, it ultimately proceeded into the October crash.
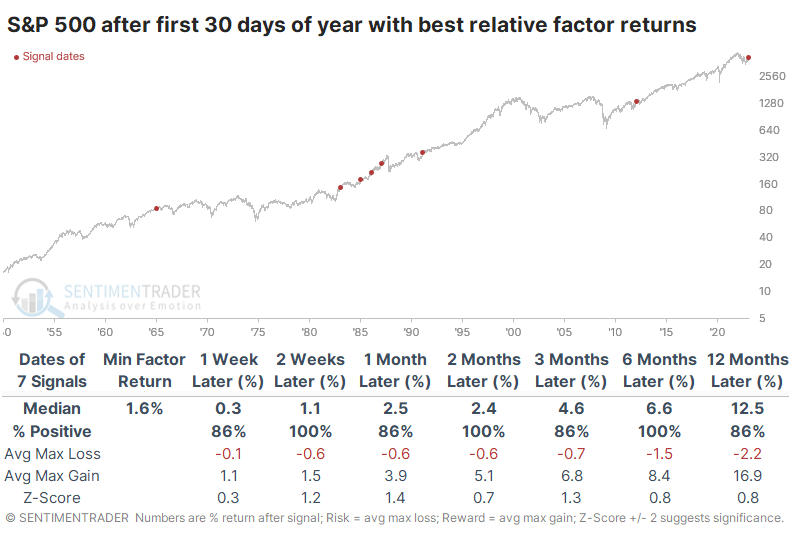
Risk was limited relative to reward during the next six months, with no losses larger than -5.4% within those next six months.
During the years with the worst relative returns between risk-on and risk-off factors, risk was higher, reward was lower, and there was an increased probability of a negative return (with the usual caveats about tiny sample sizes).
Trend-following sell signals in Hong Kong
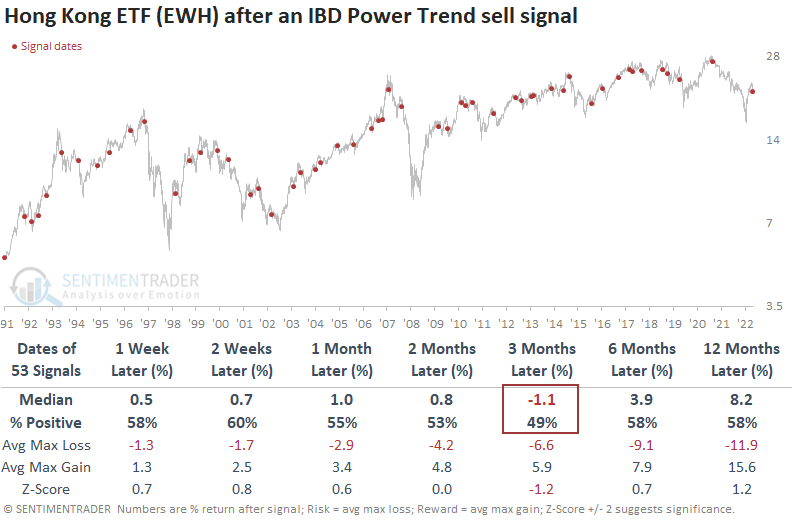
Dean showed that the Investors Business Daily Power Trend strategy triggered a new sell signal for Hong Kong. After similar trend changes, the ETF showed flat to slightly negative returns over the next three months.
The Investors Business Daily Power Trend strategy involves the following:
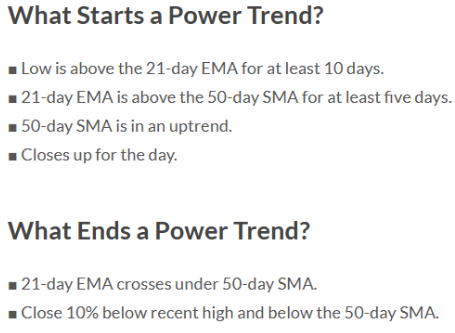 Using that system, on Tuesday, the Hong Kong ETF (EWH) triggered an IBD Power Trend sell signal.
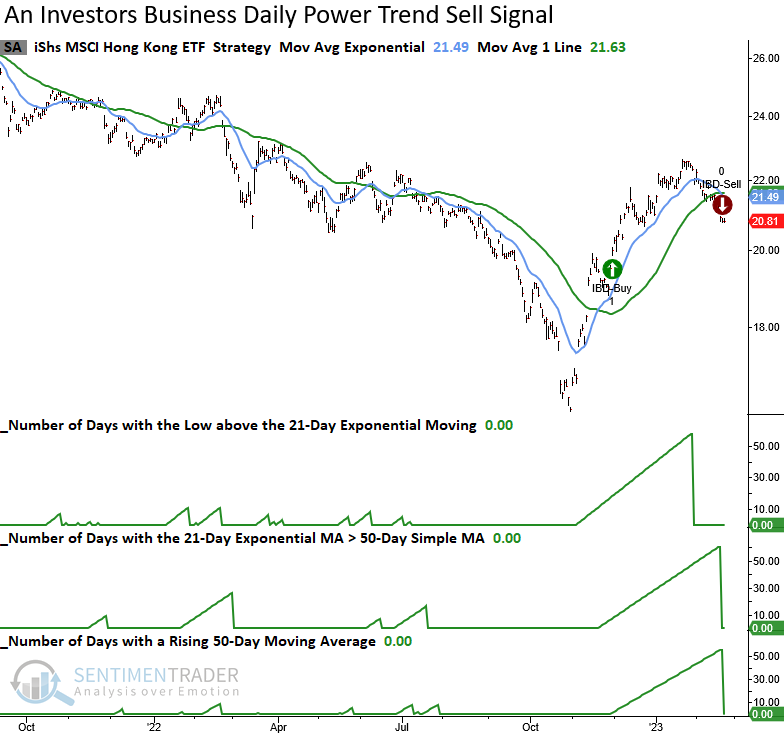
When an IBD Power Trend sell signal occurs, the Hong Kong ETF (EWH) struggles on a short to medium-term basis, especially three months later. After a 40% trough-to-peak rally since last October, a consolidation in Hong Kong stocks seems appropriate.
Dean went on to further outline several other Chinese funds and individual stocks that have recently triggered sell signals, as well as an overall composite model that aggregates all the signals into a single model.
The good and bad with gold stocks
Jay noted that gold stocks rallied over +50% following the September 2022 low and have since fallen over -18% and triggered a useful oversold indicator in the process. While some view this as a buying opportunity, several key indicators suggest caution.
He noted that gold mining stocks triggered several long-term oversold signals last fall, which remain in effect. But recent selling pressure has been persistent. For example, Dean noted that HUI registered its tenth consecutive lower close. Ten consecutive down closes are infrequent and historically have marked some terrific buying opportunities.
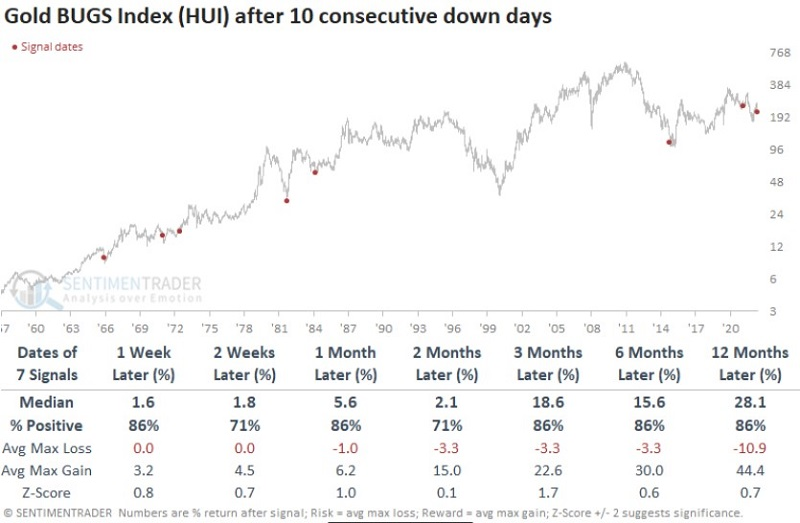
The good news for gold stock bulls is that the favorable periods following the above signals still have time to run. But there are some other considerations. The chart below displays the annual seasonal trend for VanEck Gold Miners ETF (ticker GDX), which shows a seasonal peak right about now.
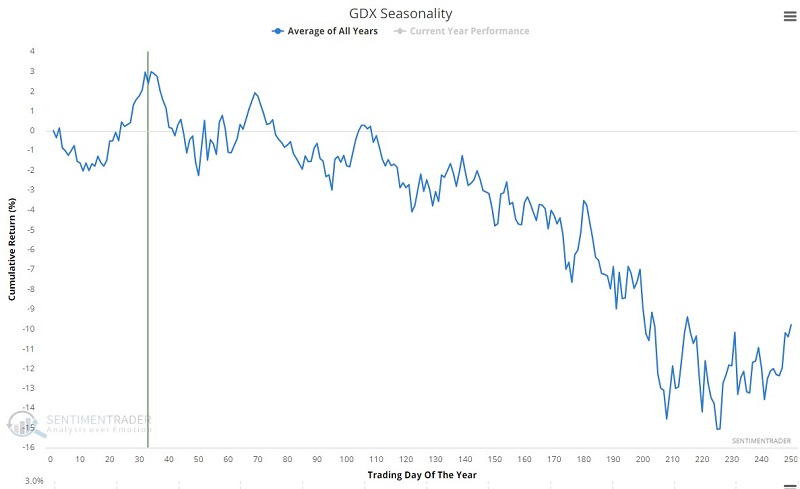
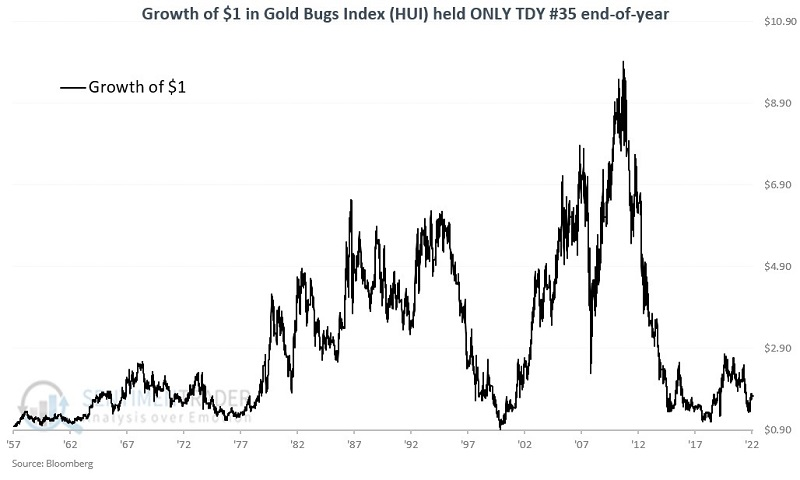
The chart below shows the growth of $1 in the Gold Bugs Index held starting on Trading Day of the Year (TDY) #35 through year-end. Whatever favorable bias may have existed during the first 34 days of the year is not apparent here.
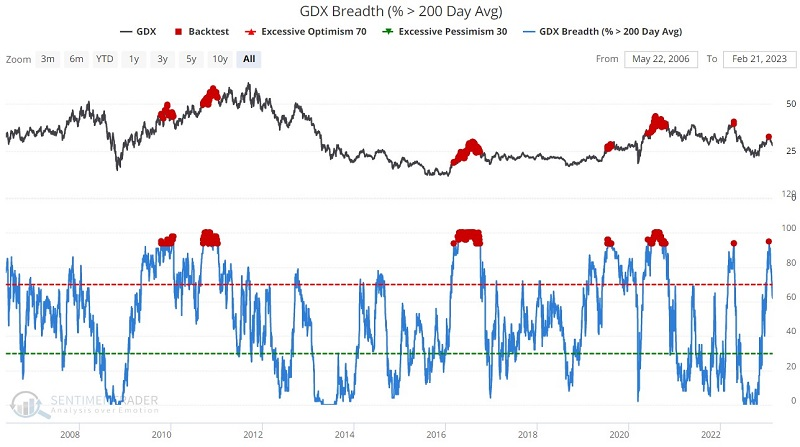
Jay outlined some other concerns, like excessive optimism in our Optimism Index. This is understandable, given the run in stocks that pushed more than 94% of them above their 200-day moving averages. The GDX index has struggled after such high readings.
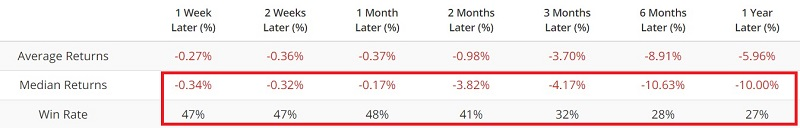
The most recent unfavorable signal occurred on 2023-01-26, and the results above also suggest the potential for poor GDX performance as 2023 progresses.
About TradingEdge Weekly...
The goal of TradingEdge Weekly is to summarize some of the research published to SentimenTrader over the past week. Sometimes there is a lot to digest, and this summary highlights the highest conviction or most compelling ideas we discussed. This is NOT the published research; rather, it pulls out some of the most relevant parts. It includes links to the published research for convenience, and if you don't subscribe to those products, it will present the options for access.