
TradingEdge Weekly for Feb 2 - Three months of momentum, sector surges, soybean setup

Key points:
- Momentum in stocks shifted from one extreme to the other, then kept adding to gains
- As January goes...
- ...actually, as November, December, and January goes
- In fact, any three-month thrust has very bullish implications
- The S&P 500 enjoyed a nearly straight-up multi-month rally to record highs
- A core group of our indicators is almost universally signaling risk-on behavior
- There are some nascent signs of oddities under the surface
- Information Technology was the only sector accompanying the S&P 500 to record highs
- There has been an expansion in new highs among health care stocks
- An MLP fund has showed relatively consistent seasonality since its inception
- It's time to keep an eye on soybeans
Momentum shifted, and stocks added to gains
Dean showed that the Relative Strength Index (RSI) for the S&P 500 Cycled from < 30 to > 70, and the Index gained 7% over the subsequent two months instead of backing off once the indicator became overbought. Comparable price momentum signals led to a short-term pause within the context of an uptrend.
Let's assess the outlook for the S&P 500 after its Relative Strength Index (RSI) transitioned from under 30 to above 70, followed by an index surge of 7% or more over the ensuing two months.
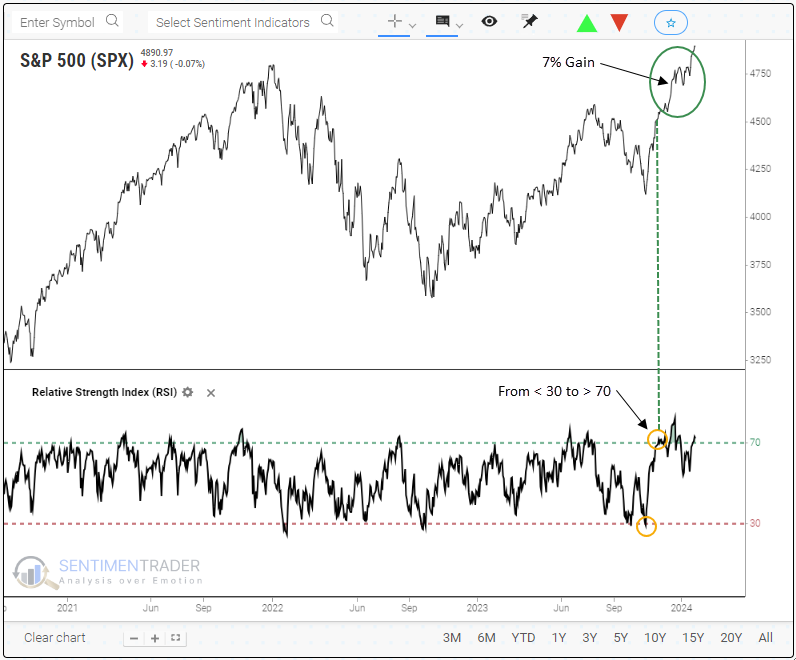
Since 1928, the Relative Strength Index (RSI) for the S&P 500 has cycled from oversold to overbought 97 times. The 7% return at the two-month mark ranks as the best gain since the July 2009 signal.
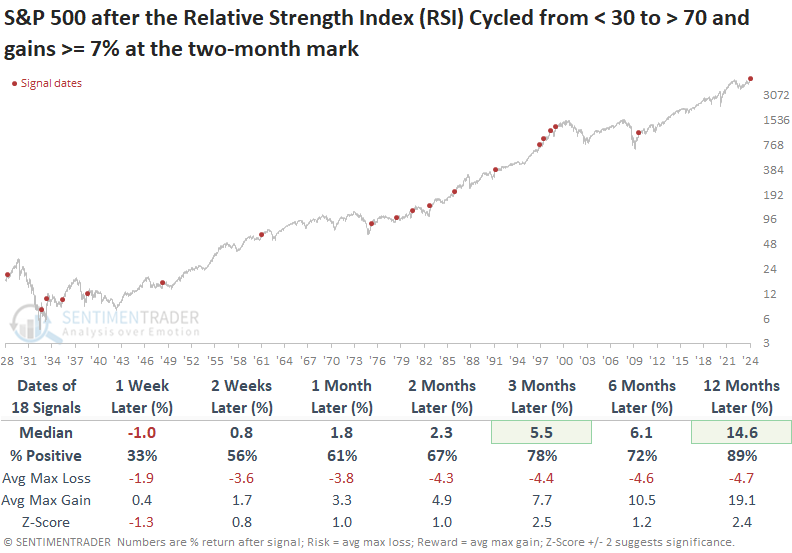
If we project the date two months forward from the original signal dates, the S&P 500's outlook hints at a potential pause in the world's most benchmarked index over the next month. That was especially the case since 1975, with all 11 precedents displaying losses at some point over that same time frame.
However, this is likely a temporary pause, serving to reenergize the uptrend in the S&P 500. A year later, the index was higher 89% of the time.
January gains suggest more to come
The January Barometer suggests that stock market performance during January tends to foreshadow performance for the rest of the year. Jay examined the performance of this approach and suggested a simple tweak to improve long-term performance significantly.
The theory is simple: As January goes, so goes the rest of the year. In reality, a more accurate theory might state: If January is up, buy and hold stocks for the rest of the year; if January is down, consult another indicator to tell you what to do the rest of the year.
The chart below displays the growth of $1 invested in the S&P 500 Index from the end of January through the end of December of the same year if the S&P 500 showed a gain during the month of January. The cumulative gain is +18,169%.
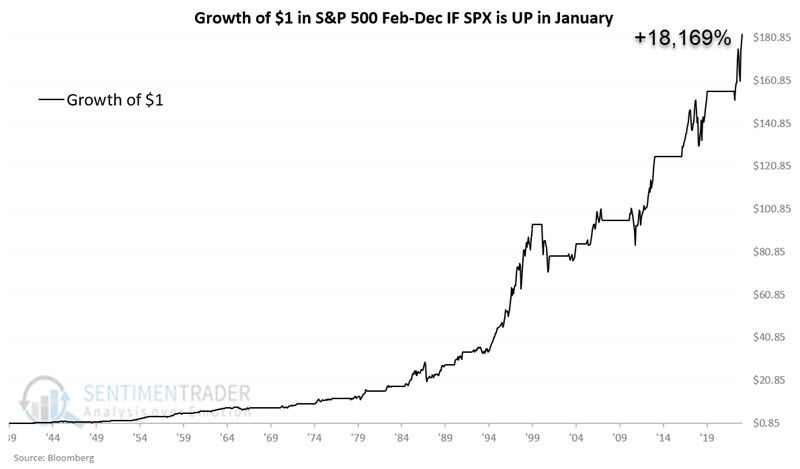
On the other hand, if the S&P 500 showed a loss during the month of January the cumulative gain is only +115%.
Let's examine the results of the two following "strategies:"
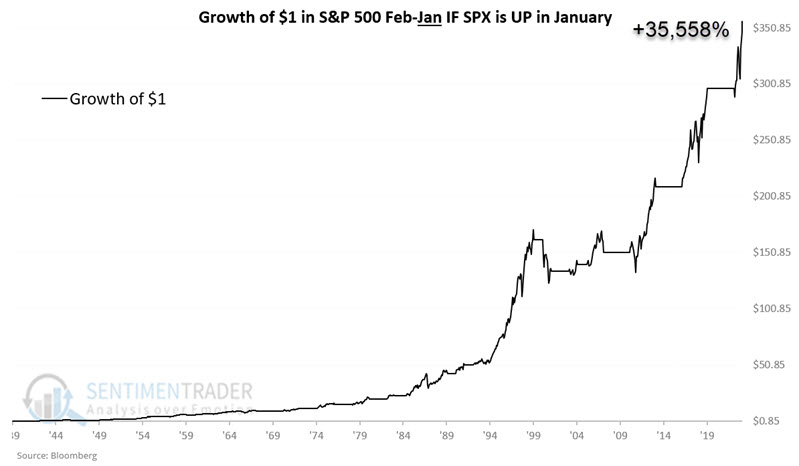
Strategy A: If January shows a gain for the S&P 500 Index, hold stocks for 12 months (i.e., through the end of January next year) instead of 11 months
Strategy B: If January shows a loss for the S&P 500 Index, avoid stocks for 12 months (i.e., through the end of January next year)
The chart below displays the growth of $1 using Strategy A. The cumulative gain almost doubles - from +18,169% to +35,558%.
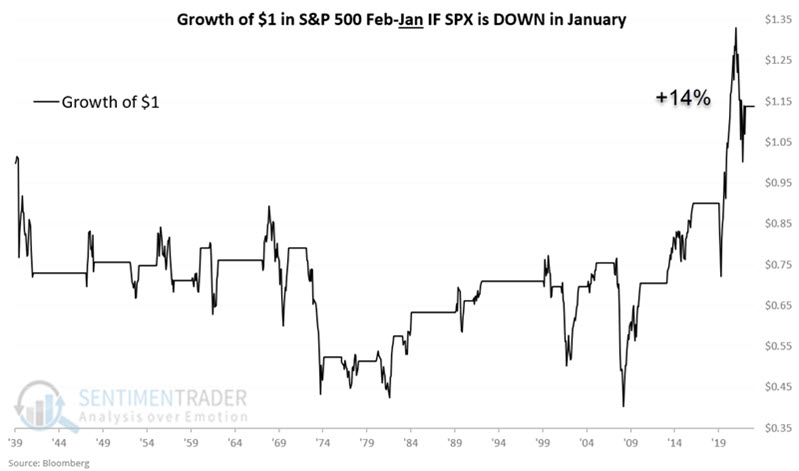
The chart below displays the growth of $1 using Strategy B. The cumulative gain was +14%.
Jay added some tweaks to the rules to create a trading system using January performance that has preceded drastic differences in returns.
A positive January completed a bullish trifecta
Jay further noted that the S&P 500 registered its third straight up month, with the third month being January. We refer to an up November, December, and January as a "November-January Trifecta" and the market has performed well during the 12 months following these signals.
The chart below displays the growth of $1 invested in the S&P 500 only during the 12-month periods following a Trifecta.
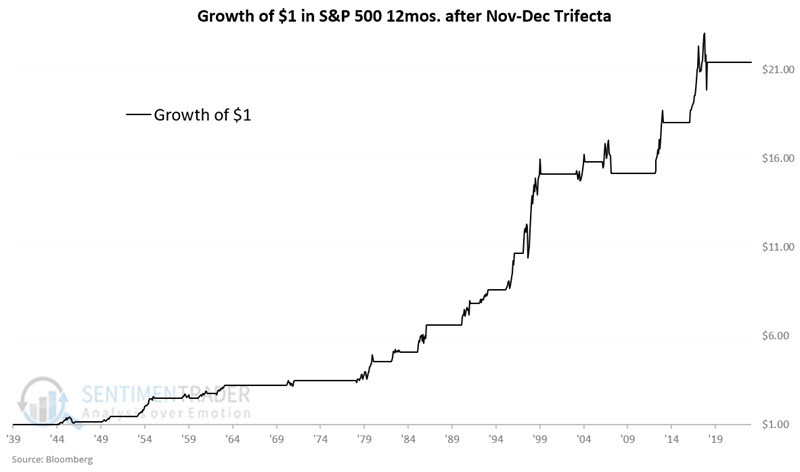
The overall Win Rate of 87% is compelling. One concern is that two of the last four trifectas (2007-2008 and 2018-2019) were followed by 12-month declines for the S&P 500 Index. Likewise, 1946-1947 witnessed a significant decline of -15.7%. This serves as a reminder that there are no sure things in the stock market and that this should be viewed not as a trading system but rather as a weight of the evidence indicator.
On the plus side, the average and median gains (18.5% and 17.6%, respectively) far outstrip the average and median declines (-8.0% and -4.2%) and 12-month moves of 15% or more skew positive by an 11-to-1 ratio. If the market will make a big move in 2024, history strongly suggests that the move will be to the upside.
In fact, any three-month thrust is a positive
The S&P 500 Index closed January with a 3-month gain of +15.5%. Jay further noted that in the last 70+ years, the market has shown a strong tendency to continue higher following thrusts of this magnitude, no matter which month it was.
The table below displays all the months since 1955 when the S&P 500 registered a 3-month gain of +15% or more and subsequent S&P 500 performance.
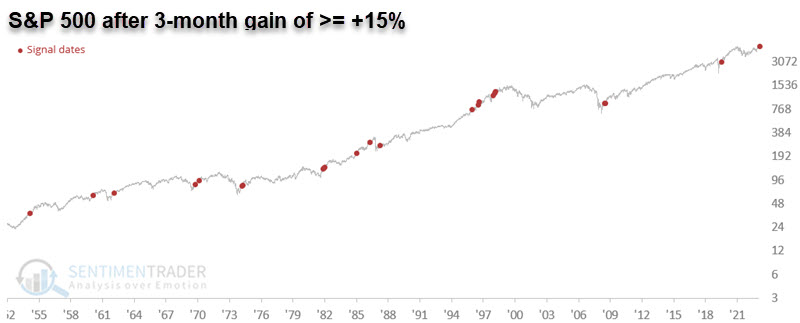
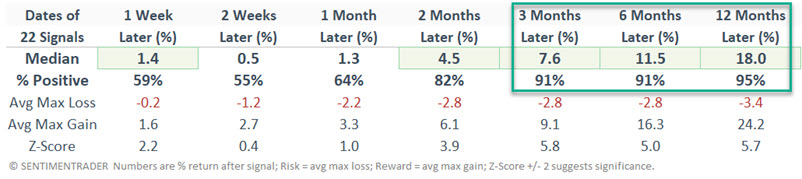
Note the high Win Rates - particularly for 3-months to 12-months - and the strong returns (12-month median return = +18%).
It is not necessarily recommended that the indicator above be used as a standalone trading model. However, we will consider it as such to illustrate performance. The rules are simple:
- If the S&P 500 Index closes a month with a 3-month gain of +15% or more, buy the S&P 500 Index
- Hold the index fund for 12 months
- If a new signal occurs within those 12 months, extend the holding period another 12 months
- Sell the S&P 500 Index at the end of the holding period
The chart below displays the growth of $1 invested in the S&P 500 during these signals.
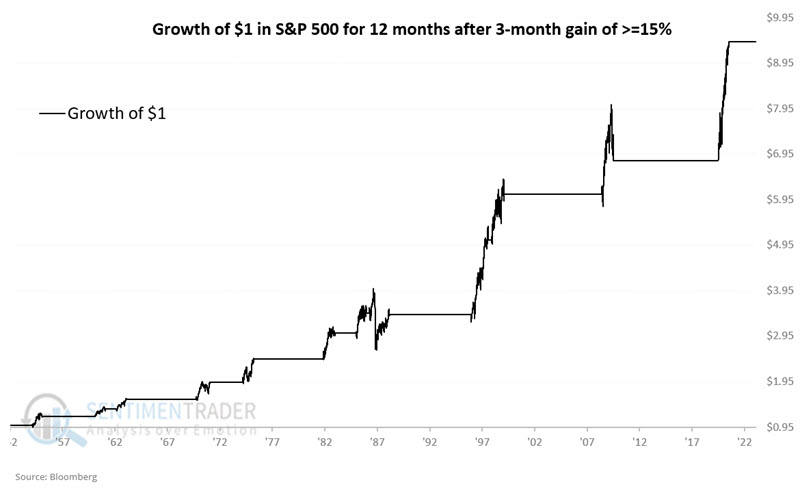
The results above are compelling, but it is important to remember that there is a difference between hypothetical backtests and actual trading. Note that the signal in March 1987 would have resulted in riding the 1987 decline and Crash all the way to the bottom (a -33.5% decline from peak to valley). So remember, there are no "magic" indicators - only weight of the evidence.
A straight-up rally to record highs
The most benchmarked index in the world has gone essentially straight up since October and is sitting at record highs. Bulls couldn't ask for much better.
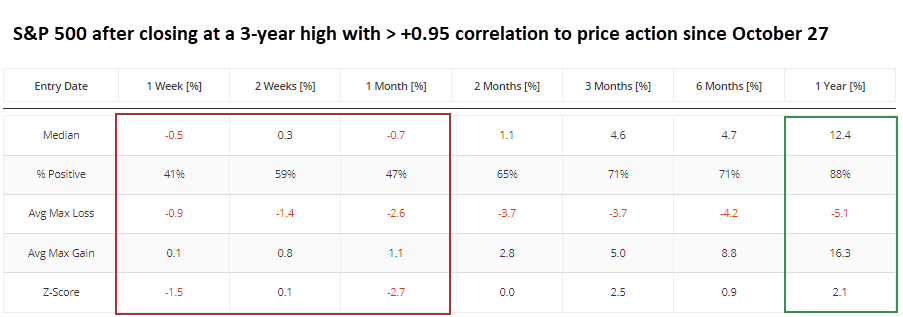
The chart below shows the last few times this pattern was triggered. These are times when the S&P 500 closed at least at a 3-year high, and the past 61 trading days had a +0.95 correlation to the price action we've seen since October 27. Basically, straight-up rallies.
The green arrows and dots show the entry, and the red arrows and dots show one month later.
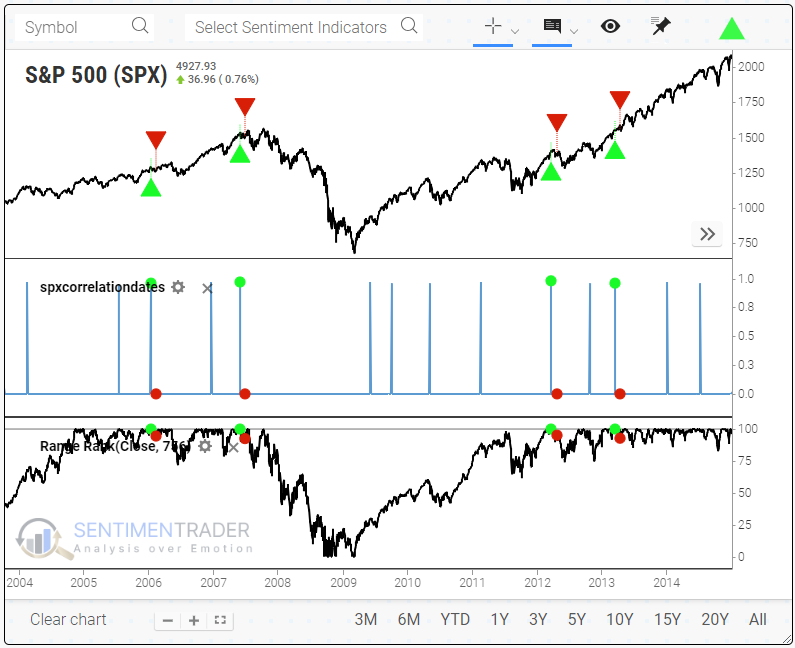
These weren't great times to jump on the rally. Since 1930, the S&P continued to gain 47% of the time (8 winners and 9 losers) over the next month, with a median return of -0.9%.
Looking at different Time-in-Market returns, we can see that short-term returns were pretty weak overall but strengthened from three months and beyond. Over the next year, the S&P 500 was positive 88% of the time, with a median return of +12.4%. The two outright failures occurred in 1983 and 2007.
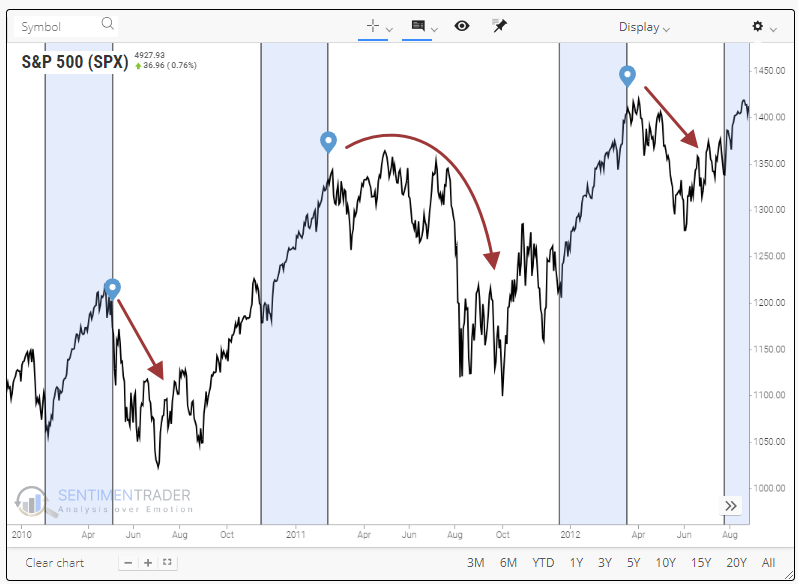
In the about-to-be-released Correlation Pattern Match tool, we can scroll back and see how these straight-up rallies ended up preceding immediate corrections following the initial rebound off the 2009 market bottom.
Because the most benchmarked index in the world has gone almost straight up for months and recorded multiple record highs, contrarians want to assume we must be headed back down. Sometimes, that's happened. But historically, when price action has been the most similar to the past few months, that hasn't been the case, at least not in any meaningful way. Returns up to a month later were negative but inconsistently.
Notably, the following year was positive after 15 of 17 times when investors pushed S&P 500 stocks as they have since late October. Momentum is a powerful force, which we can see in this test. Times when the S&P managed to go for months with barely a blip and recorded at least a 3-year high to boot showed a strong tendency to show gains over the following year.
Almost all indicators are back to risk-on
The Sentimentrader Risk On/Off Indicator increased above 90% for the first since July 2023. Dean showed that similar readings suggest some short-term digestion within the context of an uptrend.
The indicator is a composite encompassing 21 diverse sentiment and breadth-based measures, and it just increased to the highest level since July 2023, with 90% of its components in a bullish status. The previous signal from July 2023 registered a max gain of 4.3% before the S&P 500 peaked at the end of the month.
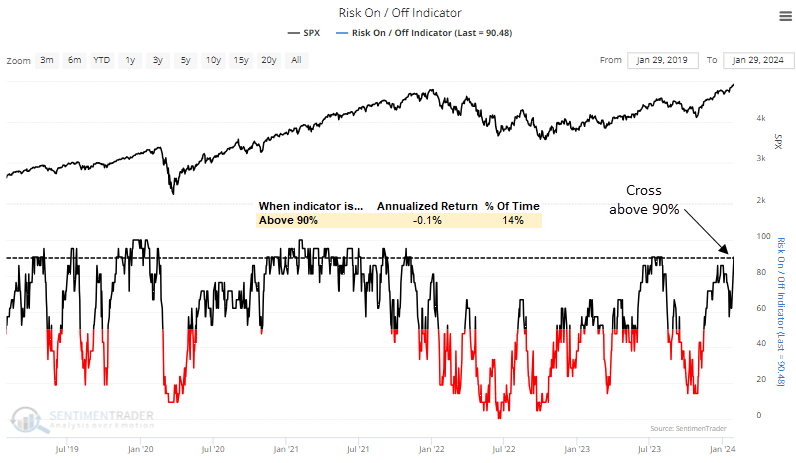
Except for 2002, whenever the Risk-On/Off indicator registered a reading of 90% or higher, it consistently signaled a bullish backdrop for the S&P 500. However, it tended to mark some near-term exhaustion, especially over the following week. And over the subsequent few months, win rates fell short of historical instances in three out of four time periods.
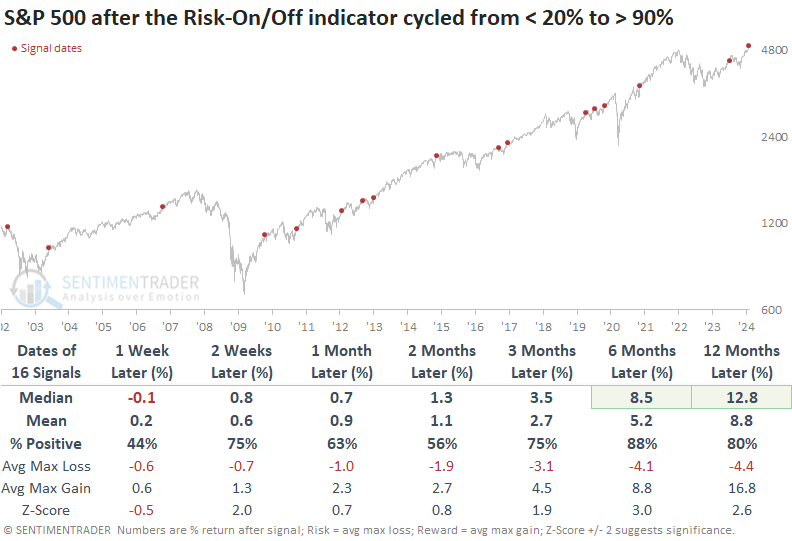
Any digestion of the rapid ascent from last fall will most likely represent a pause, with the world's most benchmarked index showing an 89% win rate over the ensuing six months.
Some odd behavior under the surface
There's something weird happening under the surface of the stock market.
Despite many of the major indexes hitting new high after new high, over the past couple of weeks, there have been several days with individual stocks vastly underperforming the index, and heavily skewed volume into some of those declining issues. Jaunty performance in some of the largest stocks has helped to mask some of this, but it shows up in some of the breadth figures.
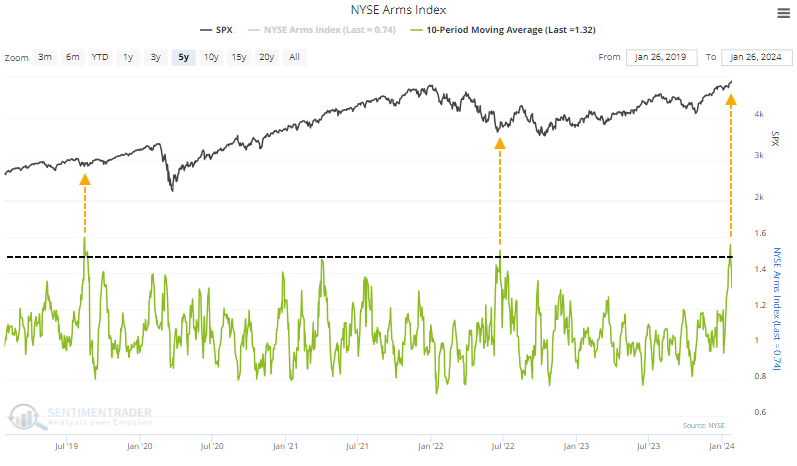
Even though the S&P 500 was hitting all-time highs recently, the Arms Index (aka TRIN) had spiked to a very high level. The indicator was popularized by technician Richard Arms, and calculated as follows:
(Advancing Issues / Declining Issues) / (Up Volume / Down Volume)
Because it is a ratio of a ratio, it can record extremely high or low values if there are a few stocks with extreme volume that are up or down together on a certain day. Using a moving average like ten days helps to smooth out those extreme values. That 10-day average is extremely elevated and high levels are typically associated with heavy selling or downright panic.
This has almost exclusively occurred after a prolonged or sharp decline. And as such, forward returns tended to be robust. From 2-12 months later, the S&P 500's median return was well above random, with low risk relative to reward, and only a couple of losses.
What's especially weird about this signal is that it triggered while the S&P 500 was sitting at record highs. That's never happened before, not even close.
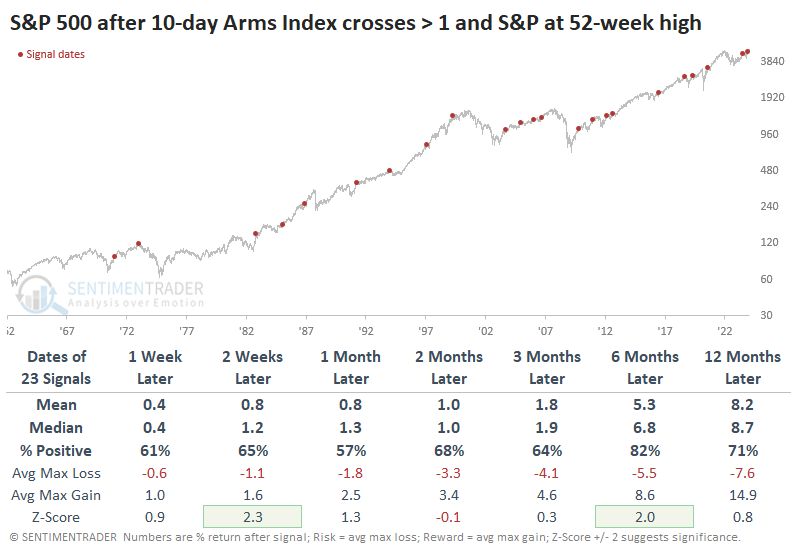
Since the 10-day Arms Index had never been close to 1.5 when the S&P was sitting at a high, we have to relax the parameter. The table below shows times when the S&P was at a 52-week high, and the 10-day Arms was above 1. It's the closest we can come to having a decent sample size with somewhat similar behavior.
This didn't seem to degrade the conclusion of the table above too much. While future returns in the S&P weren't nearly as strong or consistent, they still had a positive skew.
Since the October 2022 bottom, stocks have pretty much done what they're supposed to do. The indexes have mostly performed in line with what the studies have suggested after behavior like we witnessed leading up to and after that bottom.
In recent weeks, there have been a few nascent signs of odd behavior under the surface of the indexes. Nothing to get too hot and bothered about, not even remotely, but odd enough to pay more attention in the weeks ahead.
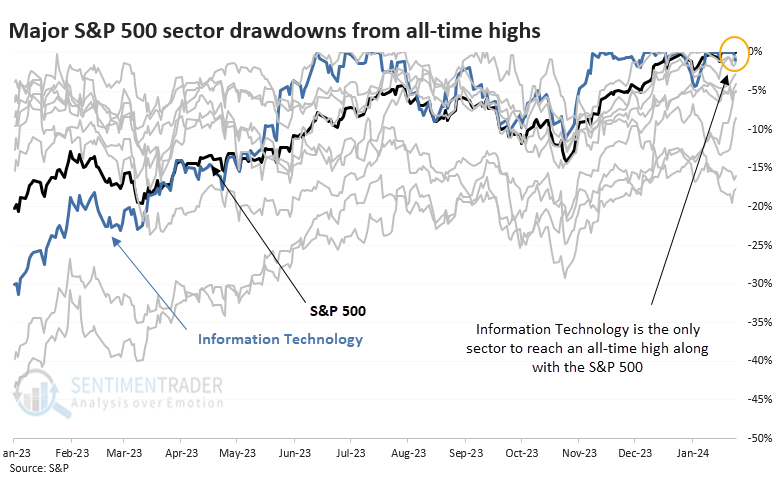
Information Technology was the only sector hitting record highs along with the S&P 500
Much of the gain in the S&P 500 since December, in particular, has come from a handful of stocks. As a result, the information technology sector is the only one that recorded a record high along with the S&P.
Several of the others were close but not quite there. The other sectors that aren't yet at record highs are off an average of -8.1% from their highs, the second-largest divergence dating back to 1927.
Whether it matters or not is really the only thing we're concerned about. Unfortunately, there aren't many precedents to draw from, even with nearly 100 years of history.
The table below shows every instance and the S&P 500's forward returns. The lack of participation at new highs from other sectors had no negative impact. Well, there was that pesky signal from 1929, but even then, the S&P gained double-digits before rolling over.
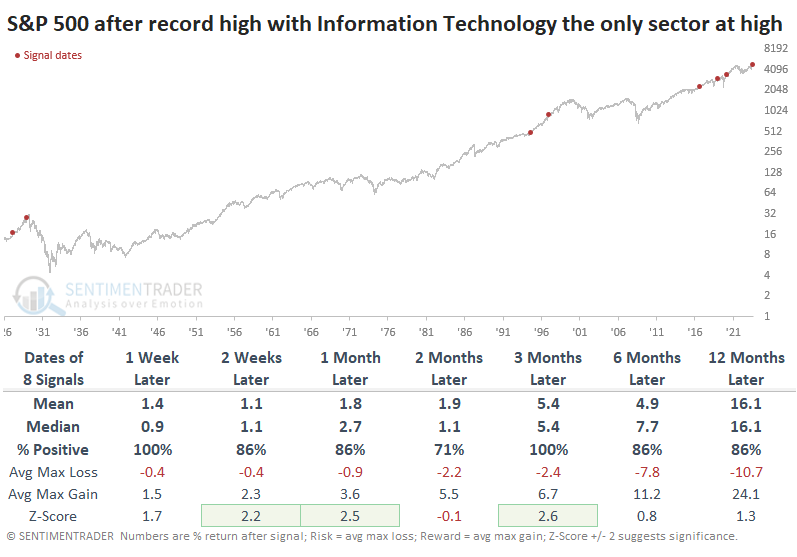
For the information technology sector, returns were generally very good. It did show an extra negative return across most time frames, but it was small. Across sectors and factors, technology showed among the strongest returns, with financials also doing well.
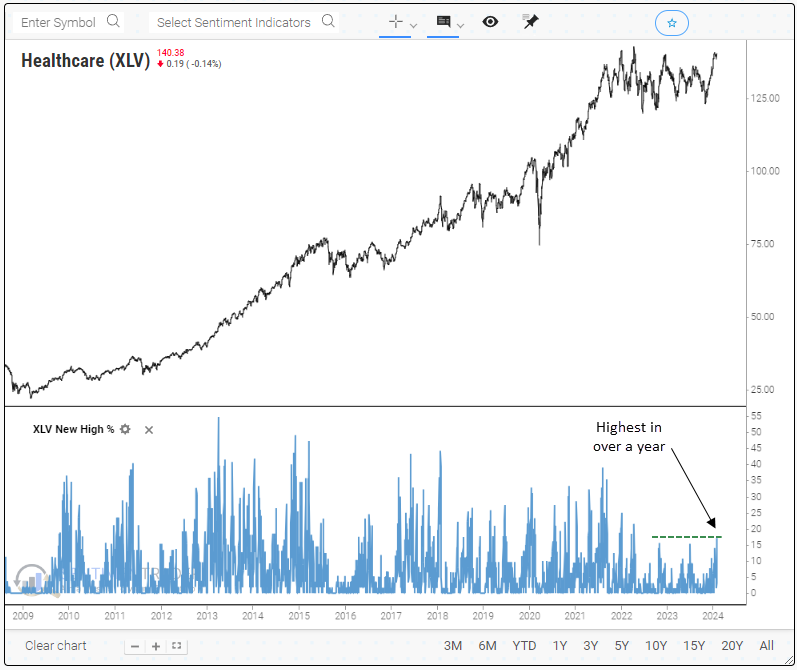
New highs in health care
Dean showed that S&P 500 healthcare stocks registering an annual high increased to the highest level in a year and similar expansions preceded a 94% win rate over the next six months.
Annual highs for the traditionally defensive sector increased above 18%, reaching the highest since April 2022. The expansion in new highs was the second-best reading among all groups, trailing only Financials.
Under circumstances similar to now, when there is an expansion in annual highs within the healthcare sector, the group has demonstrated favorable returns and win rates, particularly over the ensuing six and twelve-month periods.
When examining historical trends related to defensive sectors like healthcare, it is imperative to consider the group's change in character. The transition from growth to defensive growth in the 1990s, similar to Consumer Staples, could result in less favorable returns than historical precedents, especially in bull markets.
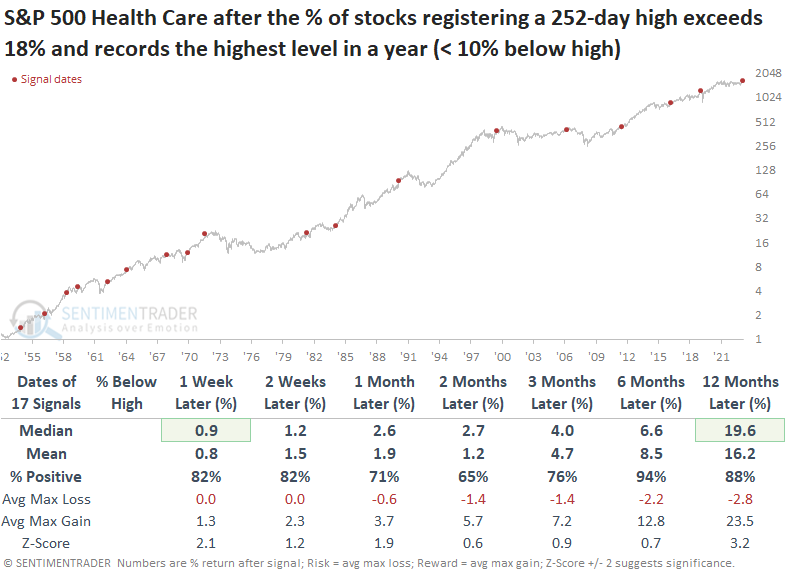
Over the following year, healthcare outperformed all other sectors in a bullish market environment. As always, assessing current absolute and relative trends is critical to determine whether allocating to a group is appropriate. Dean then did a deep dive within the sector to look at the stocks and sub-sectors with the best relative trend scores.
The cyclicality of MLPs
A master limited partnership (MLP) is a publicly traded company that offers certain tax benefits of a private partnership. Jay noted that AMLP is an ETF that tracks an index of MLPs and has traded in a highly cyclical manner since its 2011 inception.
The Alerian MLP ETF (ticker AMLP) seeks investment results that generally correspond to the price and yield performance of its underlying index, the Alerian MLP Infrastructure Index. While AMLP generally trends well, there appears to be little rhyme or reason for its price fluctuations. However, under the surface, it tends to move in a relatively reliable cyclical fashion.
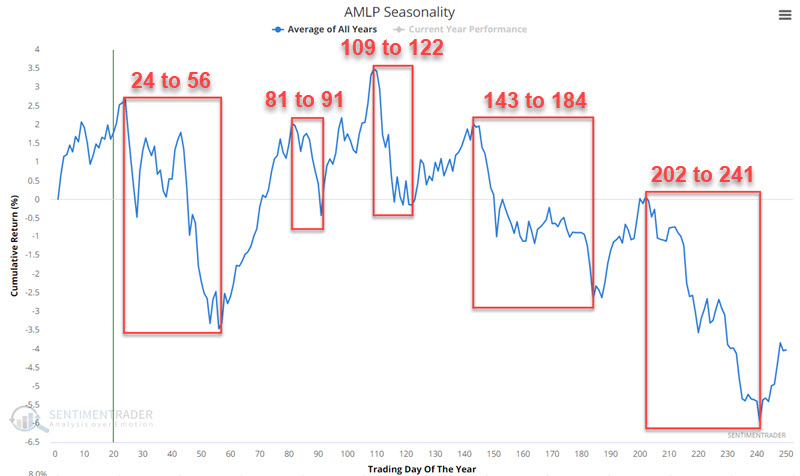
We will use ticker AMLP as our proxy as it tracks an index and is directly tradable. The chart below displays the annual seasonal trend for AMLP based on the Trading Day of the Year. Various generally favorable periods are highlighted in the green boxes.
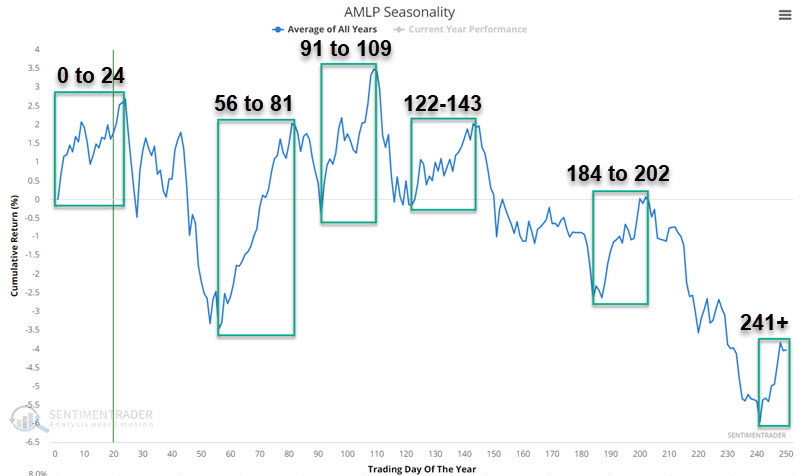
Conversely, the chart below displays the annual seasonal trend for AMLP with various generally unfavorable periods highlighted in the red boxes.
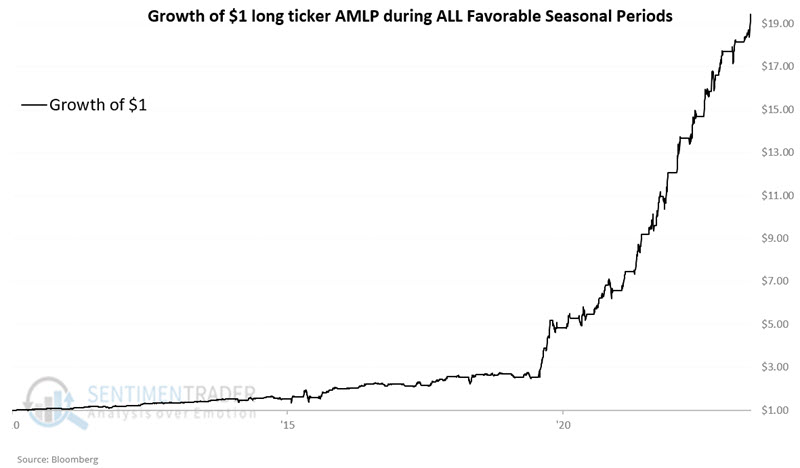
Now, let's combine all of the favorable seasonal periods. The table below displays the hypothetical growth of $1 invested in AMLP only during the favorable periods listed above each year since AMLP started trading in 2010. The cumulative hypothetical gain is +1,845%. Buy and hold since inception returned -40.6%.
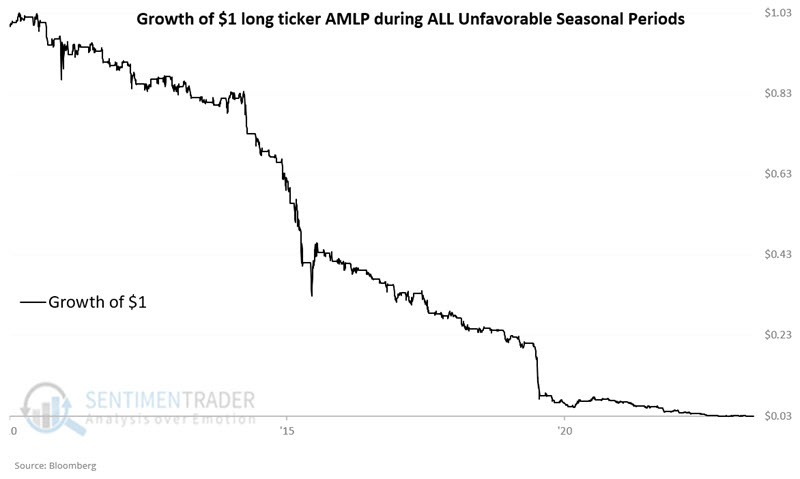
Now, let's combine all of the unfavorable seasonal periods. The table below displays the hypothetical growth of $1 invested in AMLP only during the unfavorable periods listed above each year since AMLP started trading in 2010. The cumulative hypothetical loss is -96.9%.
So far, AMLP is up roughly +4.8% in 2024. The currently favorable period ends at the close of TDY #24 (2024-02-05). The next unfavorable period (TDY #24 through TDY #56) extends from 2024-02-05 through 2024-03-21.
The results above are compelling. However, before one starts getting stars in their eyes, it is essential to consider two things. 1) These results - while based on objective, repetitive cyclical periods - are hypothetical and not real-world results; 2) there can still be sizeable volatility and drawdowns that might be beyond the maximum pain threshold for a given trader.
Keeping an eye on soybeans
Jay noted that soybeans are entering a typically favorable seasonal period. Sentiment is nearing a critical level, and commercial hedgers have been heavy buyers in recent months.
Soybean futures hit a high of 1547 in July 2023 and have stair-stepped lower ever since. Analyzed on a trend-following basis, it is correct to designate soybeans as mired in a downtrend. But as we can see in the longer-term chart below, soybeans are the type of market that tends to turn on a dime (in both directions).
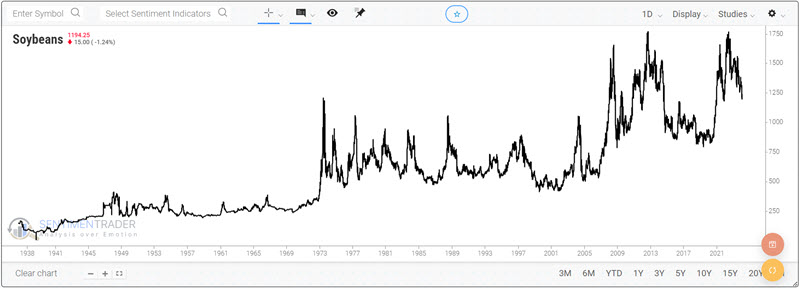
Doubts about the soybean crop for the current year tend to be highest a) when there are no seeds in the ground in the U.S. Midwest (winter into early spring) and b) during planting season when weather can help or hurt the crop (spring).
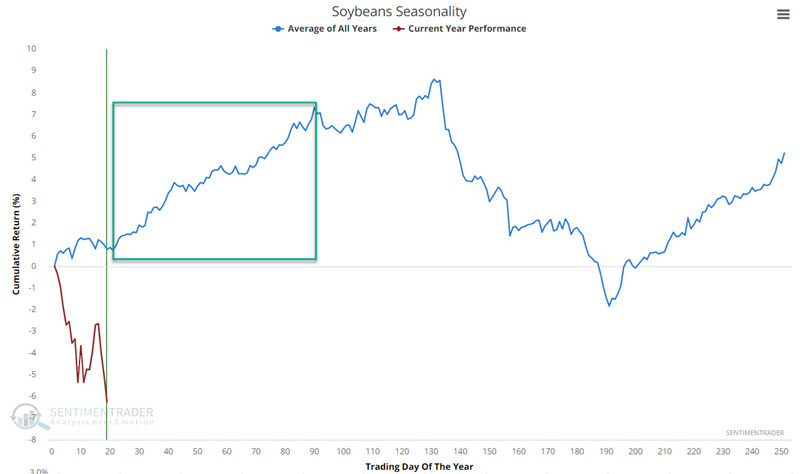
As you can see in the annual seasonal trend chart below, this tends to manifest in rising soybean prices. The chart below highlights the seasonal tendency from Trading Day of the Year #21 through TDY #90 in the green box. For 2024, this period extends from the close of 2024-01-31 through the close of 2024-05-09.
The chart below displays the hypothetical cumulative $ +(-) achieved by holding a long position in soybean futures from the end of Trading Day of Year (TDY) #21 through TDY #90 every year starting in 1937.
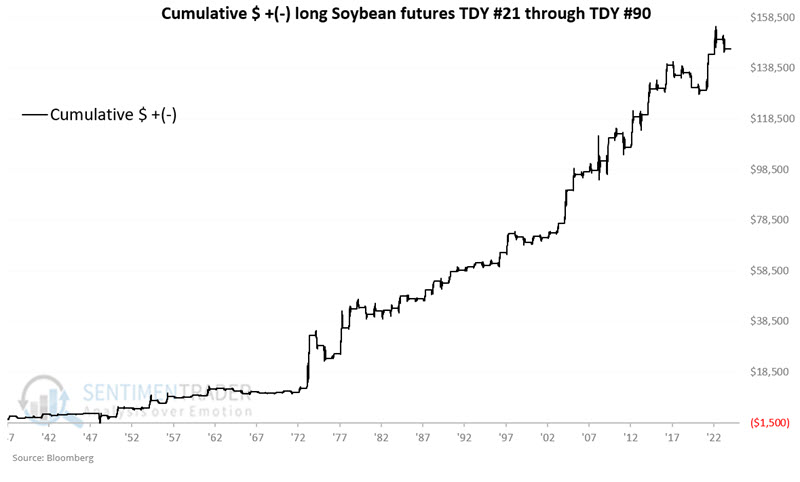
The good news is that overall, positive years significantly outperform negative years on average. The median up year showed a gain of +$1,525 versus a median down year loss of -$751. Even more telling is that years that showed a net gain or loss of $6K or more all skewed to the positive side.
Not surprisingly, as soybean prices have fallen, trader sentiment has declined. The 20-day average of our Soybean Optimism Index value has crossed below 28.5%. When this threshold was crossed, beans moved higher 71% of the time over the ensuing three months.
In addition, commercial hedgers are commonly considered the "smart money," as these traders are involved in the day-to-day operations of each commodity. They have an excellent handle on the underlying market, and it typically pays to follow their positions when they reach an extreme. They are now net long the contract in large size, which has preceded consistent gains.
For those not trading futures, the SOYB fund is a reasonable alternative to track this market.
About TradingEdge Weekly...
The goal of TradingEdge Weekly is to summarize some of the research published to SentimenTrader over the past week. Sometimes there is a lot to digest, and this summary highlights the highest conviction or most compelling ideas we discussed. This is NOT the published research; rather, it pulls out some of the most relevant parts. It includes links to the published research for convenience, and if you don't subscribe to those products, it will present the options for access.