
TradingEdge Weekly for Dec 6 - Far above trend, easing fear, silver cycles

Key points:
- Most major indices are far above their long-term exponential trends, while value stocks are a notable outlier
- The S&P 500 has recorded a lot of new highs over the past year
- Long-term sentiment is still a net positive for stocks
- One positive is the easing amount of fear and last-hour buying interest
- Corporate insiders aren't showing much interest in buying their stocks
- Semiconductor stocks have been struggling
- So has the healthcare sector
- Looking at a cycle model for silver
- Santa Claus may be coming for...corn
Far, far above trend (except value stocks)
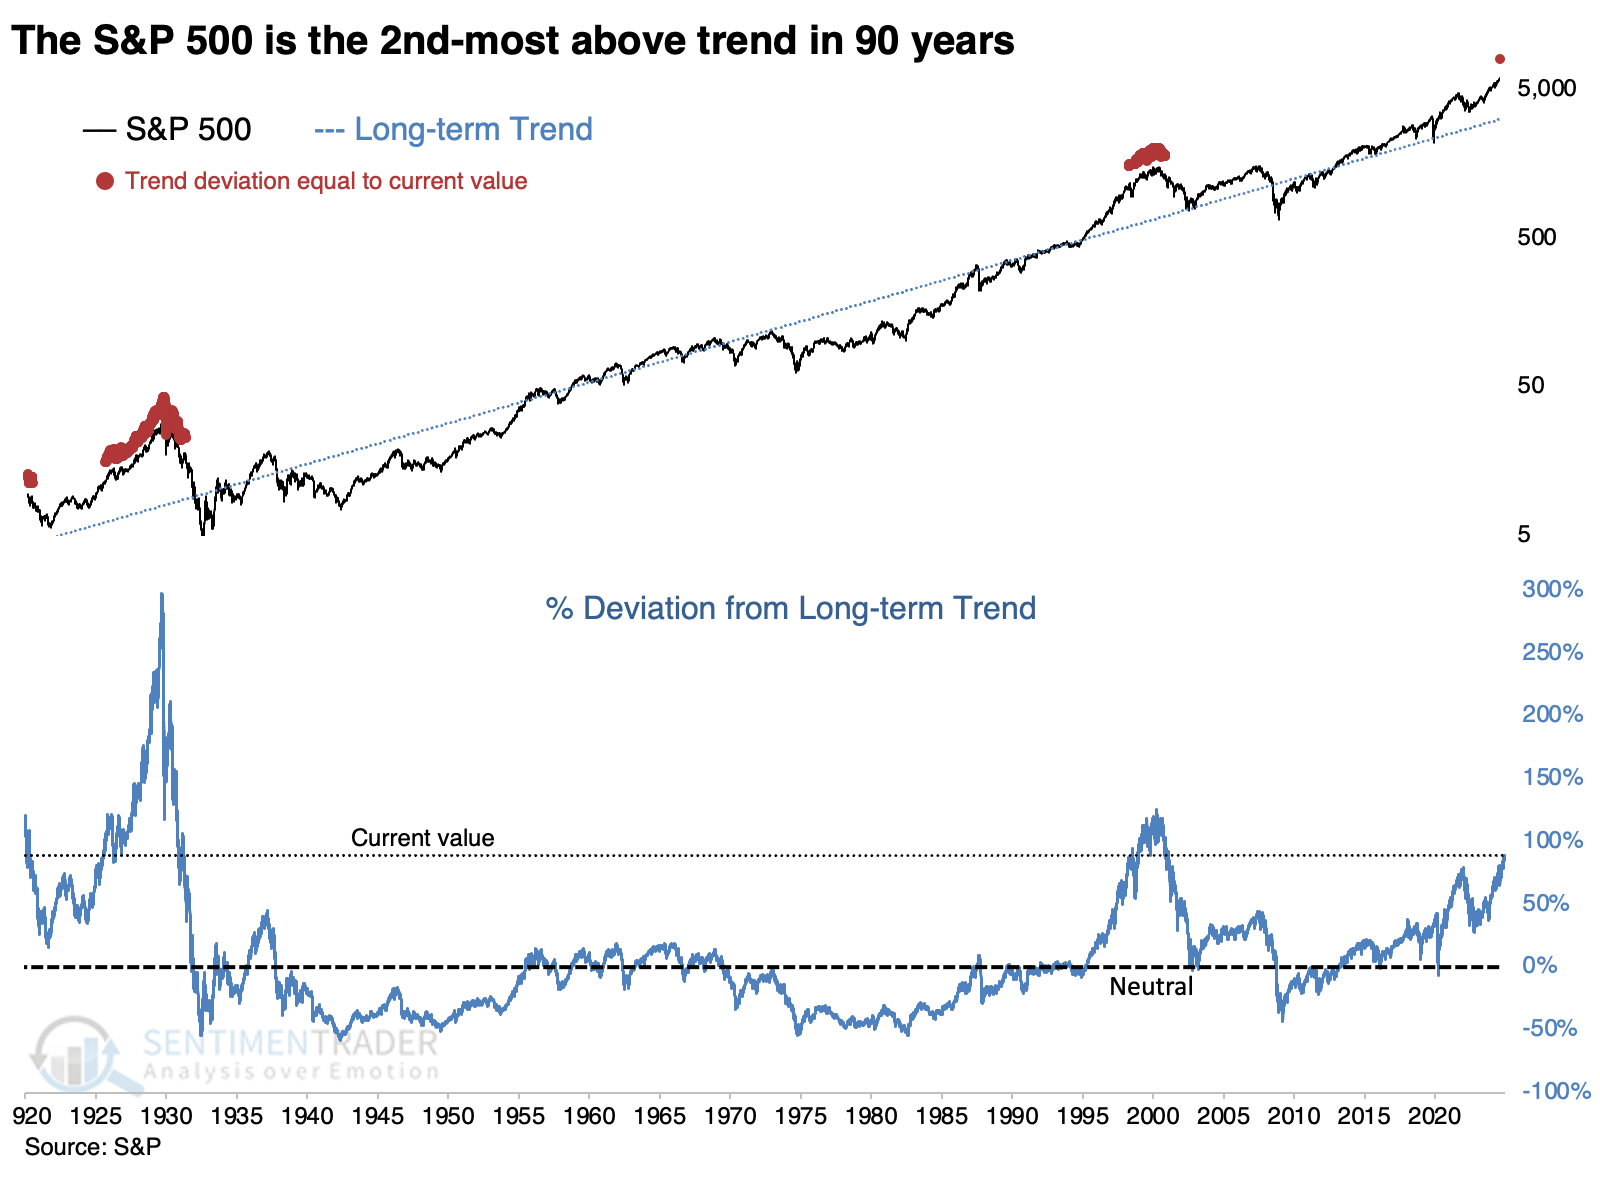
Most indices are wildly above their long-term exponential trends.
Because of the persistency and magnitude of its gains, the S&P 500 is far above its trend. A fair way to measure "trend" would be to calculate its exponential trajectory and look at the current value relative to that trendline so that the index has spent half of its trading sessions above trend and half below.
When we do that, we get the result below, which suggests that the S&P is so far above its long-term trajectory that only the 2000 and 1920s bubbles can compare.
Much of the recent above-trend growth has been due to technology stocks, so we can do the same analysis for the Nasdaq Composite. But that index has had a different trajectory, and its recent performance isn't as exceptional as the S&P 500's.
The Dow Jones Industrial Average is further above its trend than at any point since 1900-01, 1906, and 1929. In recent decades, the Dow exceeded 125% of its trend in January 2000 and January 2022, both leading to year(s) of frustration.
The only one of the "four horsemen" of U.S. equity indices that isn't wildly above trend is the small-cap Russell 2000. With its mini-surge following President Trump's re-election, the Russell has made it all the way to...breakeven.
Those uncomfortable with chasing ever-rising prices of growth stocks can take solace in one of the only areas meaningfully below its long-term trend: the long-suffering value factor. These stocks have rarely been this far below trend over the past ~100 years, and all preceded excellent gains over the following years.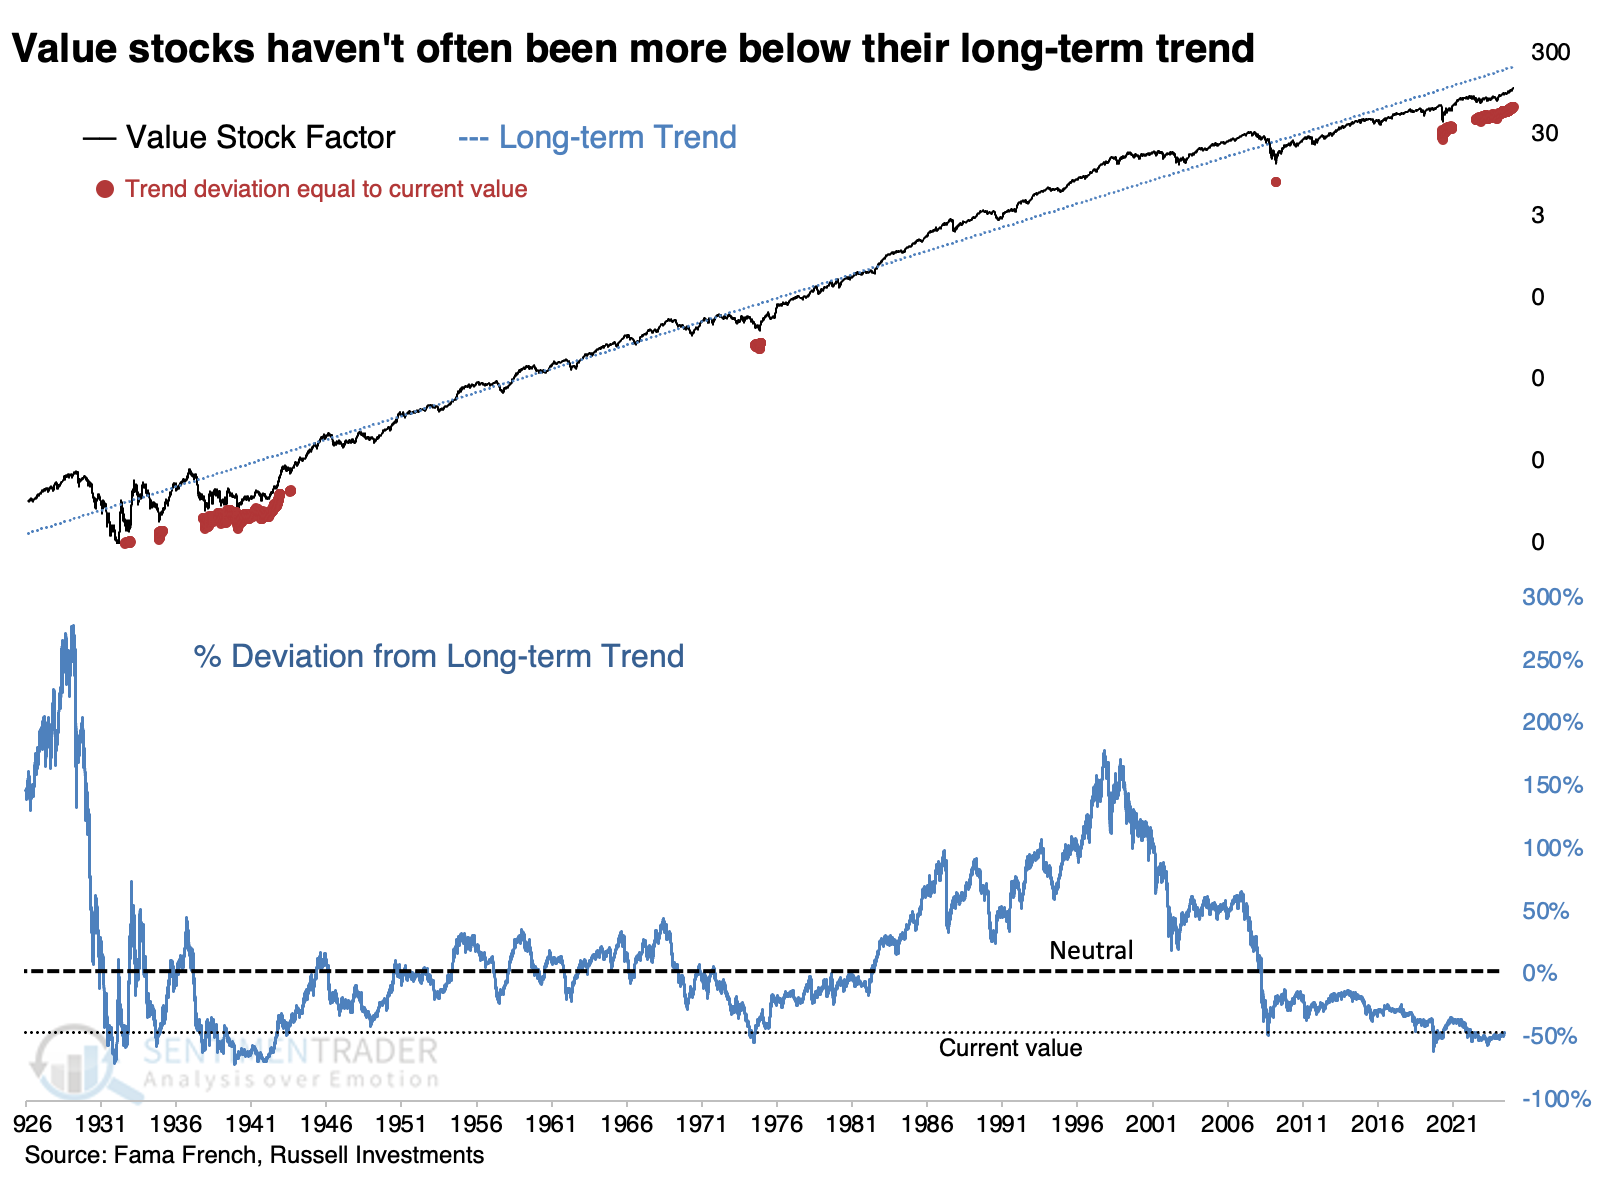
Value stocks have now gone more than nine years with at least a -20% discount to their long-term trend. The only period that compares is late 1943 through early 1944, after which value stocks went on a tear.
Lots of new highs
Thanks to the strong and persistent trends, the S&P 500 has recorded 56 highs over a rolling one-year lookback. Dean showed that comparable surges in new highs produced a 100% win rate for the S&P 500 over the subsequent six months.
The chart below shows that the S&P 500 achieves an annualized return of 9.3% when the count exceeds 56, compared to an 8% return when the total resides below this threshold. 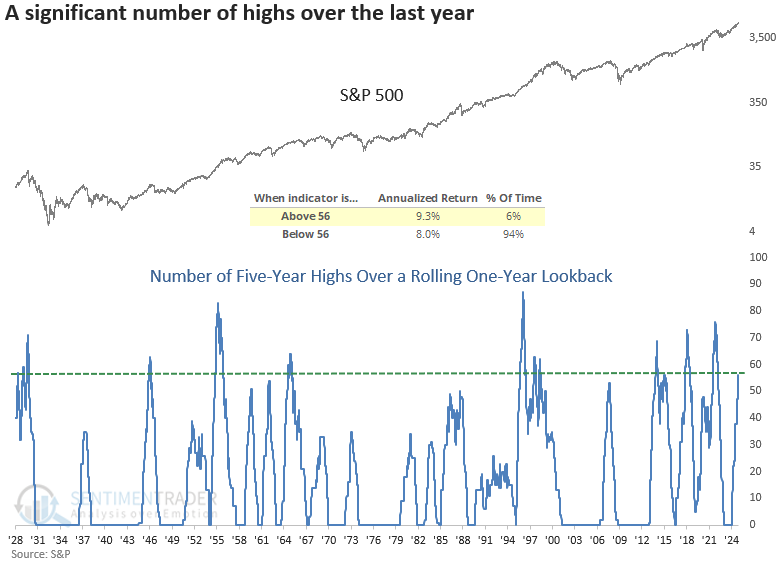
Whenever the S&P 500 reached a 5-year high on 56 occasions within a one-year rolling period, the uptrend in the world's most benchmarked index was likely to persist, with the S&P 500 rallying 100% of the time over the following six months.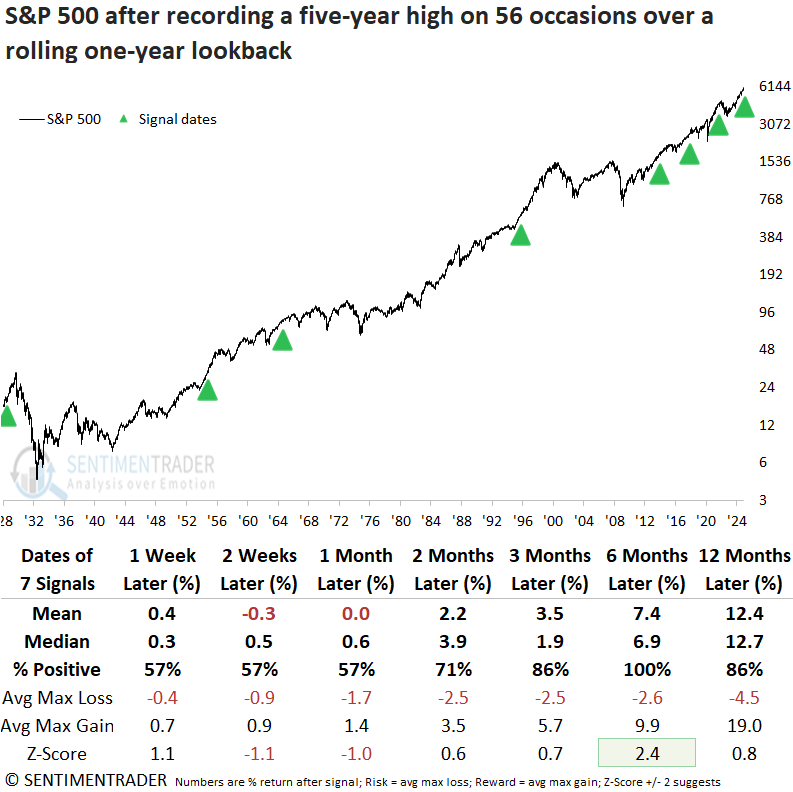
In the following six months, the S&P 500 incurred only one maximum loss of more than 5% and none that surpassed 10%, although 1928 was close.
Following comparable signals, the median number of days until the S&P 500 peaked and embarked on a 5% or greater correction stood at 66 trading sessions or roughly three months. When the two-year rolling return for the S&P 500 exceeded 40%, which is the case now, returns at the three-month interval were generally flat or down in the case of 1928.
Over the long-term, sentiment is still positive
Trends in sentiment can also offer helpful information between the extremes. Jay showed that the new "Sentiment Cycle Composite" may serve as a useful "weight of the evidence" tool for investors.
In the last year, we added four "Sentiment Cycle" measures to our arsenal. The text below from our website lays the groundwork.
- Enthusiasm: High optimism, easy credit, rush of offerings, risky stocks outperforming, stretched valuations.
- Panic: Extreme pessimism, oversold breadth, risky stocks crash, negative media coverage, credit slams shut.
- Discouragement: Stocks go nowhere, trend-followers suffer, there are some pockets of outperformance, credit starts to thaw, and activity slows.
- Returning Confidence: Stocks rise choppily, smaller stocks do well, credit becomes easy, and more new offerings.
Enthusiasm and Returning Confidence tend to rise in a bullish environment and decline in a bearish environment. Panic and Discouragement tend to do just the opposite.
Let's combine these four sentiment cycle values to create one Sentiment Cycle Composite by adding the Enthusiasm and Returning Confidence values and subtracting the Panic and Discouragement ones as shown in the chart below.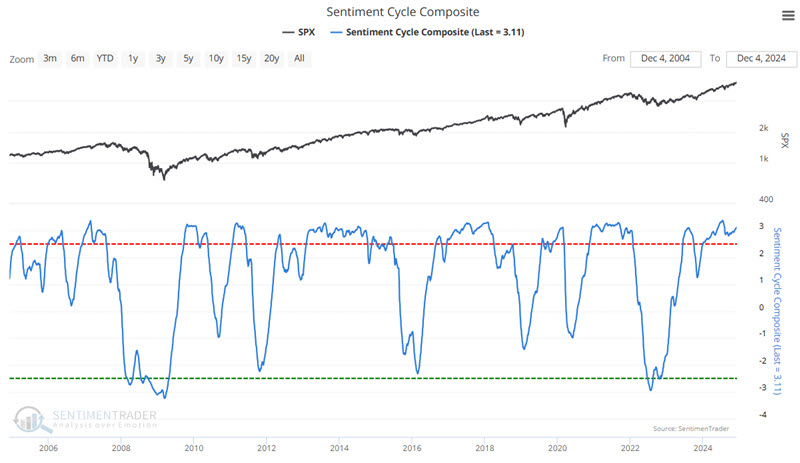
The stock market is much more likely to be in a bull market when the Sentiment Cycle Composite is above -0.6 than when it is below -0.6. The chart below displays the hypothetical growth of $1 invested in the S&P 500 only when the Sentiment Cycle Composite was at or above -0.60. From 1970-01-02 through 2024-11-29, a hypothetical $1 invested in the S&P 500 grew +8,092% to $81.92.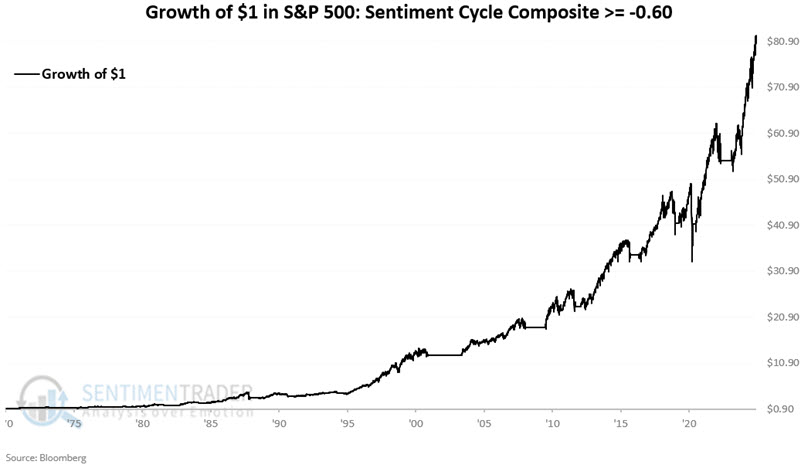
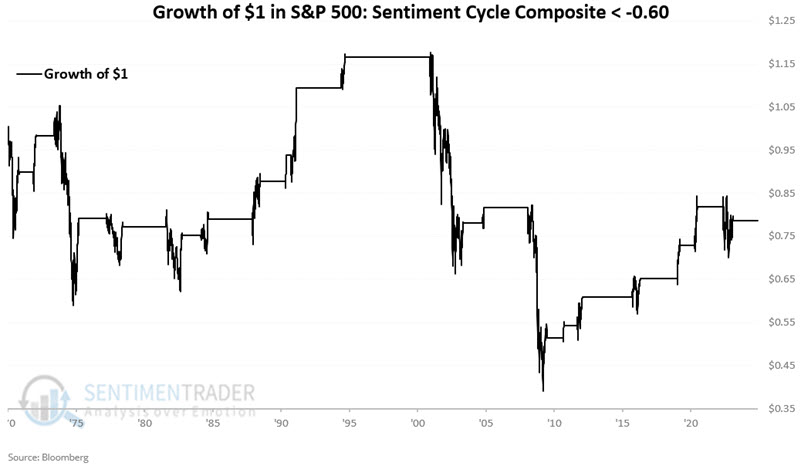
The chart below displays the hypothetical growth of a hypothetical $1 invested in the S&P 500 only when the Sentiment Cycle Composite was below -0.60. From 1970-01-02 through 2024-11-29, $1 invested in the S&P 500 declined -21% to $0.79.
The chart below displays a logarithmic depiction of the growth of $1 using the -0.60 cutoff and $1 in the S&P 500 on a buy-and-hold basis. A visual perusal of the chart above reveals several instances when the drawdown size was not as deep using the -0.60 cutoff level as an exit trigger versus buying-and-holding.
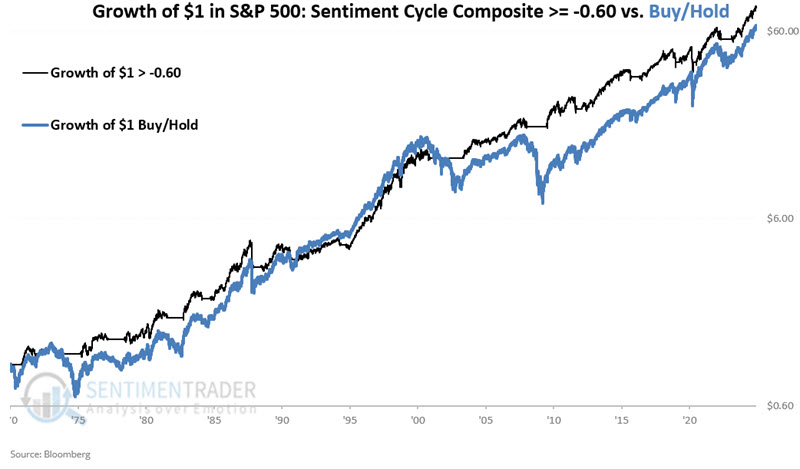 The strategy method experienced a maximum drawdown of -33.9% and the buy-and-hold method experienced a maximum drawdown of -56.8%.
The Sentiment Cycle Composite indicator is comfortably in favorable territory at 3.09, well above the -0.60 cutoff level. This simply tells us that one objective measure of sentiment trend presently remains on the favorable side of the "weight of the evidence" ledger.
Fear is receding
On a shorter time frame, the Volatility Index (VIX) closed below 14 for the first time following an increase above 20. Dean noted that comparable shifts in expected volatility produced excellent returns and consistency for the S&P 500.
The CBOE calculates a volatility index for the S&P 500, commonly known as the VIX or fear gauge. It measures market expectations of near-term volatility (1 month) conveyed by index option prices. The VIX rises when investors are uncertain or fearful about a market's direction. Conversely, when apprehension subsides, volatility reverts lower.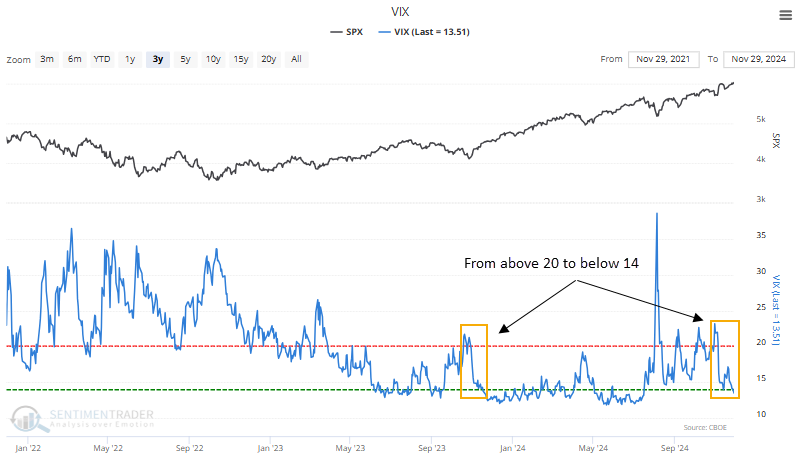
Whenever the Volatility Index (VIX) cycled from above 20 to below 14, the S&P 500 displayed excellent returns and consistency over medium and long-term horizons. That was especially the case a year later, as the world's most benchmarked index rose in all but one instance and exhibited significance compared to random returns over the study period.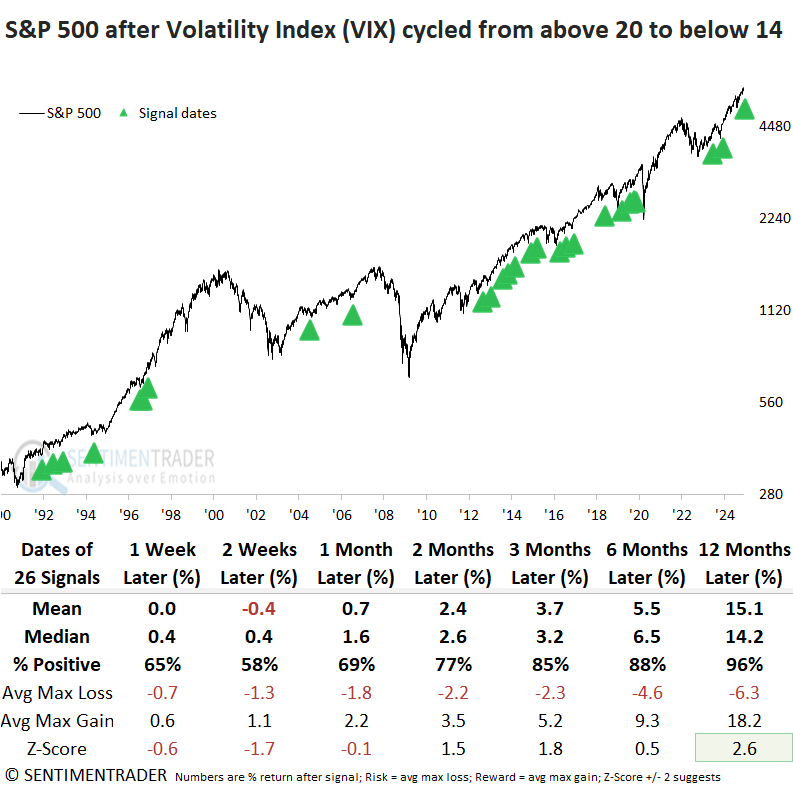
Dean also noted that the last-hour indicator tracks the cumulative direction of the final hour of trading for the S&P 500, revealing whether buying or selling pressure dominates this pivotal trading window.
In nine of the last ten sessions, the last-hour indicator has posted gains. Whenever the last-hour indicator climbed in nine out of ten sessions, and the S&P 500 hovered within 2% of its all-time high, the world's most benchmarked index advanced 90% of the time over the following six months.
Also, following the 2024 election results, stocks exploded higher, triggering a thrust signal when more than 18% of common stocks registered a daily gain of 4% or more. This scenario also generated an alert in 2016, providing traders with a similar analog suggesting equity markets could move higher in the year ahead.
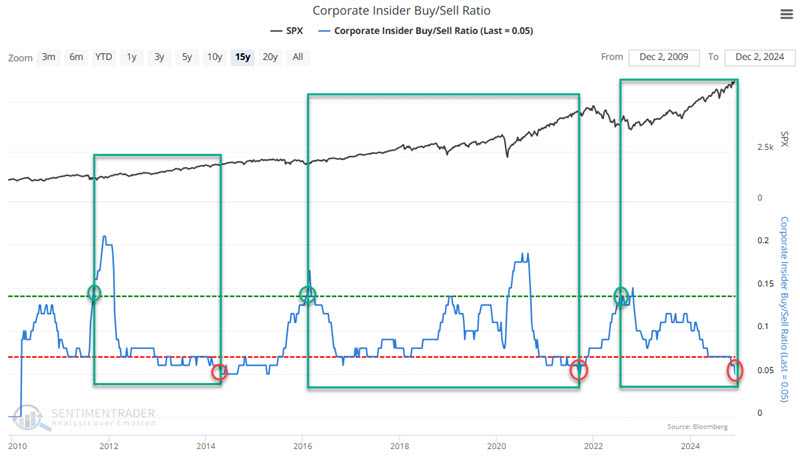
Insiders, though, aren't biting
Jay showed that at the end of last week, a corporate insider model moved from favorable to neutral.
The rules:
- If the Corporate Insider Buy/Sell Ratio is reading 0.14 or higher, the model status is considered "favorable" for stocks
- Once the model reaches "favorable" status, it maintains a "favorable" rating until the Corporate Insider Buy/Sell Ratio touches a reading of 0.05, OR 156 weeks since the last 0.14 or higher reading goes by
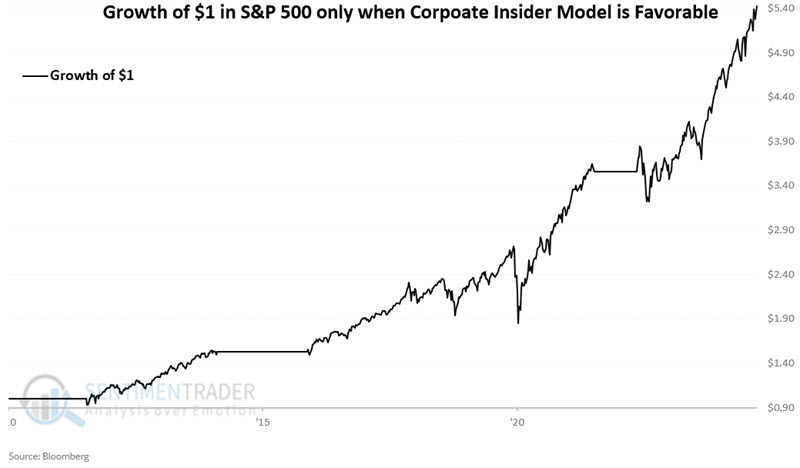
On Monday, 2024-12-02, the model fell to 0.05, so the model will switch from "Favorable" to "Neutral." The chart and table below highlight the favorable periods and S&P 500 results.
 The chart below displays the hypothetical growth of $1 invested in the S&P 500 only when the model detailed above is "favorable."
The chart below displays the hypothetical growth of $1 invested in the S&P 500 only when the model detailed above is "neutral."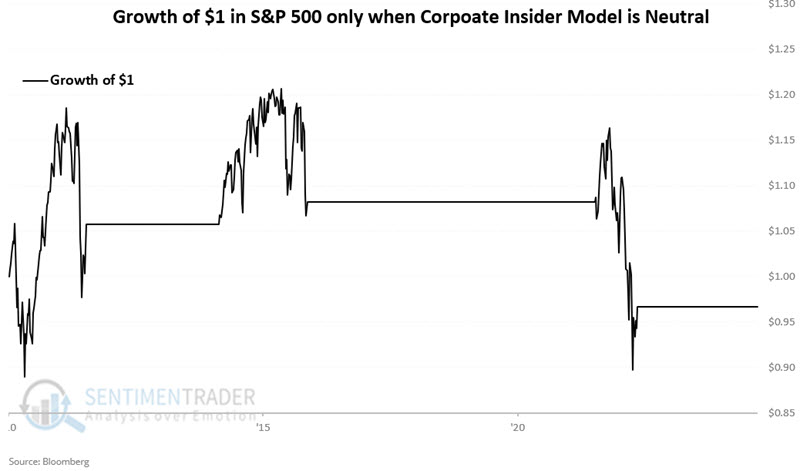
The "new transports" are struggling
Market watchers have long asserted that the semiconductor industry is the new transports, as the backbone of U.S. commerce. That seems to be a problem now, because while the S&P 500 has been hitting record highs, semis have not.
When we look at the relative trend for the VanEck Semiconductor ETF (SMH), we can quickly see the problem: its Relative Trend Score has cycled from 10 (all of the trend metrics for the SMH/S&P 500 ratio are positive) to 0 (none of them are). The last couple of times this happened, it was not good for semis or the broader market.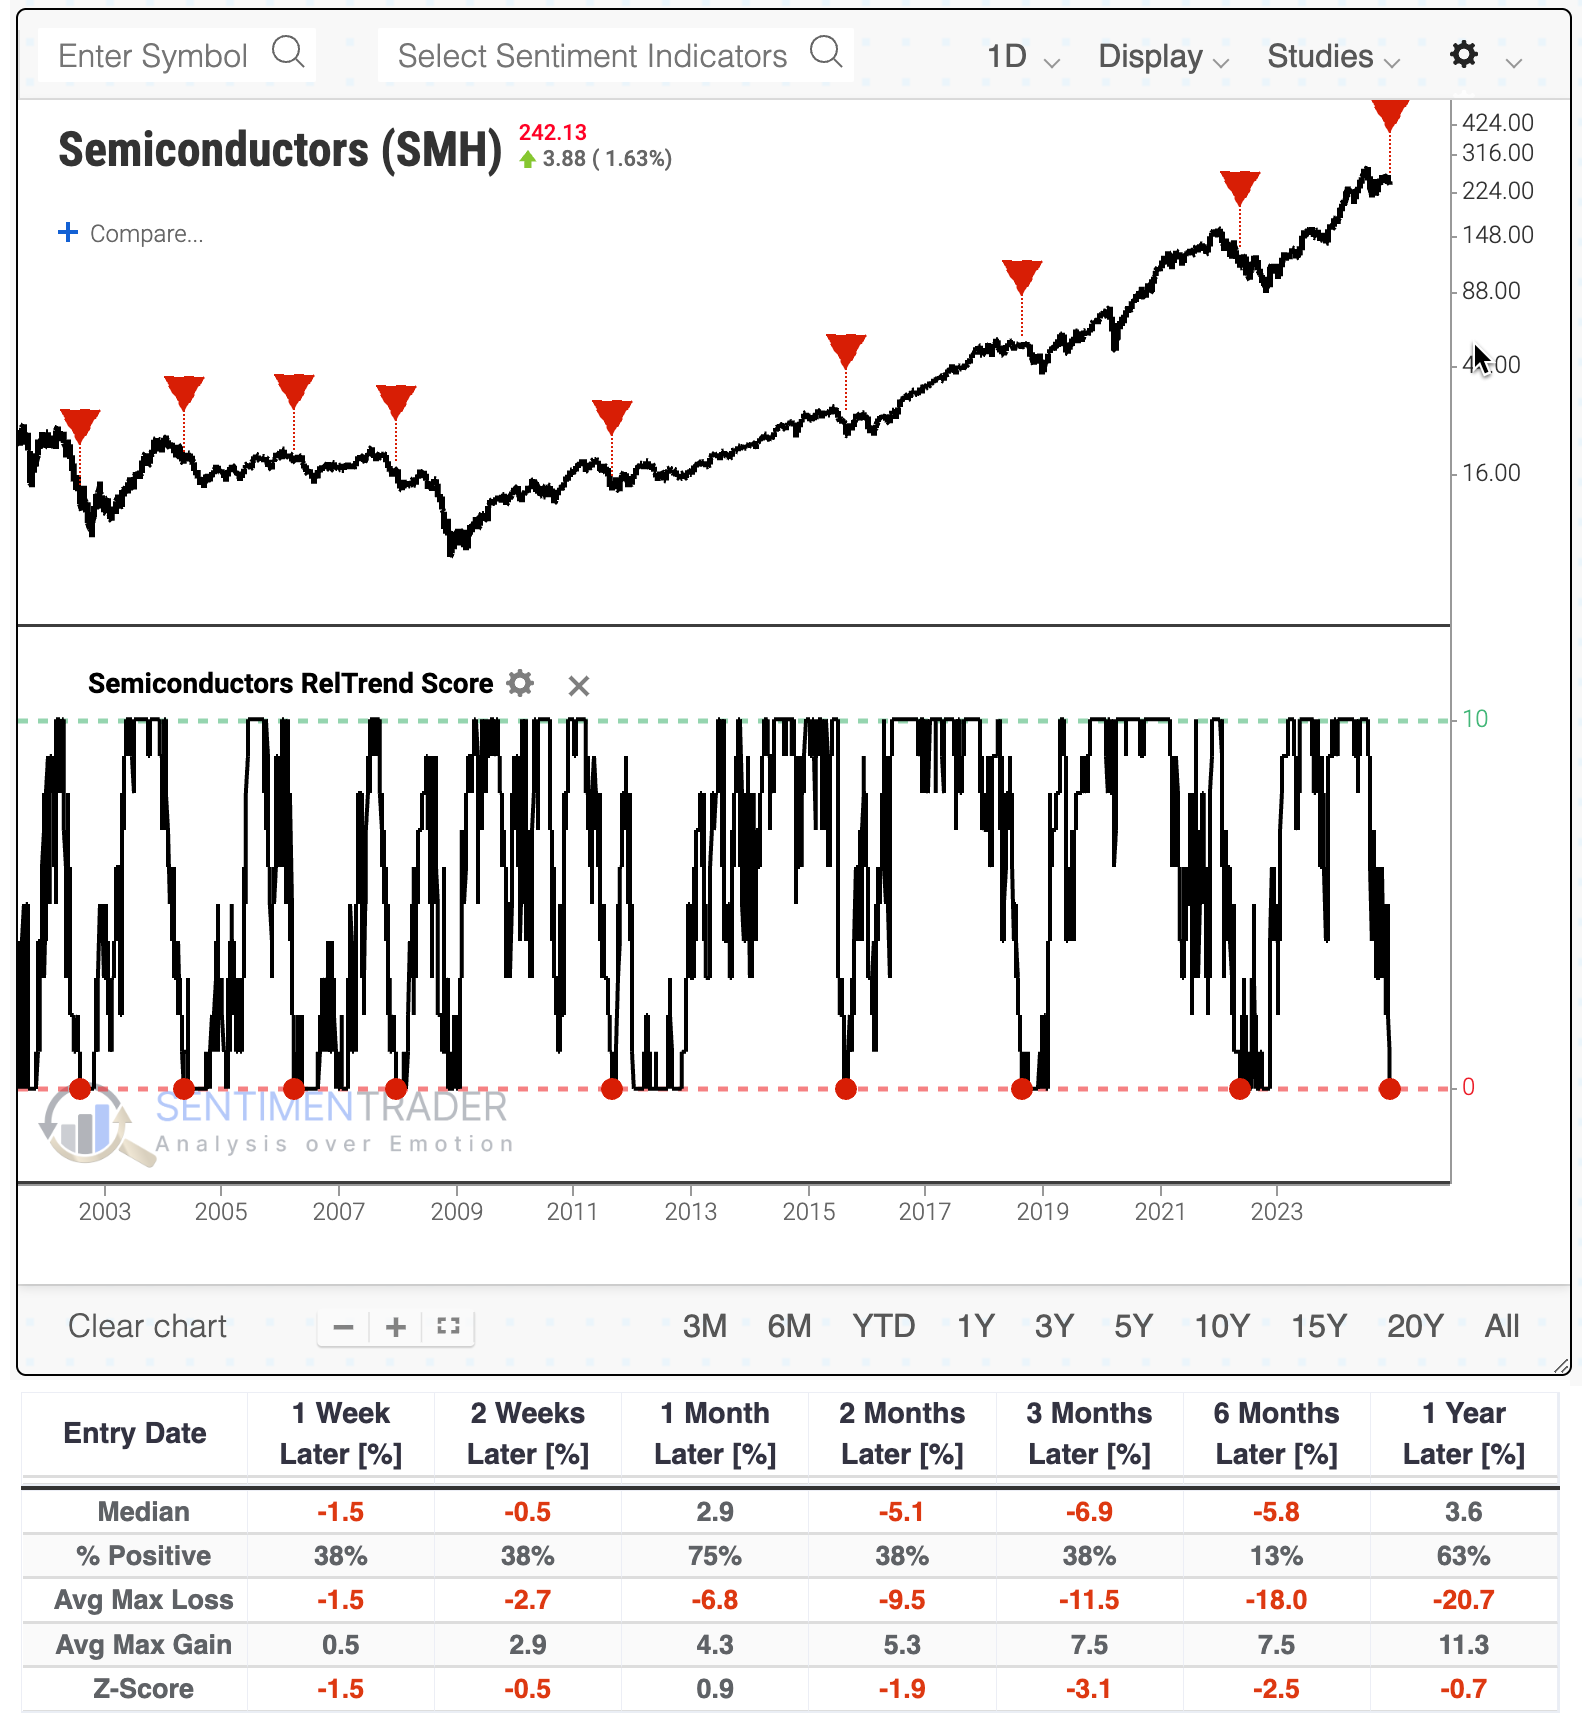
The table of maximum gains and losses across time frames shows that SMH suffered at least a -5% pullback within the next three months every time (not including the last signal, which was just triggered). And it suffered at least a -10% correction within that time frame all but one time.
These signals in SMH tended to be negative for the S&P 500. Two months later, the S&P averaged a return of -2.9% and was positive 25% of the time. There was a lot of red across sectors over the medium term.
Semiconductor ETFs don't have much history, so we can use the S&P 1500 semiconductor industry to get as long a history as possible. Below, we can see every time the S&P 500 reached a record high. At the same time, semis had been at a new high within the past 30 sessions but were now down at least -8% from that high. This proved to be a problem a handful of times, though the lead time varied greatly.
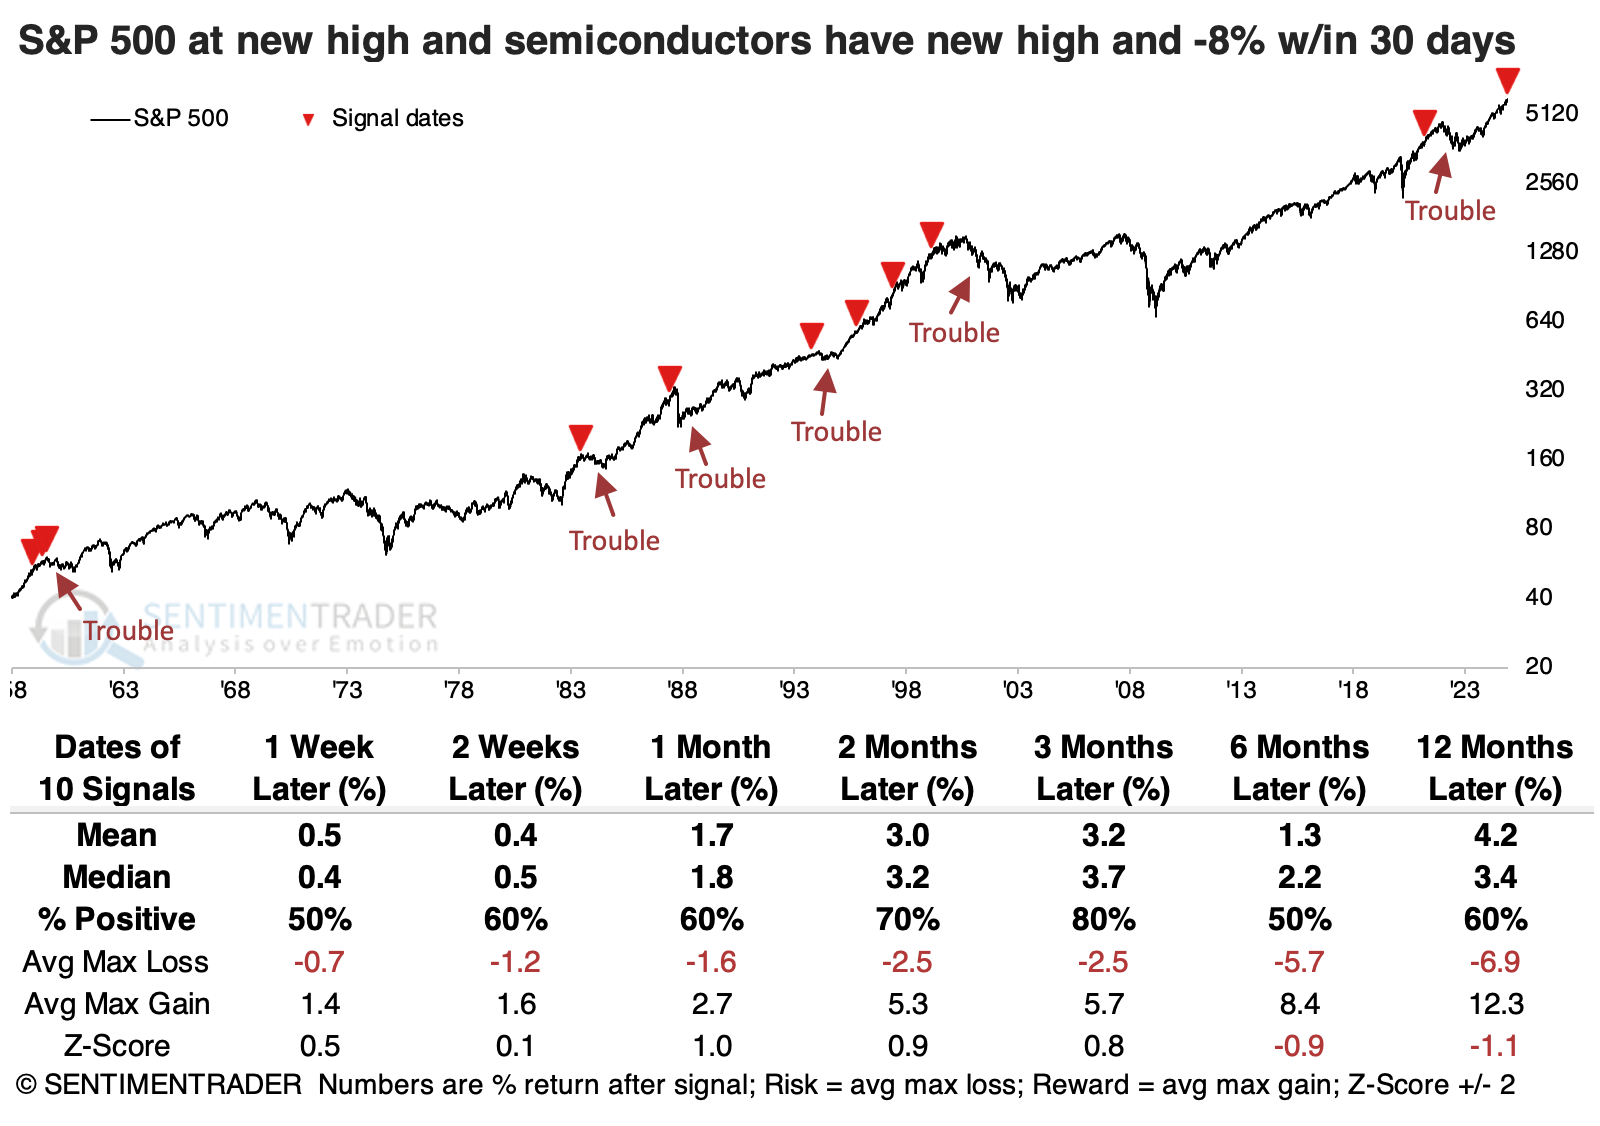
For semis, these signals proved to be a wild ride. Returns were all over the place, with no consistent theme across any time frame. Over the next two months, there were more losses than gains but also a few double-digit gains.
Healthcare is lagging, too
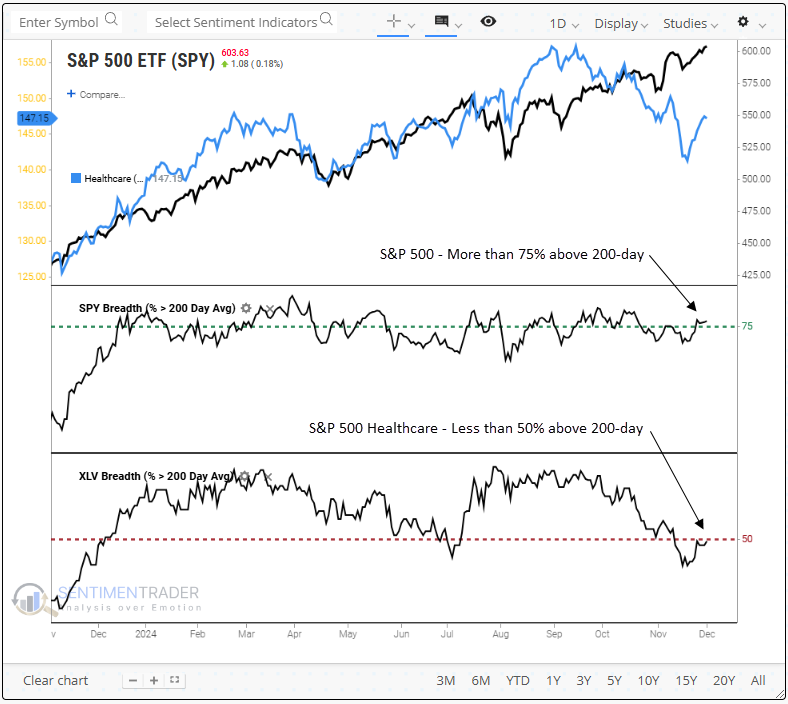
Long-term trend conditions for healthcare stocks have weakened, deviating from the broad market. Dean showed that similar divergences suggest the healthcare sector could struggle over the subsequent year.
For only the ninth time in more than 70 years, the percentage of S&P 500 healthcare stocks trading above their 200-day moving average dropped below 50% as the S&P 500 maintains over 75% of its members above their respective 200-day average. This rare divergence last occurred during the Dotcom bubble in 1999; before that, it emerged in 1993, when potential healthcare reform led to a devastating bear market in healthcare stocks.
Precedents when less than 50% of S&P 500 healthcare stocks closed above their 200-day average, despite over 75% of S&P 500 members residing above their respective long-term average, have typically resulted in flat to slightly negative returns for the S&P 500 healthcare sector over the subsequent year. Moreover, the associated risks surpassed the potential rewards during these periods.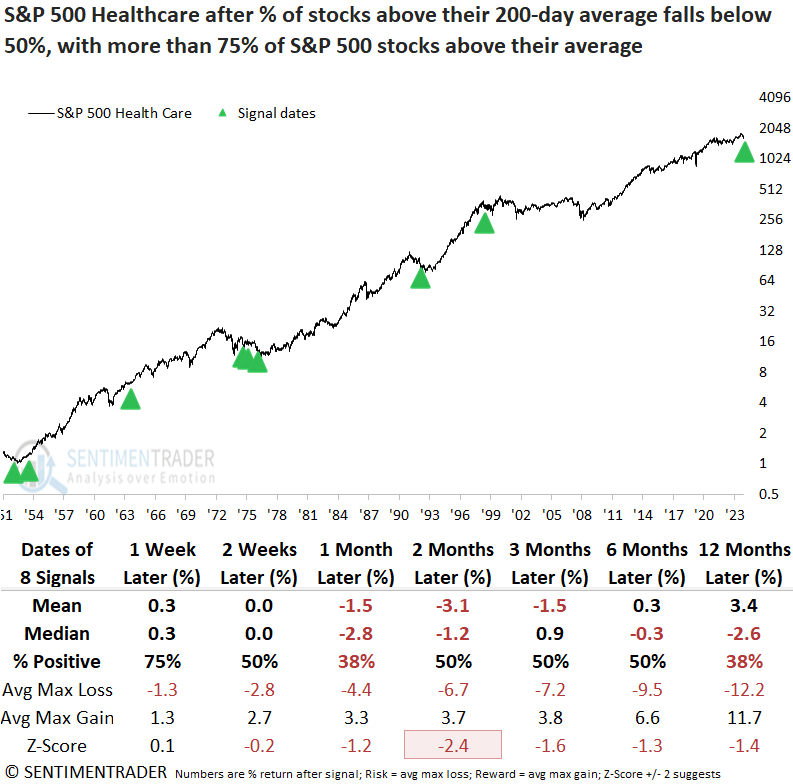
Over the subsequent year, six out of eight precedents experienced a maximum loss surpassing 10%, and in each case, the loss exceeded the gain. Twelve months later, the S&P 500 Healthcare sector ranked as the worst-performing sector.
The relative ratio of the S&P 500 Healthcare sector to the S&P 500 recently hit its lowest level since July 2008. Although it saw an accelerated decline post-election, the question arises whether a systemic issue is plaguing the sector, given that the ratio peaked in 2015.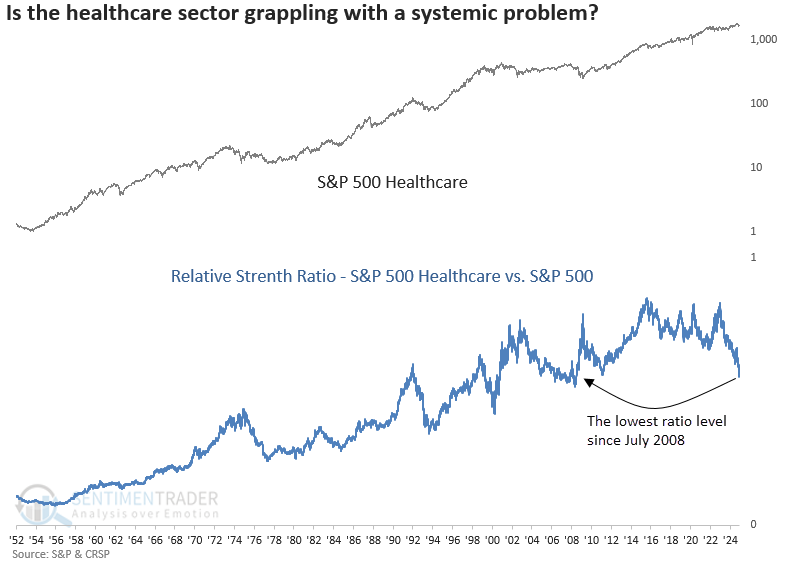
Since the S&P 500 healthcare sector's relative ratio peaked in 2015, it has now gone 2,348 trading sessions without reclaiming that level, the second-longest stretch ever recorded.
Silver system
After a nice run into October, silver has pulled back roughly 27%. Jay showed that several long-term cycles suggest the potential for a breakthrough in 2025.
The cycles:
- Six favorable months of the year for silver: Six months are deemed favorable, and the rest unfavorable
- The 8-year cycle: The first four years of each cycle are deemed favorable, the second four years unfavorable
- The 30-year cycle for commodities: The first 15 years of the cycle are considered favorable for commodities in general
The model reading is arrived at by adding the values for the three variables.
- November, December of 2024, January, and February 2025 are all deemed favorable. Variable A = +4 (and will remain +4 through the end of February 2025).
- Eight-Year Cycle: A new favorable four-year cycle will begin on 2025-01-01. So, until then, Variable B = 0. From 2025-01-01 through 2028-12-31 Variable B = +2.
- 30-year cycle for commodities: This cycle turned favorable on 2023-06-30 and will remain favorable until 2038-06-30, so Variable C = +1.
When we add up the variable values, we find that for Dec 2024 the JK Seasonal Silver Model = +5. For Jan-Feb 2025, it will = +7.
The table below replaces any Model reading of +5 or higher with the word "Silver." All other months display the word "Cash." According to the Model, traders looking to play the short side of silver should stick to doing so during the months labeled "Cash."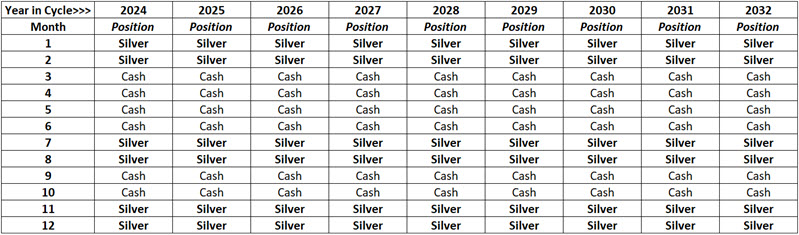
The chart below displays JK Silver Model readings from 1953 through 2040.
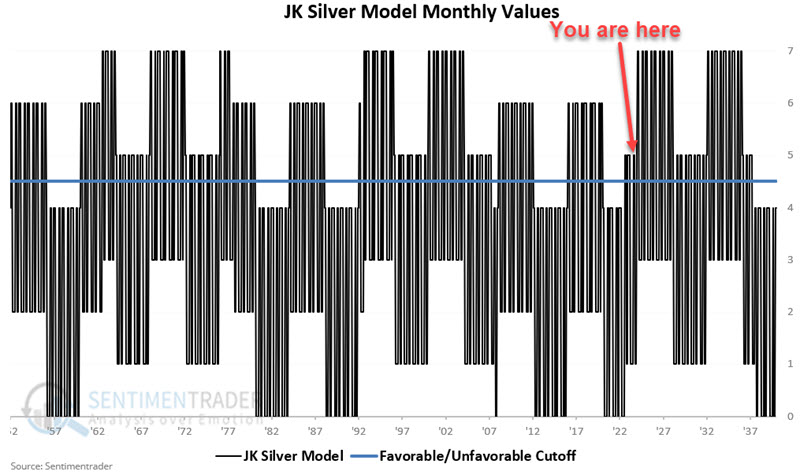
While historical back-tested results are pretty favorable for silver, the model is not necessarily intended to be used mechanically. Traders might also consider trend-confirming indicators before taking a bullish position on silver.
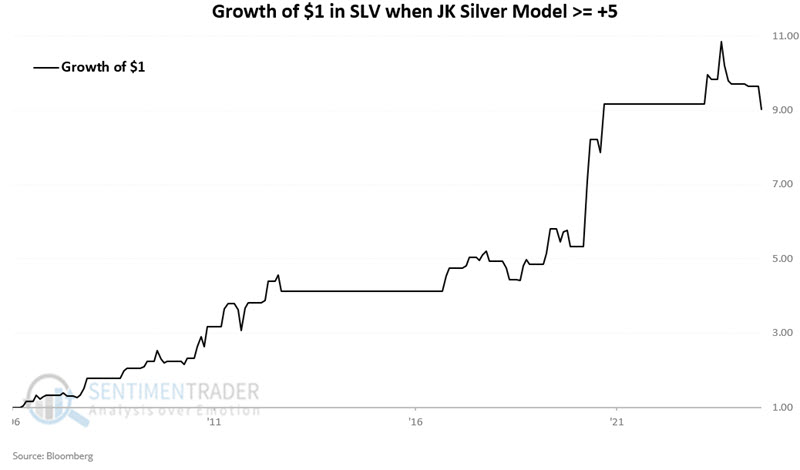
The chart below displays the hypothetical growth of $1 in ticker SLV only during months when our model was at +5 or higher since SLV started trading in 2006.
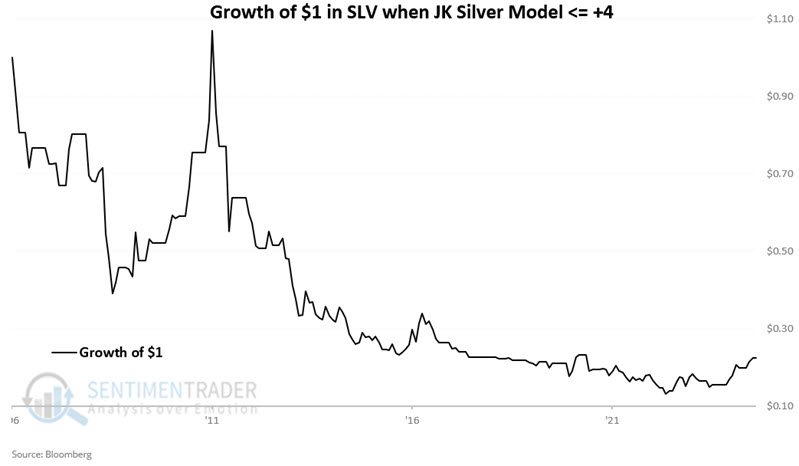
 The chart below displays the growth of $1 in ticker SLV only during months when our model was at +4 or lower since SLV started trading in 2006.
A brief window for corn
A short timeframe during December has tended to see higher prices for corn futures. This period has seen corn gain in price 89% of the time since 1960.
Let's focus on the following short-term window for corn, which extends from Trading Day of the Year (TDY) TDY #236 through TDY #250-highlighted below. For 2023, this period runs from the close on December 6 through the close on December 27.
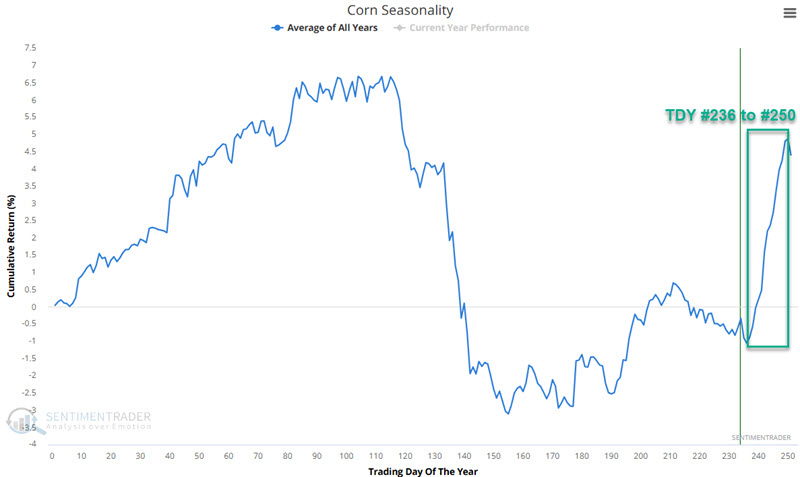
For this test, we will examine the performance of corn futures between Trading Day of the Year (TDY) #236 and TDY #250. The chart below displays the cumulative dollar return achieved by holding a long 1-lot position in corn futures only during this period every year starting in 1960.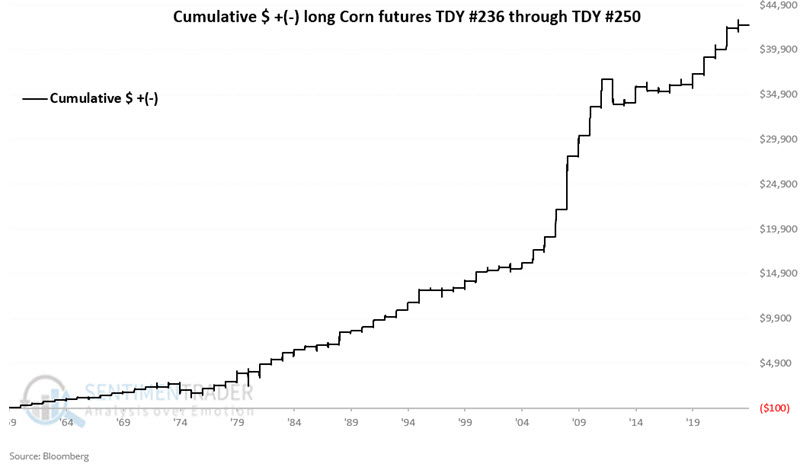
Over the past 64 years, corn futures gained 57 times during this roughly 3-week period. The lopsided nature of gains versus losses over $1,000 (14-to-1) suggests a true edge. However, the sheer size of 2012's loss of-$2,813 reminds us of the need for risk management in every trade, regardless of any perceived edge.
The Teucrium Corn Fund ETF (ticker CORN) may be an alternative for non-futures traders to play the corn market. Ticker CORN can be traded like shares of stock and is designed to expose traders to fluctuations in the price of corn.
About TradingEdge Weekly...
The goal of TradingEdge Weekly is to summarize some of the research published to SentimenTrader over the past week. Sometimes there is a lot to digest, and this summary highlights the highest conviction or most compelling ideas we discussed. This is NOT the published research; rather, it pulls out some of the most relevant parts. It includes links to the published research for convenience, and if you don't subscribe to those products, it will present the options for access.