
TradingEdge Weekly for Dec 27 - Heavy selling, a less-healthy environment, rapid recent recoveries

Key points:
- Selling pressure has triggered oversold conditions in many stocks
- Signs of a less healthy market environment are emerging
- Some other signs of poor participation, but a quick recent reversal
- Financial conditions are tightening
- Leading Indicators ticked higher after 8 months of declines
- Healthcare stocks are showing signs of a washout
Buying the dip?
There are some signs of churning in the market. Still, "Buy the Dip" remains an operative phrase for traders as long as the overall trend remains favorable, and Jay showed an oversold indicator that's flashing green.
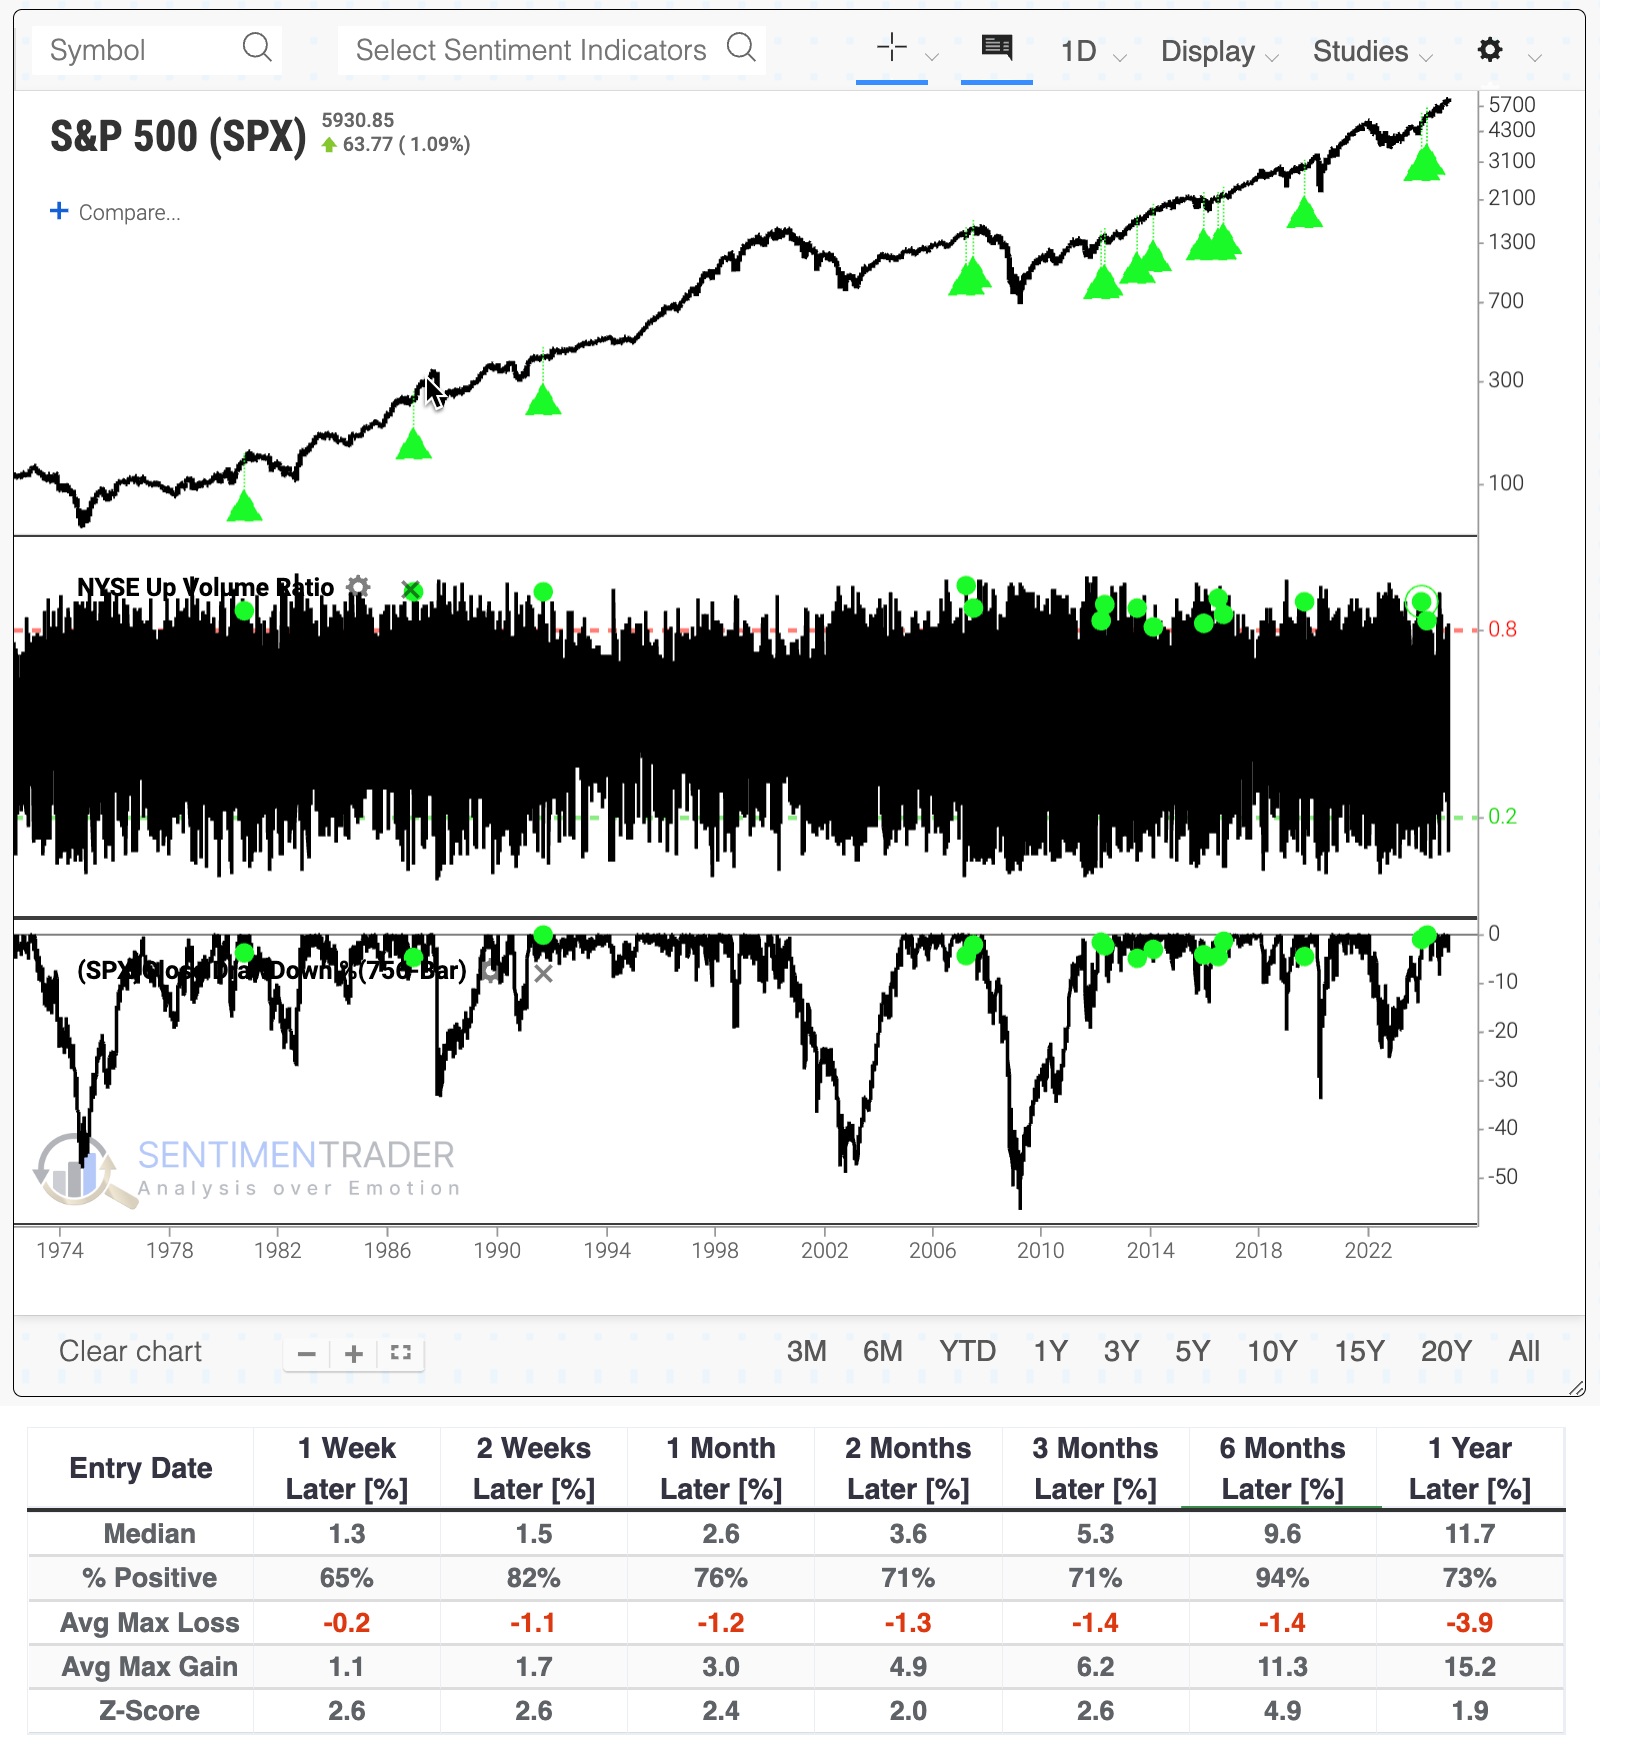
The % S&P 1500 RSI 2-day < 30 indicator is calculated by determining the 2-day RSI values for each of the S&P 1500 symbols and then determining the percentage of those that are at extreme values. When the vast majority of stocks (75% or more) are "oversold" (2-day RSI below 30%) while the overall market was still in an established uptrend (i.e., SPY > 150-day moving average), the majority of signals highlight a buying opportunity within a bull market.
The chart below highlights with a red dot all of those relatively rare days when 95% or more of S&P 1500 stocks have a 2-day RSI below 30% or more on the same day. The most recent signals occurred on 2024-12-18 and again on 2024-12-24.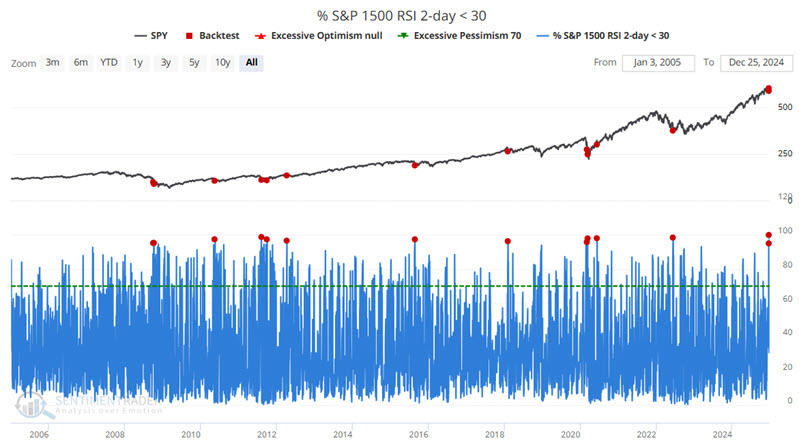
The signals highlighted above suggest a reasonable probability that the stock market will work its way higher over the year ahead and that the recent decline marks a decent buying opportunity. They primarily remind longer-term investors to stay the course as long as the overall trend remains positive and for shorter-term traders to continue to take advantage of short-term opportunities.
A less-healthy environment
For most of the past two years, most, if not all, signs of a healthy market have been present. Those signs are starting to fall off due to the type of selling pressure noted above.
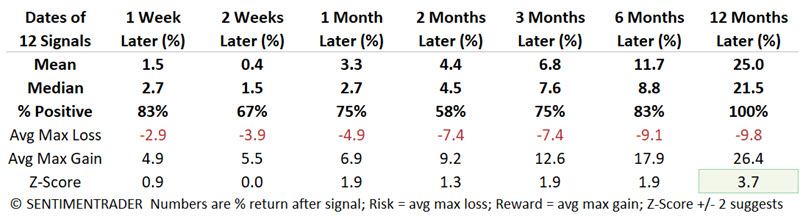
A couple of the primary ones we watch are the net percentage of securities traded on the NYSE that hit 52-week highs minus 52-week lows and the NYSE McClellan Summation Index, a long-term view of internal momentum. For the first time since last fall, both are in unhealthy territory below zero.
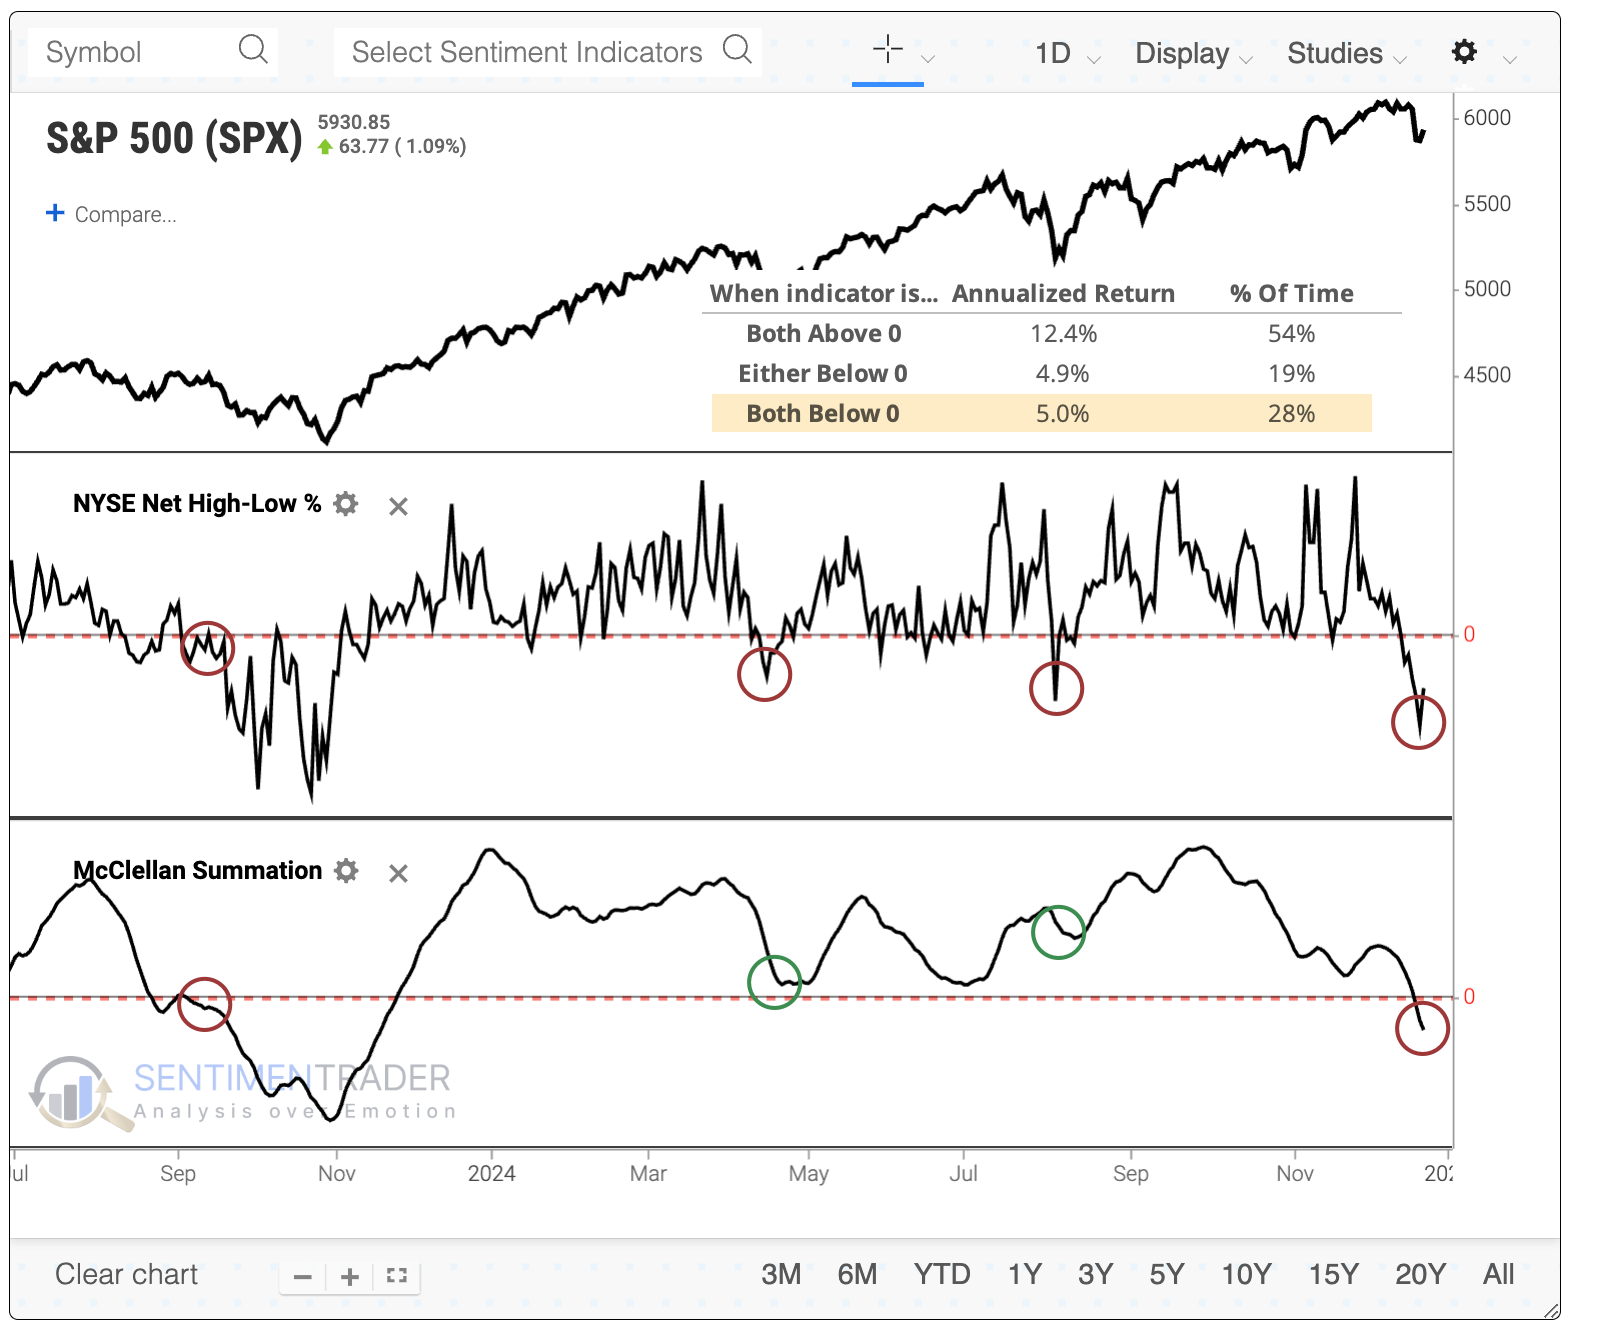
This ended the fourth-longest streak since both indicators had been in negative territory since 1962. Even though most of the past 40 years have been dominated by bull markets, forward returns after the ends of similar streaks were relatively poor. The S&P 500's upside was limited in the months ahead since the 2008 global financial crisis.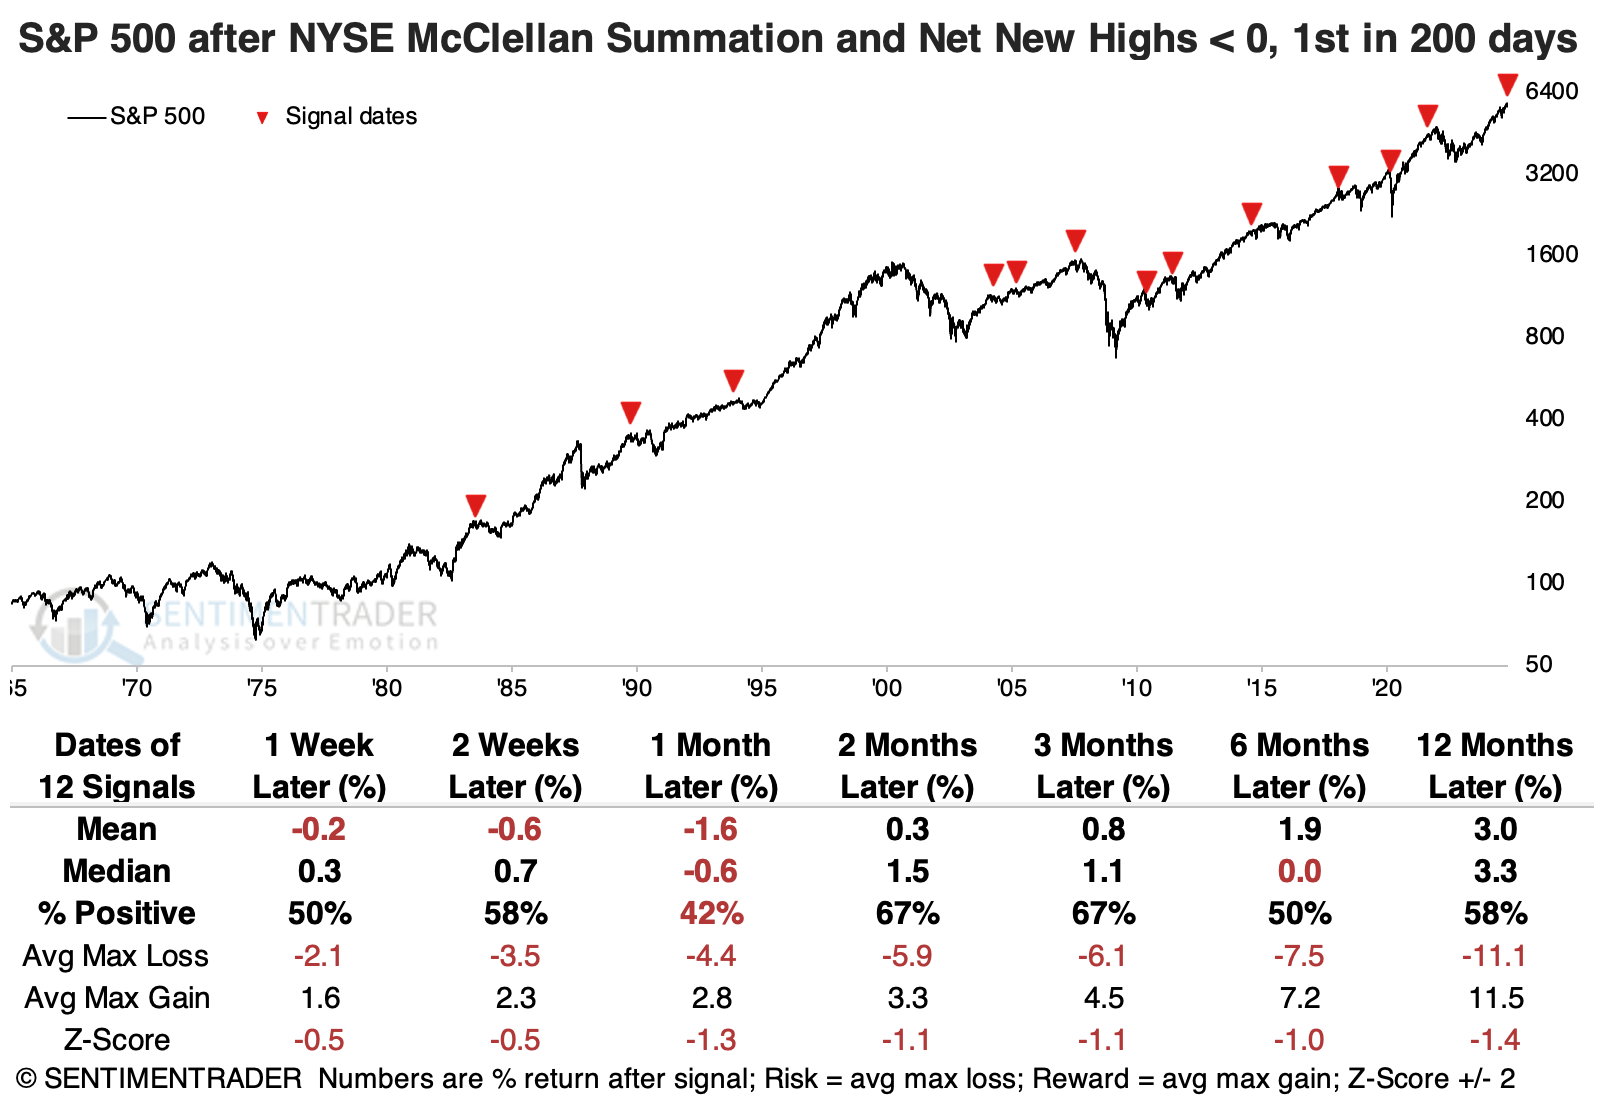 The Dow Industrials fared the best out of other major equities indices, while the small-cap Russell 2000 sported the worst returns and consistency across most time frames.
We're navigating a quickly moving tape, causing whiplash with some short-term measures. The same poor breadth dragging down the indicators noted above made a marked turn last Friday.
The chart and table below show the S&P 500's returns after Up Volume made a dramatic about-face within only a few sessions, and the S&P was within 5% of a multi-year high. The S&P tended to hold up well after these breath whiplashes.
 One of the problematic aspects of last week is just how much damage had already been done under the surface, with many indicators already at levels that have coincided with oversold levels, particularly during ongoing bull markets. And the quick shift on Friday supports the idea that we're on the cusp of relieving some of those. This is challenging for all sides and suggests that while going all-in may not be the most prudent action, neither would be being all-out.
More of the same
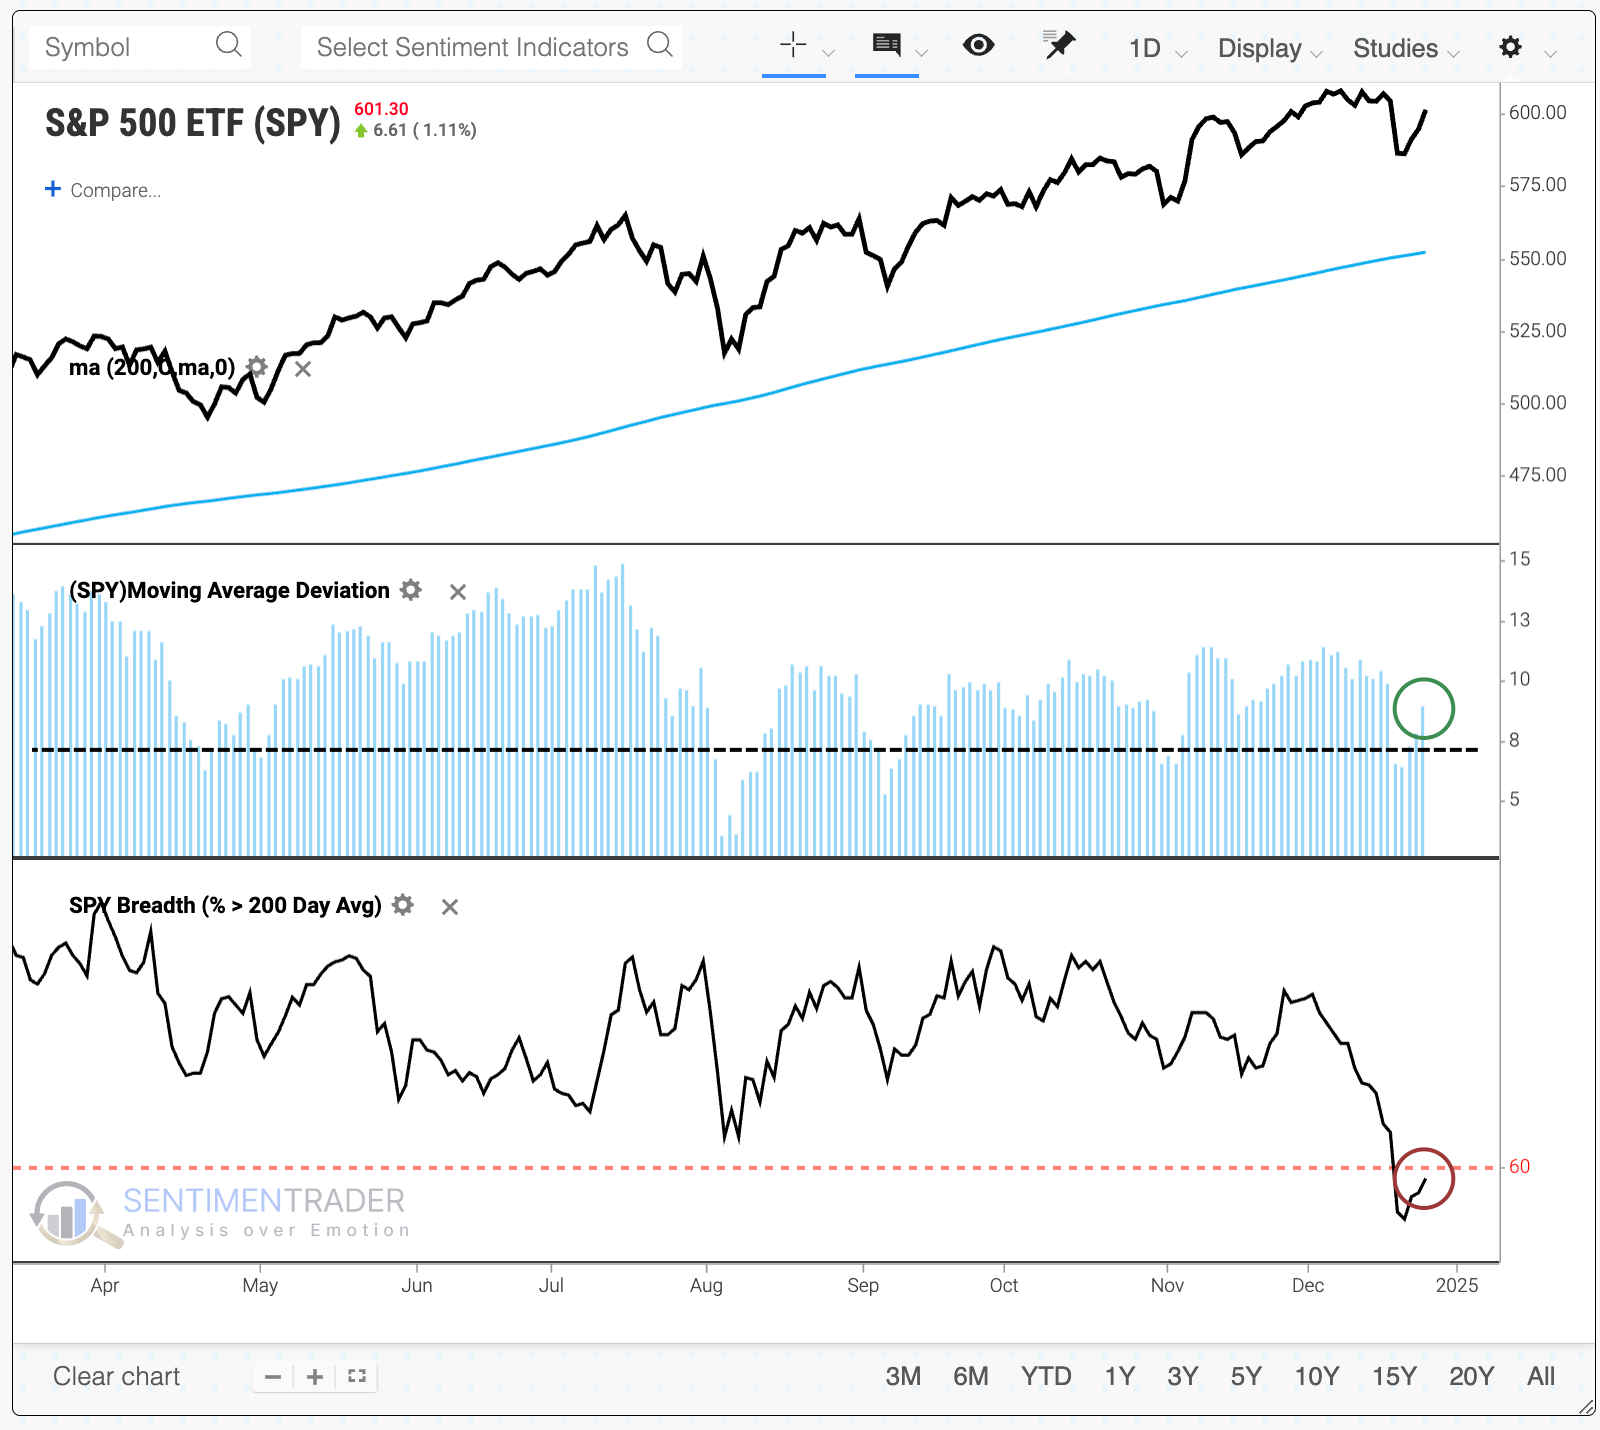
Poor participation under the surface of the S&P 500 and other indices has caused some long-term measures of market breadth to deteriorate to an unhealthy condition. That is evident in many measures, a primary one being the percentage of stocks holding above their 200-day moving averages.
Curiously, the S&P 500 index has been levitating more than 7% above its average, while fewer than 58% of its member stocks are holding above their 200-day averages by any amount.
It's rare to see such disparate performance between the index and its constituents. These conditions persisted near the peaks of several bull markets. However, the six-month returns were positive every time but once, and the last two signals preceded massive gains for stocks.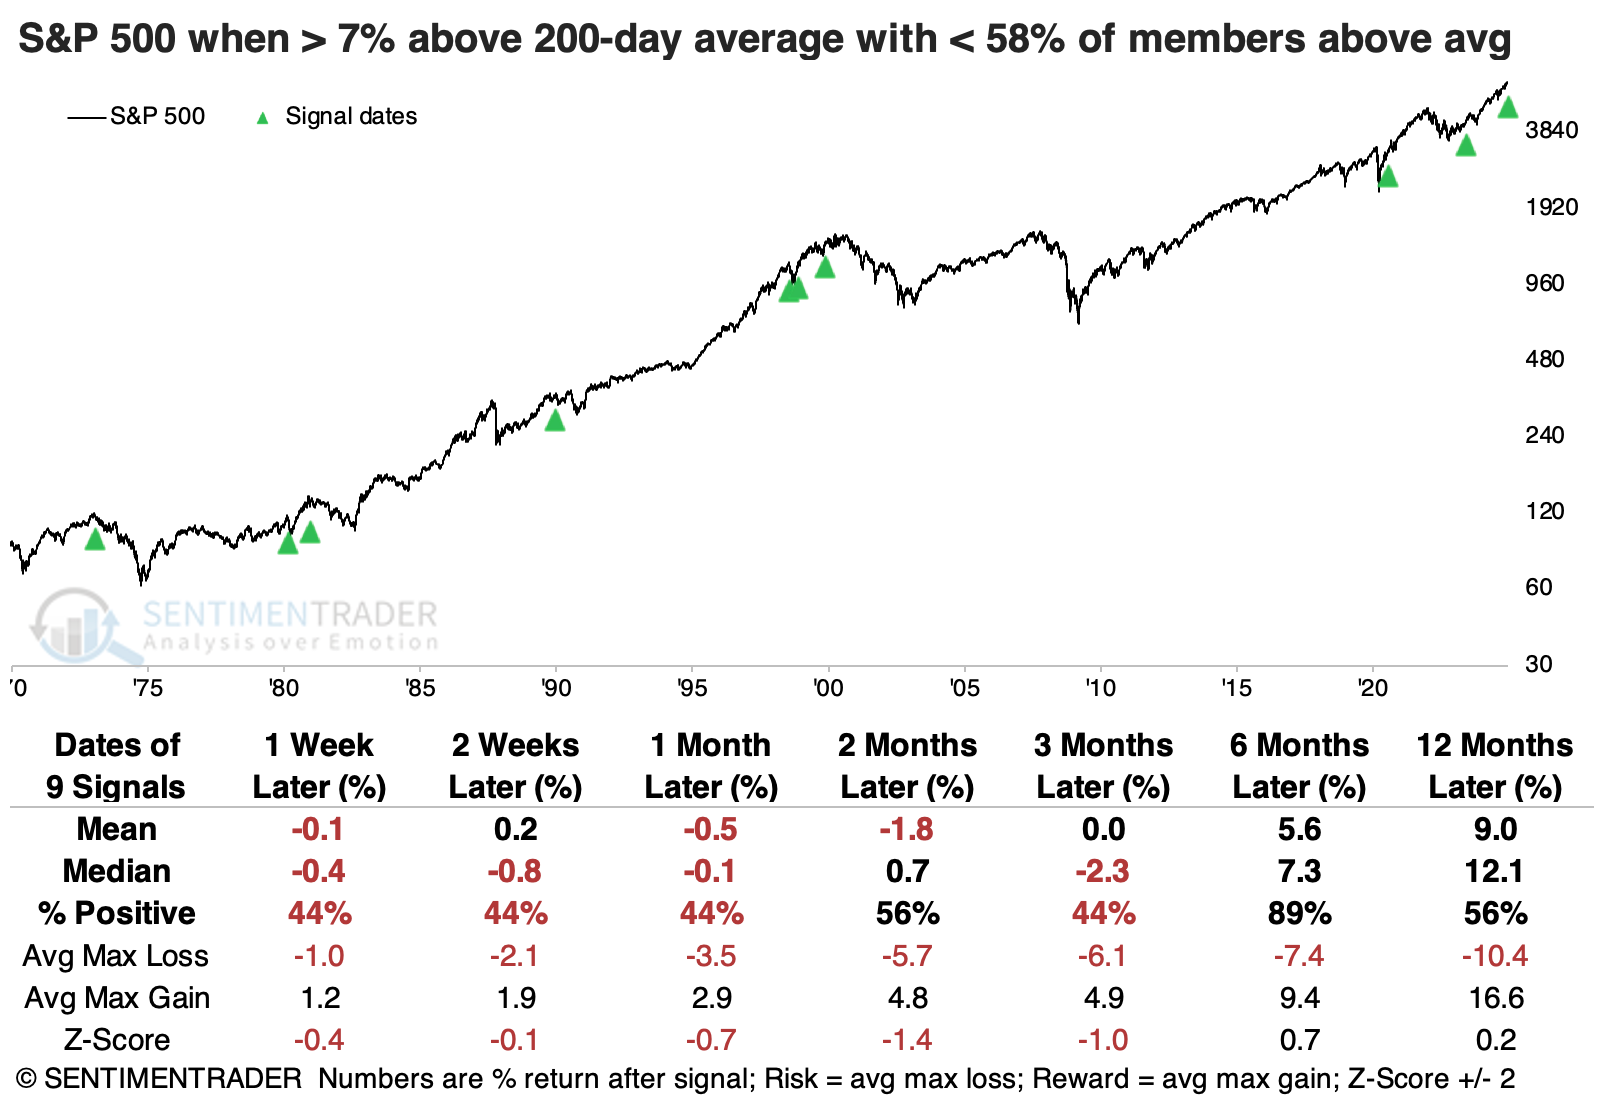
If we loosen thresholds, it adds a couple more bull market peaks (2007, 2021) and several more innocuous signals. The S&P's overall reaction tended toward the positive side, with above-average returns across time frames.
One factor adding to the potentially positive side of the ledger is the swift and overwhelming reaction to last Wednesday's bad day. While fewer than 10% of S&P 500 stocks rose that day, we've now had two days in quick succession with (nearly) 90% of members rising.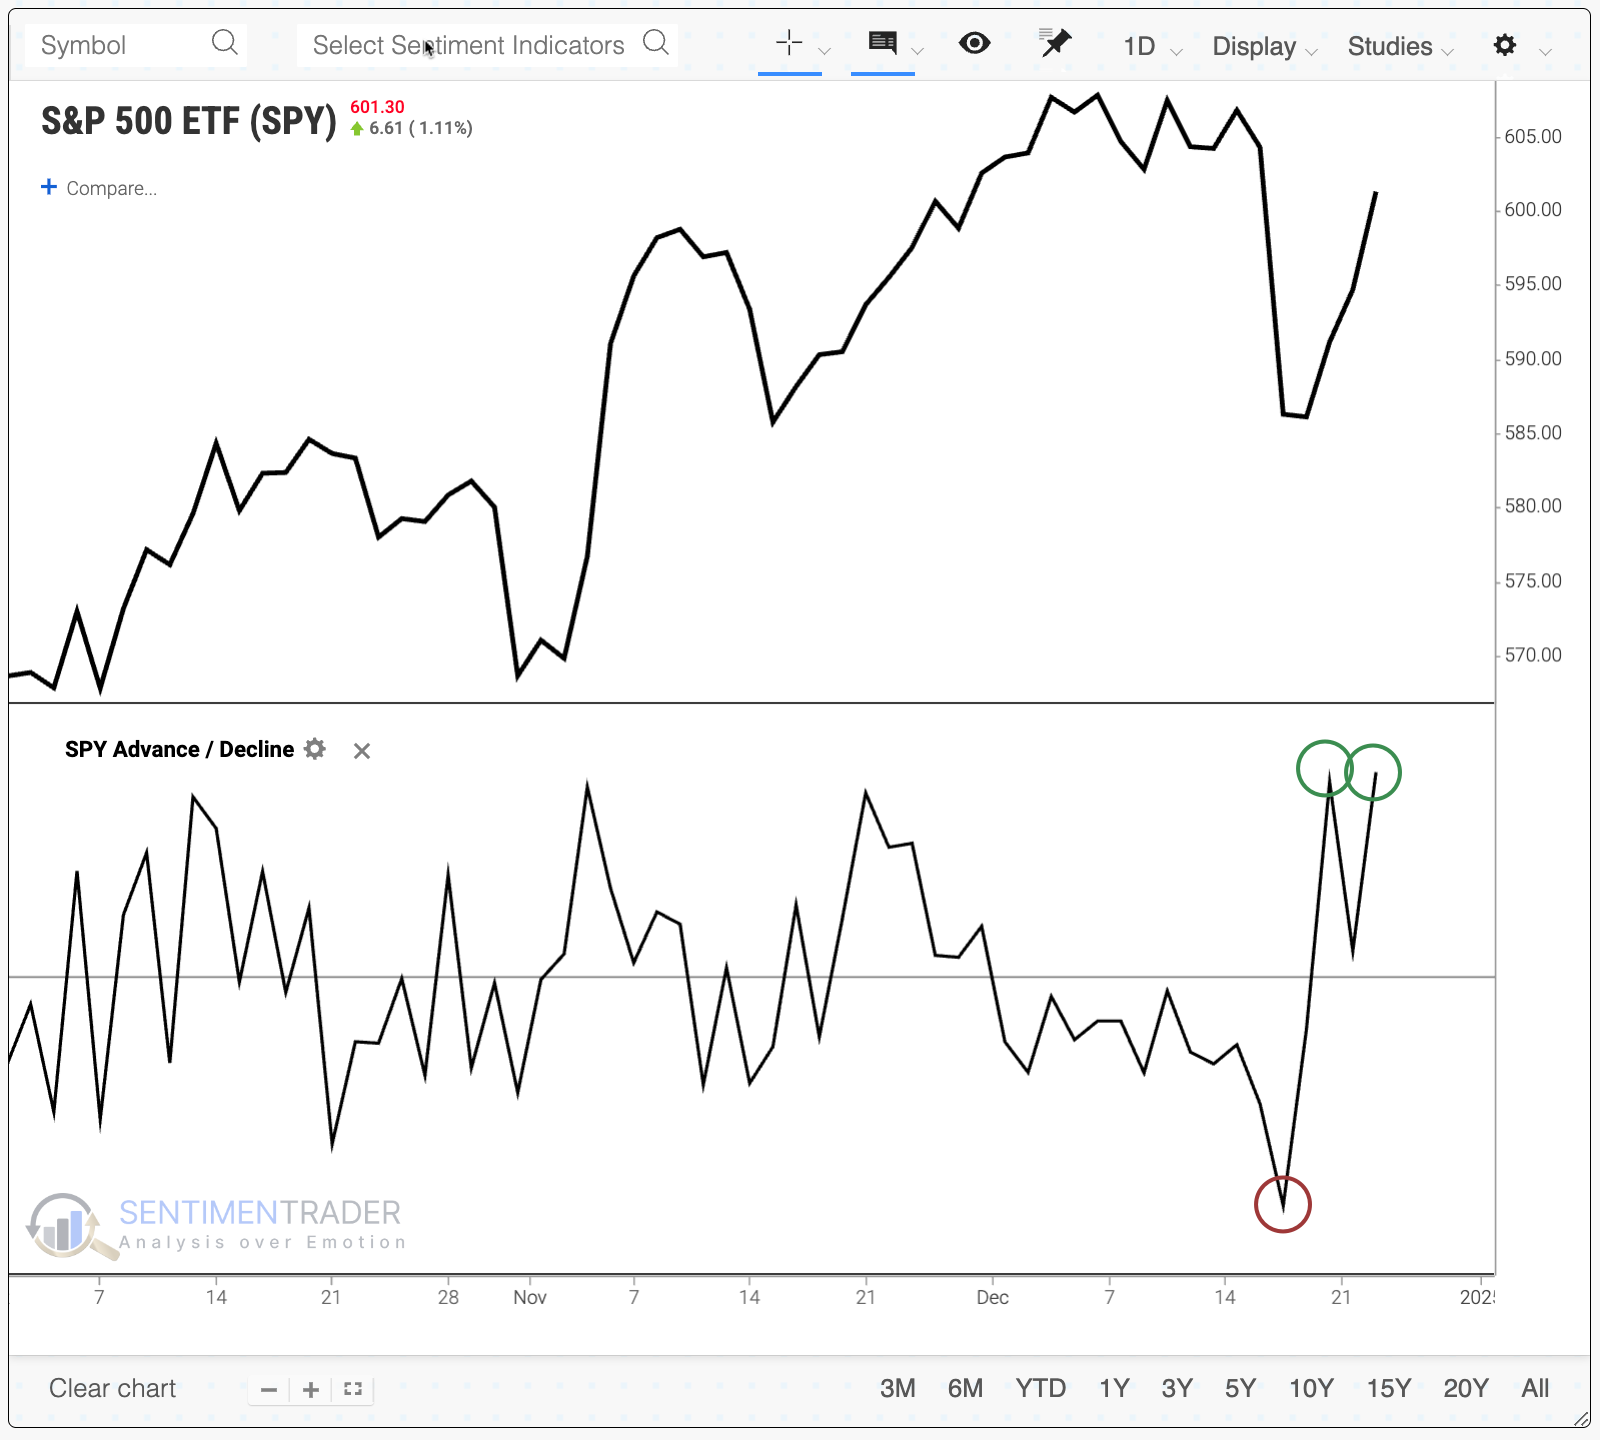
We see this more often near the ends of declines, not beginnings.
The table below shows every similar occurrence over the past 90 years. Incredibly, it had never happened before 2003, but that can probably be explained away by the decimalization in 2001. The S&P struggled in the weeks following several of these signals, and it did trigger ahead of a few significant declines. Still, overall, it was a positive sign, especially on longer time frames.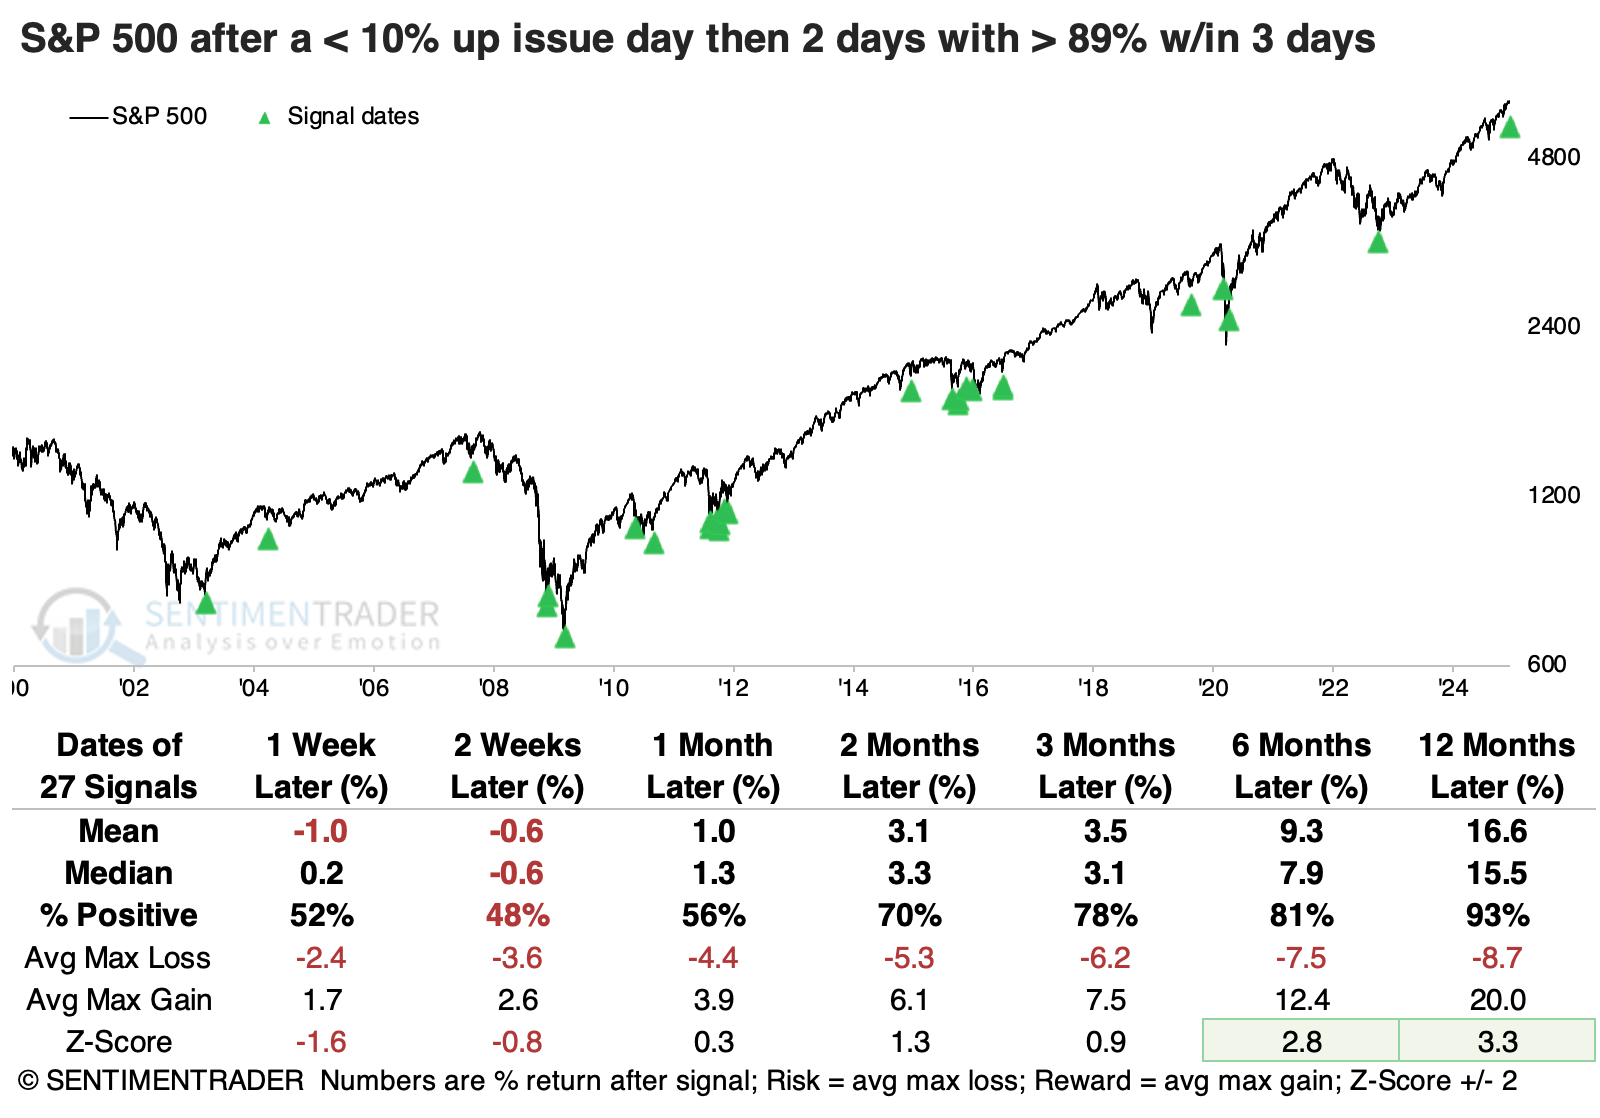
The deterioration in some trusty long-term breadth metrics bears watching. Healthy market environments do not typically see readings like we're seeing now, at least for more than a few sessions at a time. The biggest caveat to becoming too negative is that buyers have already shown an impressive interest in buying the dip in the average stock.
Financial conditions are getting tighter
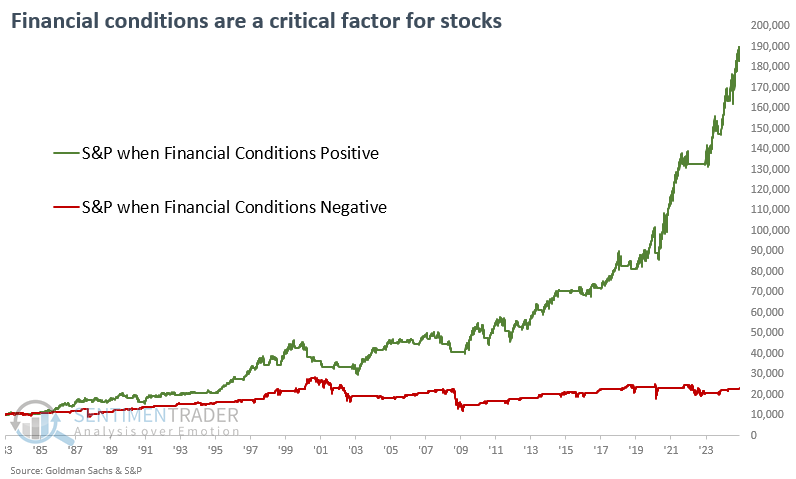
The Goldman Sachs Financial Conditions Index shifted higher, indicating a tightening in financial conditions. Dean showed that returns for the S&P 500 are more unfavorable when financial conditions tighten rather than ease.
A system that measures when the Goldman Sachs Financial Conditions Index eases or tightens relative to its range triggered a risk-off signal as macro factors in the composite shifted to a more unfavorable status.
As shown in the chart below, this marks the third risk-off signal since stock indexes bottomed in the fall of 2022. The previous two occurrences were relatively brief, with the S&P 500 finding a bottom 26 and 4 days later.
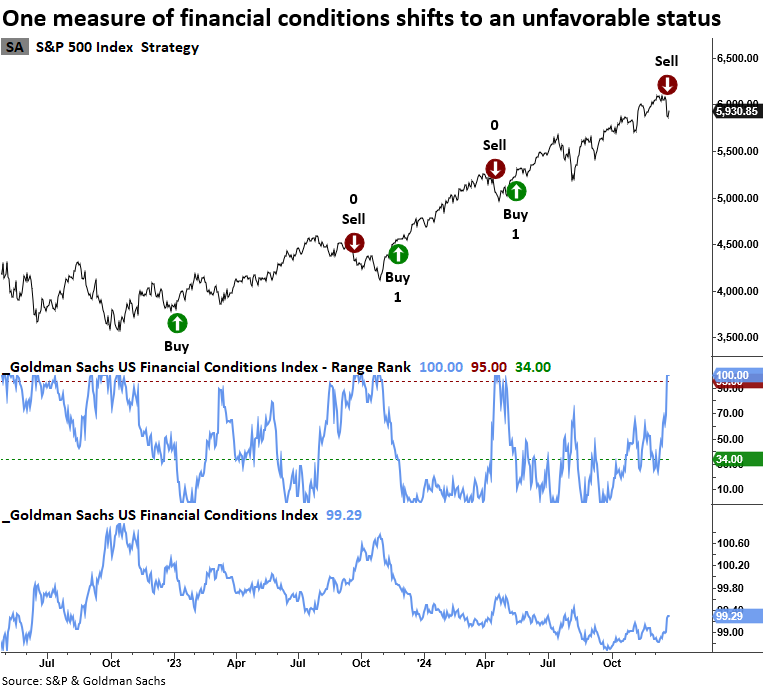
The model applies an 84-day range rank to the Goldman Sachs Financial Conditions Index. When the range rank declines below the 34th percentile, and price momentum for the S&P 500 is positive, the system goes long. Conversely, the model issues a sell signal when the range rank increases above the 95th percentile and the S&P 500 exhibits negative price momentum.
When examining a binary all-in or all-out model, the most suitable way to gauge the strategy's validity is by assessing the performance of an initial capital outlay. Utilizing the range rank rules, a $10,000 investment in the S&P 500 increases to $183,000 when financial conditions ease. Conversely, tightening conditions result in significantly smaller growth, with the initial investment reaching only $23,000.
Analyzing sell signals with an outlook table shows that the most significant risk often materializes within the first two weeks. This trend has intensified over the past few decades, with 25 of 28 signals recording losses at some point during the initial weeks.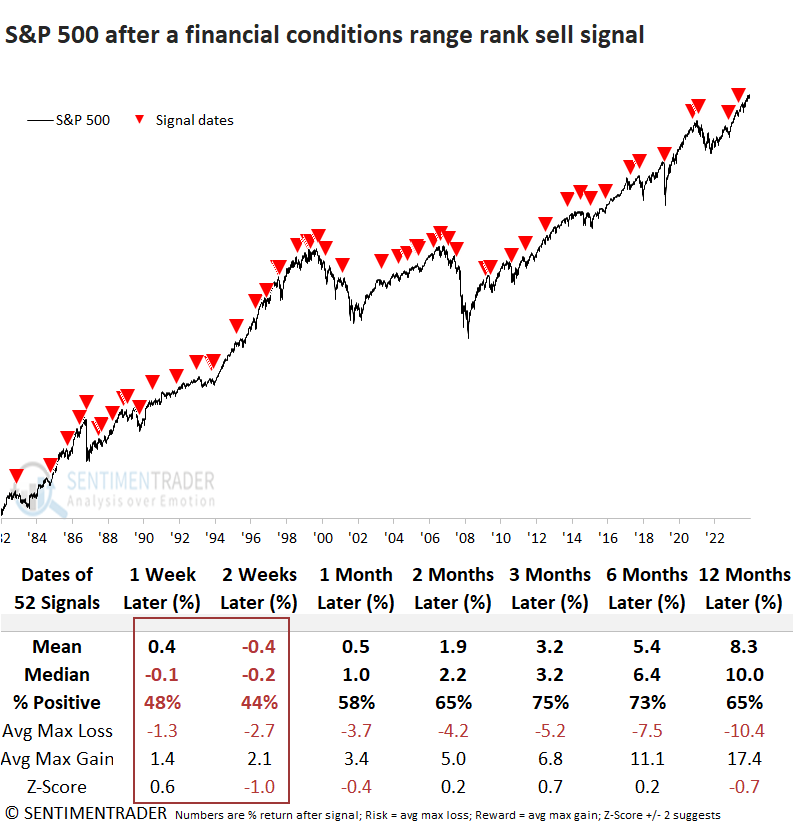
At least the Leading Indicators are looking up
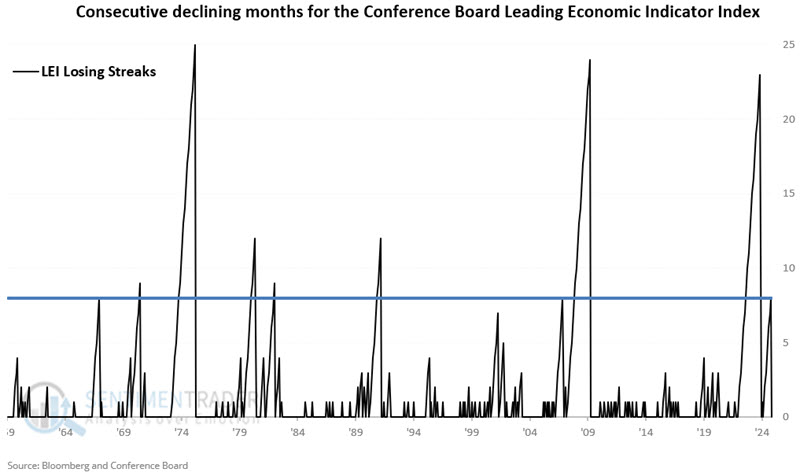
The Conference Board Index of Leading Economic Indicators ticked higher in the latest reported month after eight consecutive months of decline. Jay showed that this simple reversal has typically been a positive sign for both stocks and the overall economy.
The Conference Board Index of Leading Economic Indicators (LEI) most recent report came out in mid-December and showed an upside reversal for November 2024. The table below displays a history of monthly losing streaks for the index.
 For testing purposes, we measure performance beginning at the end of the month when the most recent LEI data was released. For example, November 2024 index data was released in mid-December 2024. For testing stock and economic performance going forward, we will use December 31st, 2024 as our test date for the November 2024 data. A favorable signal for stocks occurs when the LEI reverses higher for one month after declining for at least eight consecutive months.
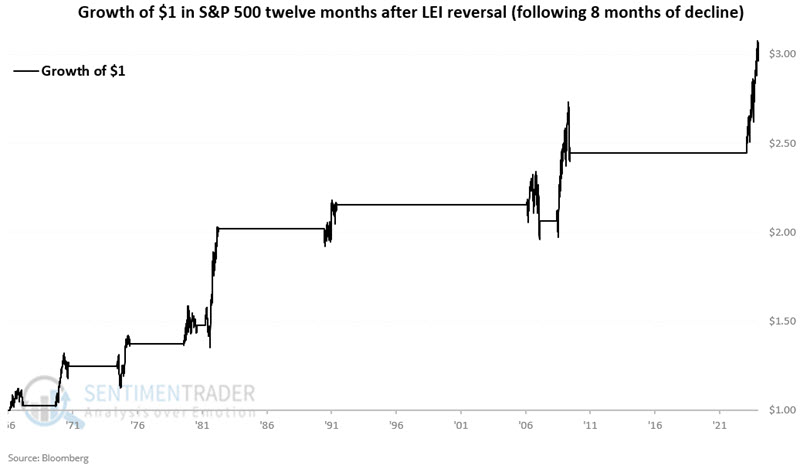
The chart below displays the hypothetical growth of $1 invested in the S&P 500 Index only during the purportedly favorable periods highlighted in the table above.
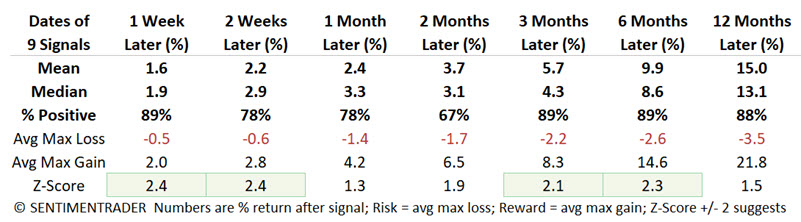
The table below displays S&P 500 results for various timeframes following previous signals.
Jay also noted that these reversals in the LEI tended to also lead to rises in the Coincident Economic Activity Index (CEAI).
Healthcare hasn't been very healthy
The healthcare sector has experienced significant weakness relative to the overall market. Jay noted that on the plus side, several generally reliable indicators are suggesting better days ahead for this downtrodden sector.
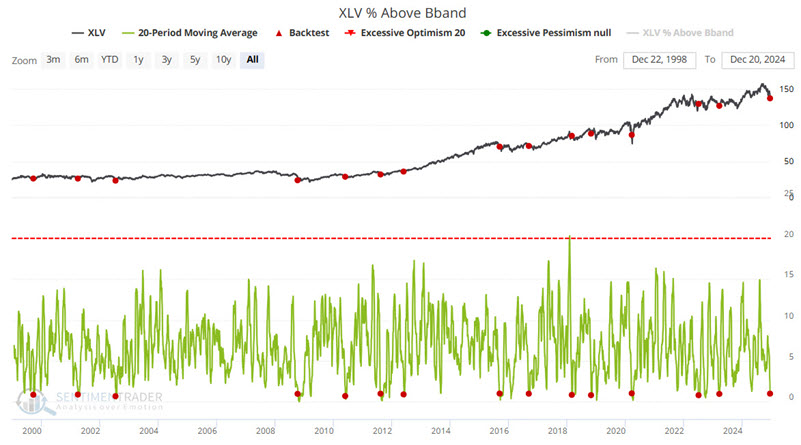
Buying into a plunging situation is fraught with peril and is generally considered a risky move. That said, the chart below shows the percentage of stocks in the XLV fund that are currently trading above their upper Bollinger Band.
Oftentimes, at turning points, the underlying breadth will diverge positively (at the bottom) or negatively (at the top) from the index. It is also helpful to monitor extremes in the breadth figures. When so many components of an index are doing well or poorly, we usually see the index make a counter move. The chart below highlights with a red dot each day when the 20-day moving average of the percentage of XLV constituent stocks above their upper Bollinger Band crossed below 1 for the first time in six months. XLV witnessed a 100% win rate over the following year.
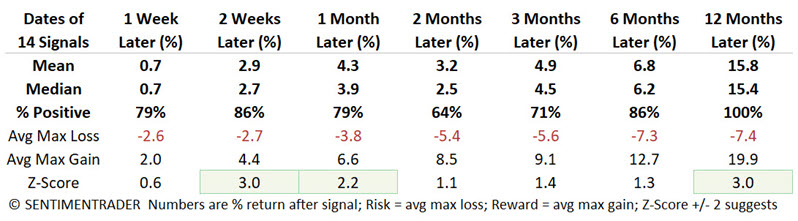
Jay also touched on our XLV Optix indicator and the XLV Advance/Decline metric, both of which showed extremes and tendency toward positive forward returns.
Our Panic Breadth Composite indicator offers a unique perspective on market sentiment and breadth analysis, aggregating various market metrics to gauge market participation breadth. The chart below highlights with a red dot each day when the 10-day moving average of the XLV Panic/Breadth Composite indicator crossed above 38 for the first time in six months. 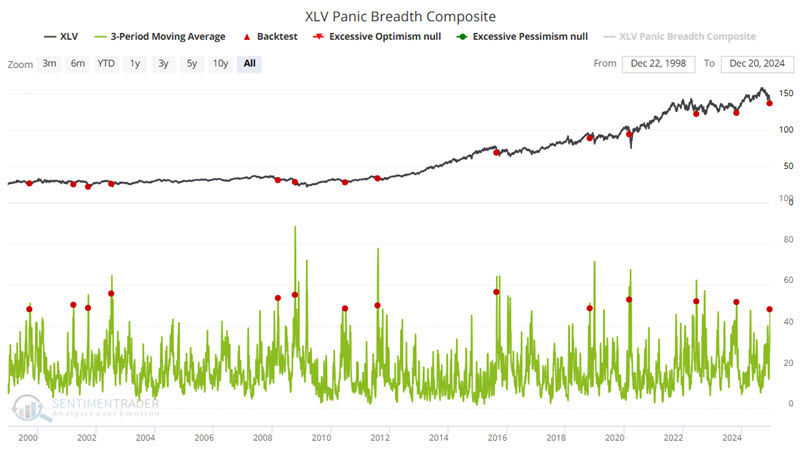
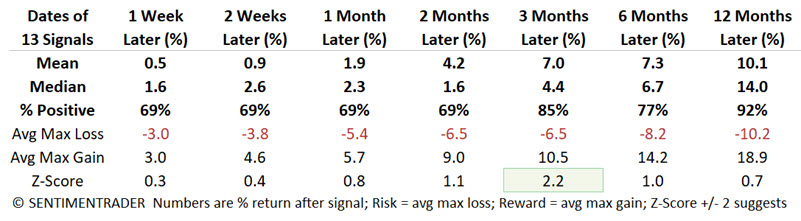
We can see from the table that over the next 3-12 months, XLV showed a strong tendency to rebound.
About TradingEdge Weekly...
The goal of TradingEdge Weekly is to summarize some of the research published to SentimenTrader over the past week. Sometimes there is a lot to digest, and this summary highlights the highest conviction or most compelling ideas we discussed. This is NOT the published research; rather, it pulls out some of the most relevant parts. It includes links to the published research for convenience, and if you don't subscribe to those products, it will present the options for access.