
TradingEdge Weekly for Dec 20 - A year of bulls, breadth warnings, year-end seasonal sectors

Key points:
- Sentiment surveys have been almost universally bullish during 2024
- Underlying trends are deteriorating
- There was a surge S&P 500 stocks hitting new lows
- Value stocks are mired in a historic losing streak, especially relative to growth stocks
- Small cap and value stocks tend to rally into the New Year
- More than a third of energy stocks fell to a new low
- Real estate stocks have been among the best performers during the last week of the year
A year of bulls
This has been a year for bulls...and they know it.
This will go down as a year with among the most bullish sentiment since the 1987 inception of the AAII survey. The only two years with more consistent optimism were 1995 and 1999. The former had a rough couple of weeks to start the new year before booming, while the latter had a rough time overall.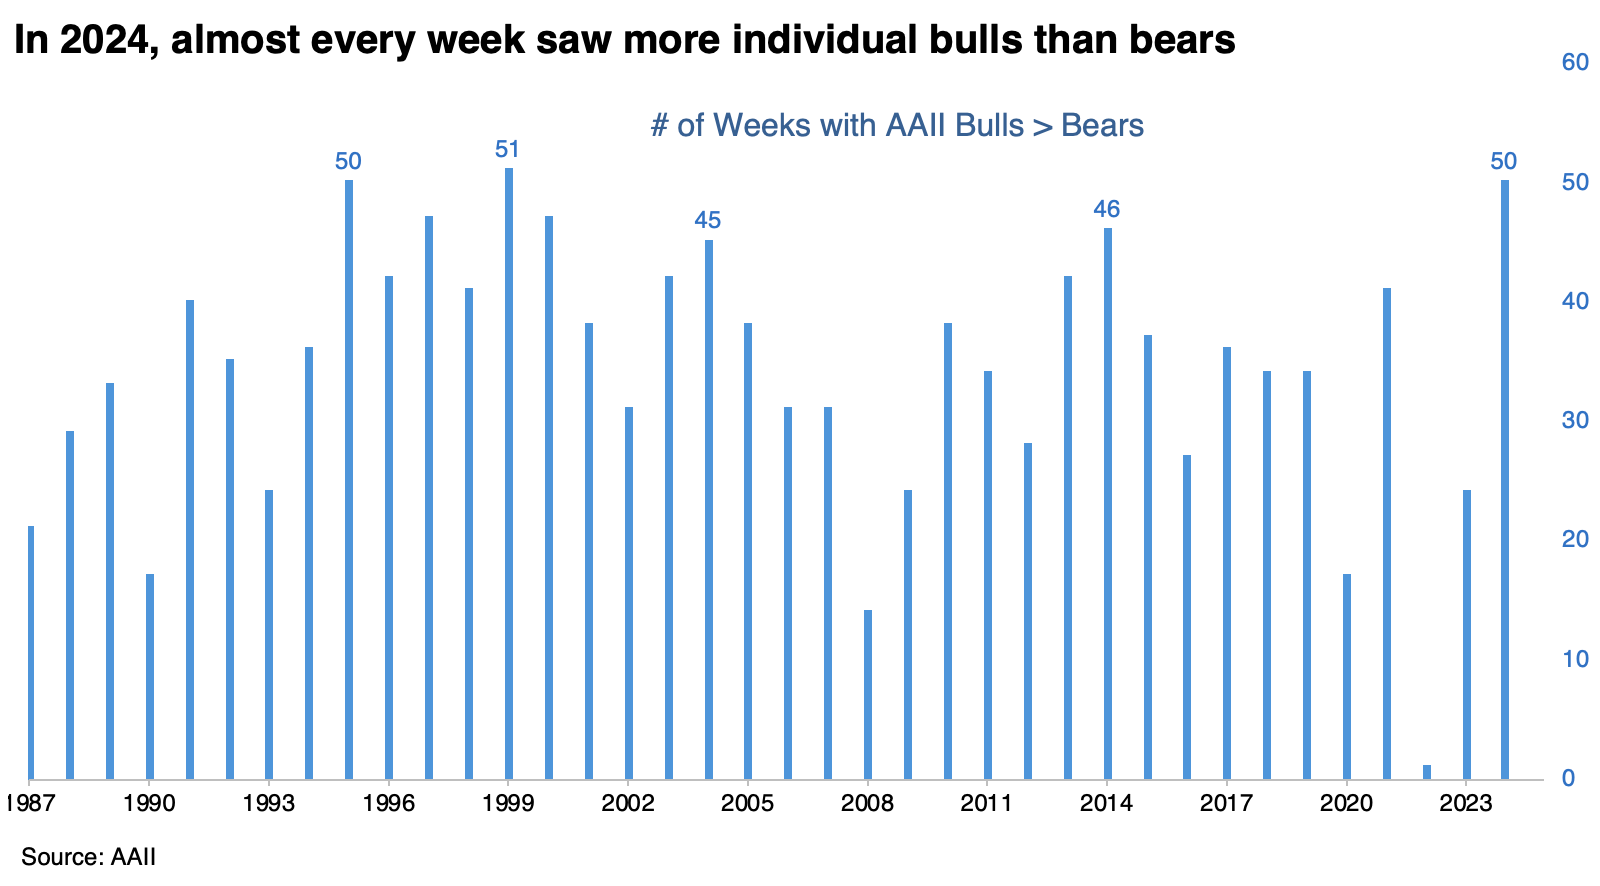
A scatter plot shows the number of weeks in a year with more bulls than bears, referenced against the S&P 500's return over the following year. The regression line shows a negative correlation, so the more weeks with bullish sentiment, the poorer next year's return.
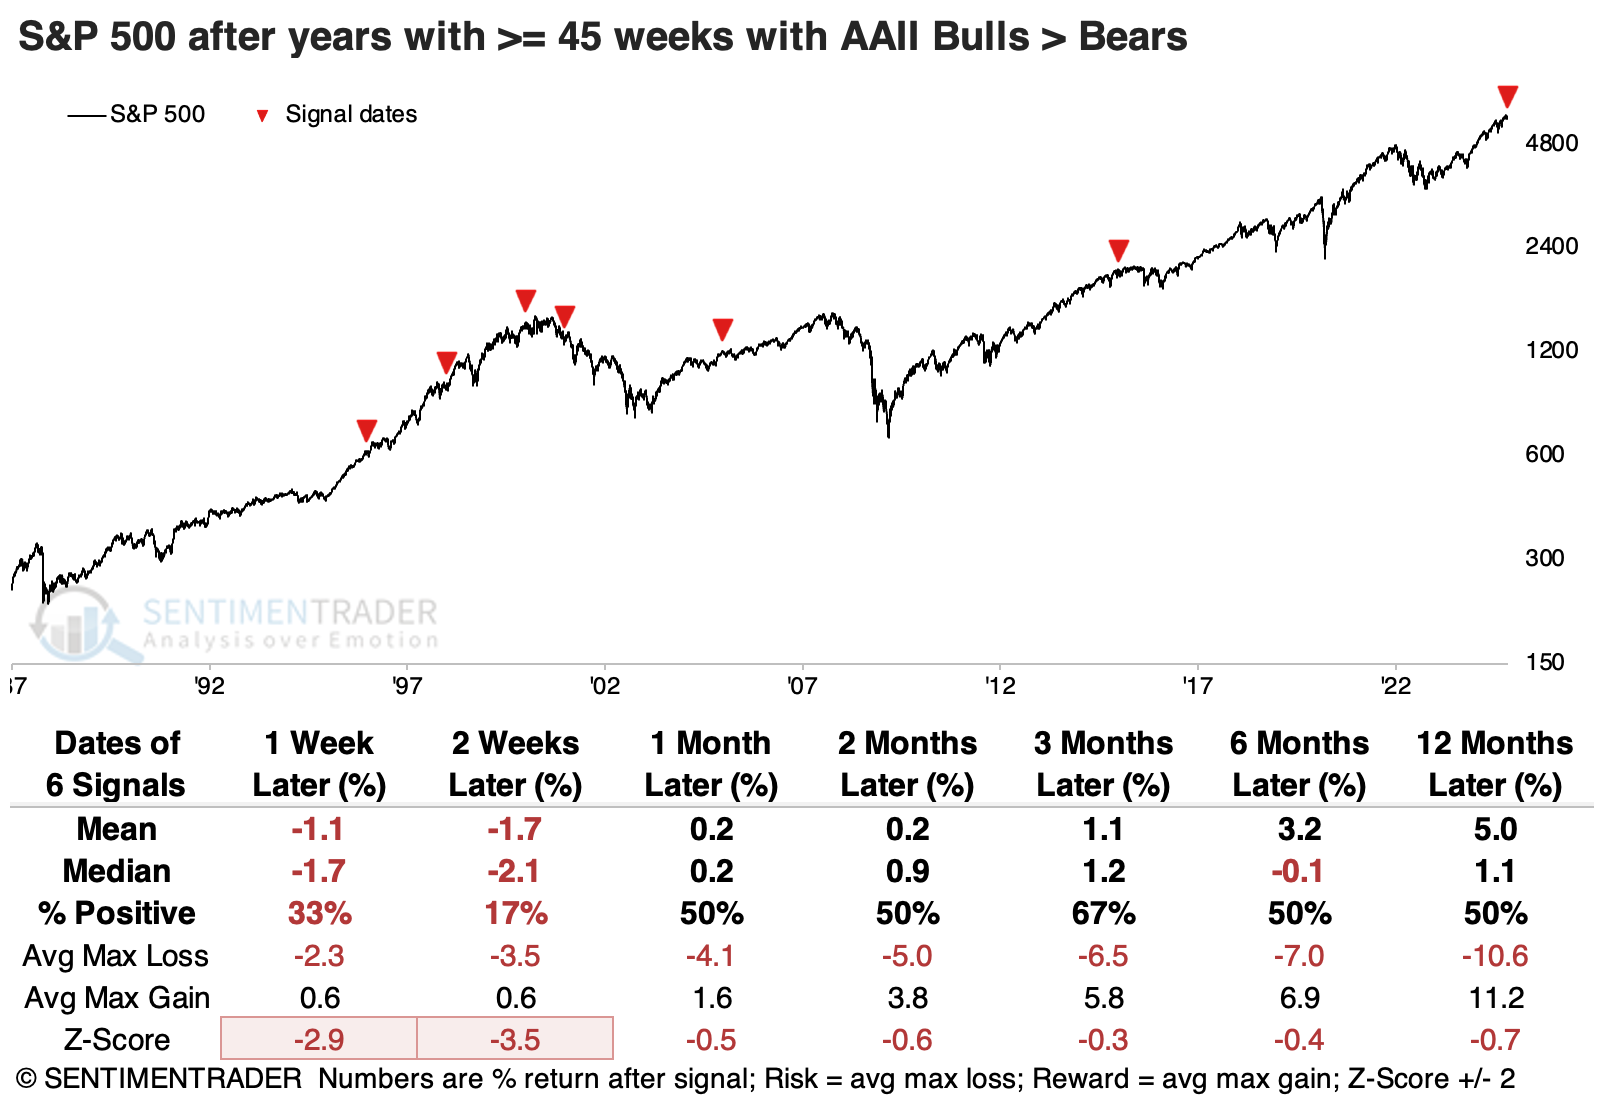
After any year with at least 45 weeks of net bullish sentiment in the AAII survey, the S&P 500 tended to suffer weakness during the first couple of weeks of the new year. The one year that didn't show weakness ended up giving all its gains back, and then some - it was the peak of the internet bubble.
The Investor's Intelligence survey of newsletter writers goes back more than a decade. While it doesn't necessarily sample the same population, the overlap between the two surveys is consistent. In that survey, we'll likely see twice as many bulls as bears for more than 50 weeks this year.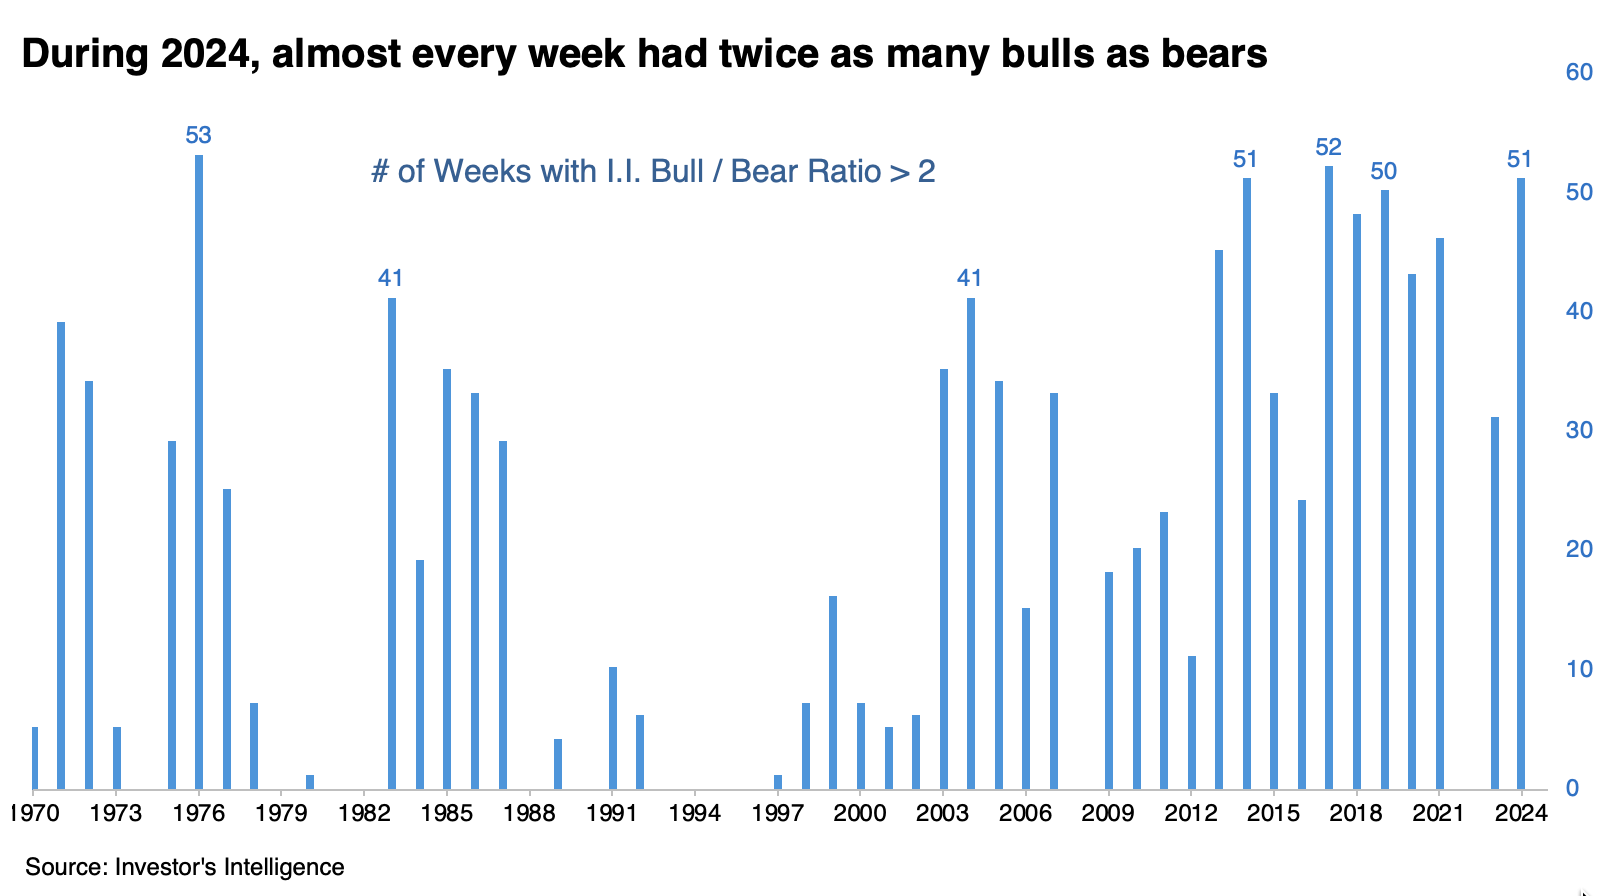
This scatter plot, too, shows a negative relationship between the number of weeks in a year with twice as many bulls as bears and the S&P's return over the following year. The table below shows every year with at least 50 weeks with twice as many bulls as bears. All of them showed losses in the S&P 500 either six or twelve months later.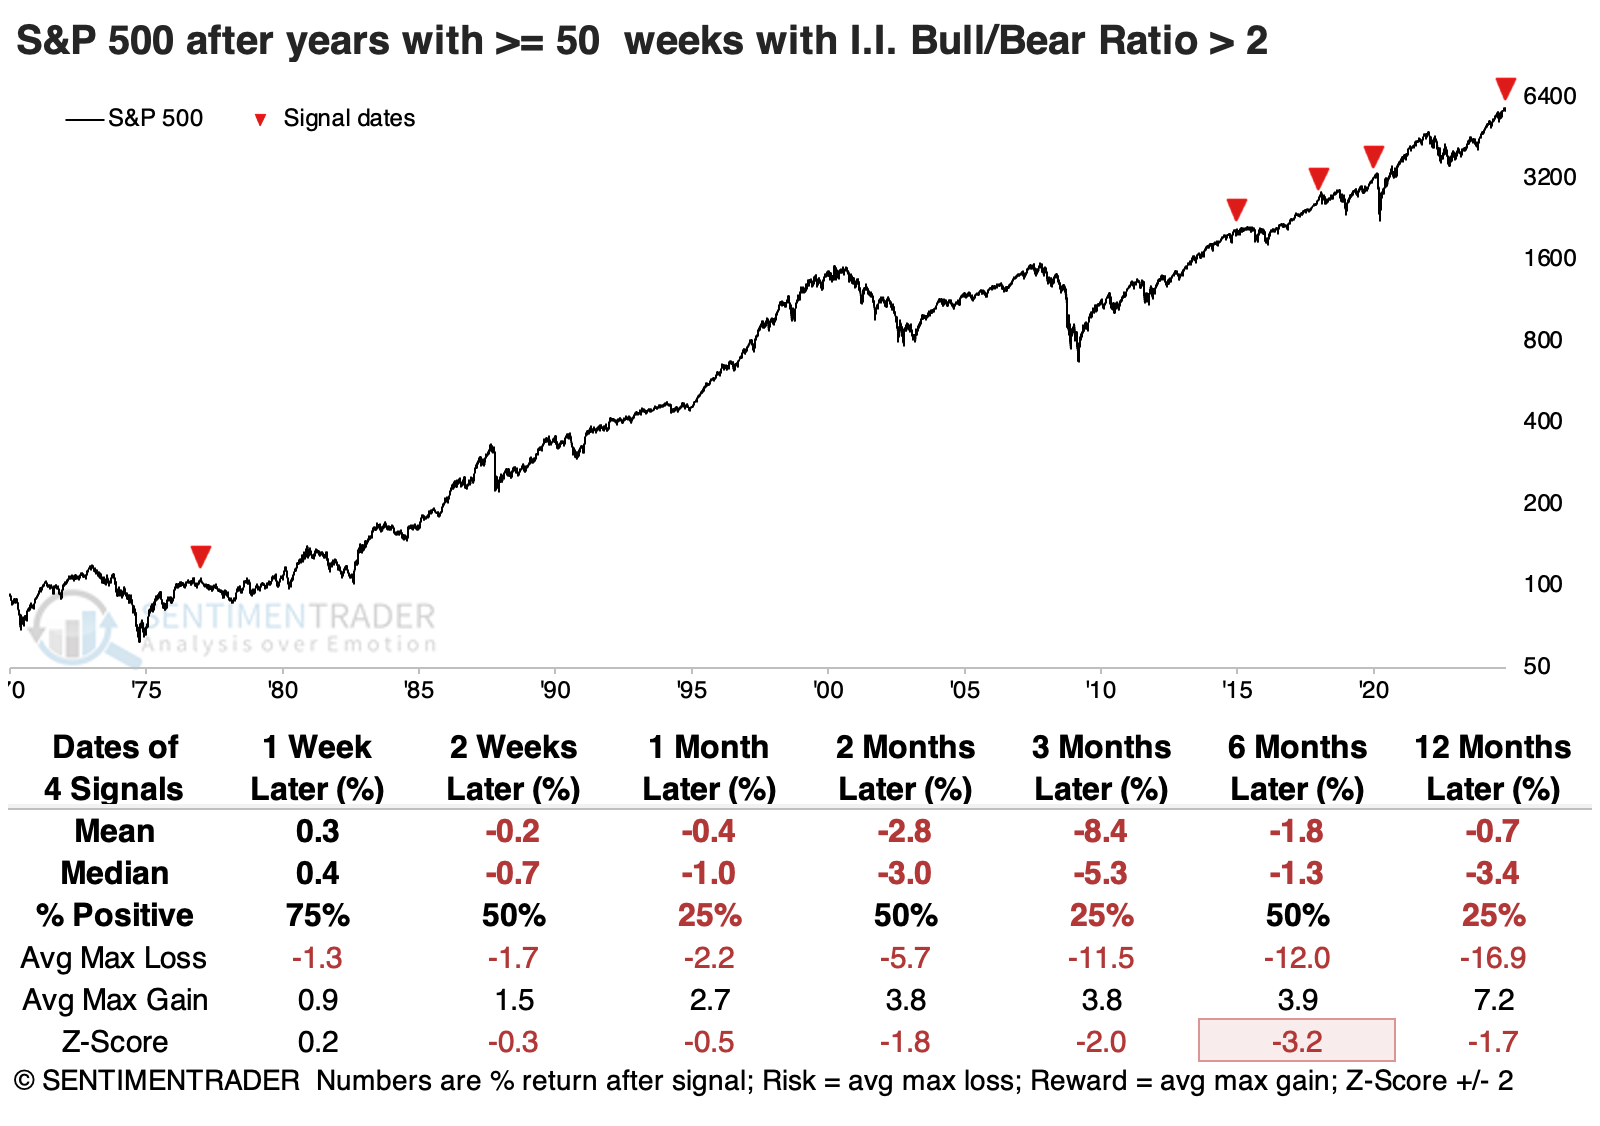 There are a few more precedents if we relax the parameters to 45 weeks of extreme bullishness during a calendar year. Even so, only two (2013 and 2018) enjoyed more reward than risk over the following year.
Trends are deteriorating
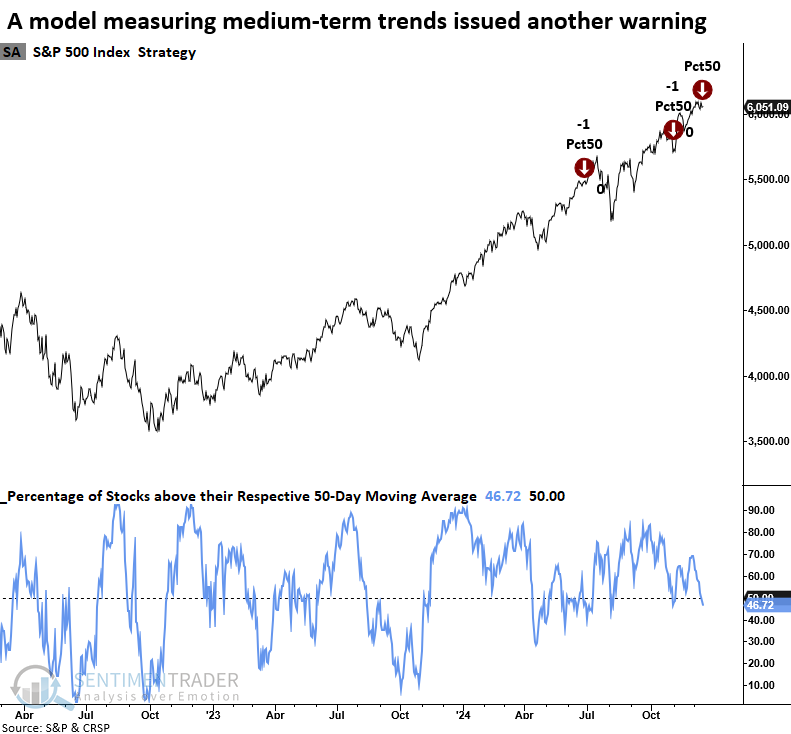
A Risk-Off Composite Model member that assesses medium-term price trends triggered a warning. Dean noted that similar market breadth conditions saw the S&P 500 struggle over the following two months.
With sector rotation now favoring technology-oriented mega-cap stocks over the average stock, short-term market breadth indicators like those in the Composite Risk-Off Model have triggered several signals.
The latest to fire a warning identifies periods when fewer than 50% of S&P 500 stocks reside above their respective 50-day average, with the index hovering near a high. The chart below illustrates that the S&P 500 has continued to advance despite these warnings, indicating that the participation problem is likely nothing more than sector rotation.
Following a percent above the 50-day average risk-off warning, the S&P 500 experienced a challenging period, especially over the next few months. Furthermore, risk outweighed reward across all time frames except the one-year mark, and that ratio was barely positive.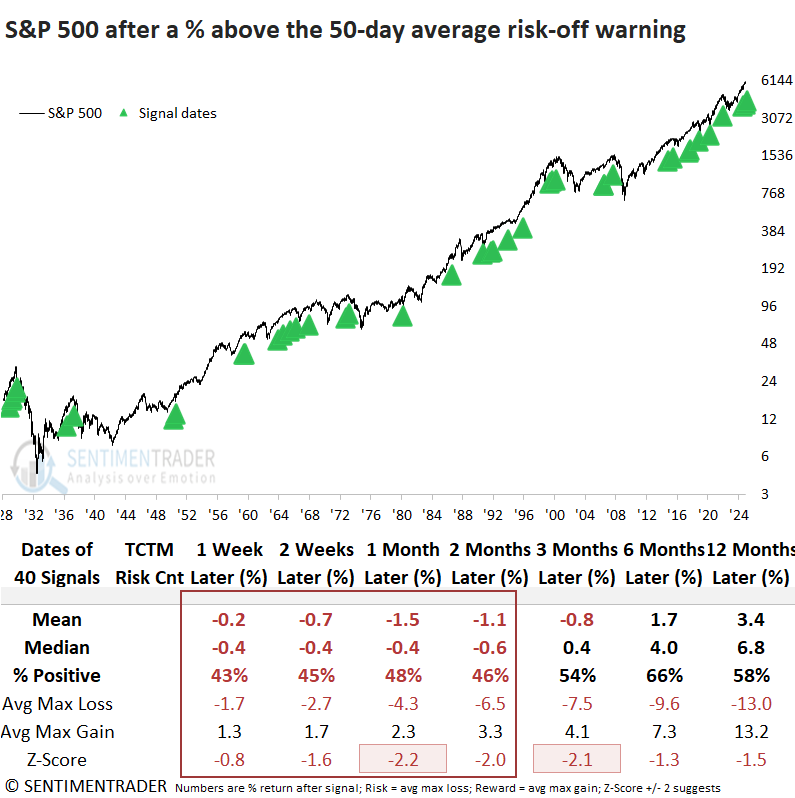
Multiple signals in 2017 provide an example of the sector rotation scenario that can occur in an uptrend rather than a systemic problem, like in the fall of 2018 when the percent above the 50-day average warning coincided with a signal count of 70% from the TCTM Risk Warning Model.
As highlighted in previous reports, defensive and commodity-focused sectors are the main drivers of the deterioration in market breadth. Cyclical growth and value groups, though softening, display more favorable trends. As long as the cyclical groups remain resilient, the sector rotation scenario will unlikely evolve into a broader systemic issue.
More new lows
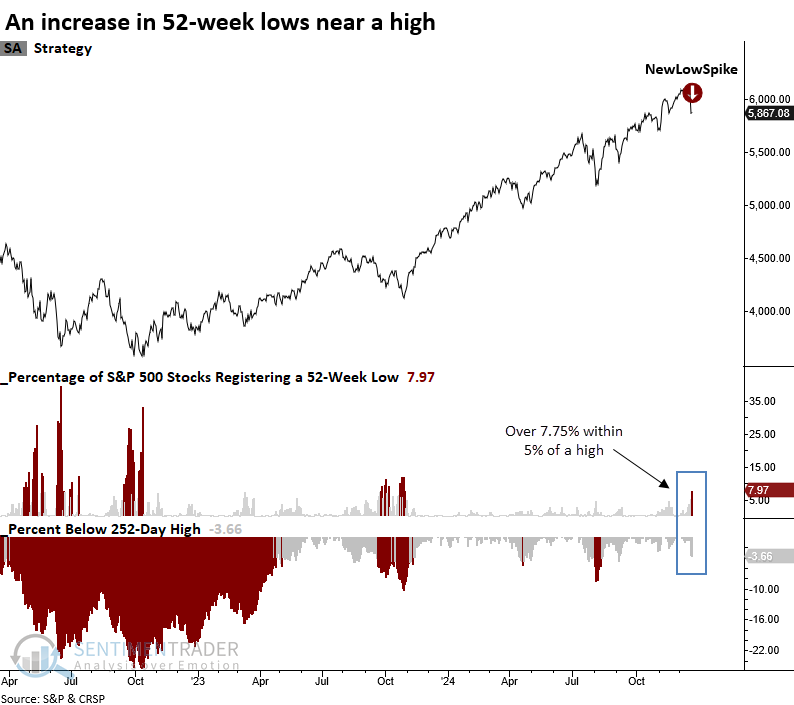
Dean further noted that over 7.75% of S&P 500 stocks registered a 52-week low, with the index less than 5% below a high. Similar expansions in lows near a high produced a negative outlook for the S&P 500.
The previous signal was triggered in October 2018. Over the subsequent three months, the S&P 500 experienced a max loss of -15.6%.
Whenever more than 7.75% of S&P 500 stocks hit a 52-week low with the index no more than 5% below a 252-day high, the world's most benchmarked index demonstrated an unfavorable outlook over the subsequent year. The average maximum loss exceeded the maximum gain across all time frames, and returns were significantly worse than random returns in all but one horizon.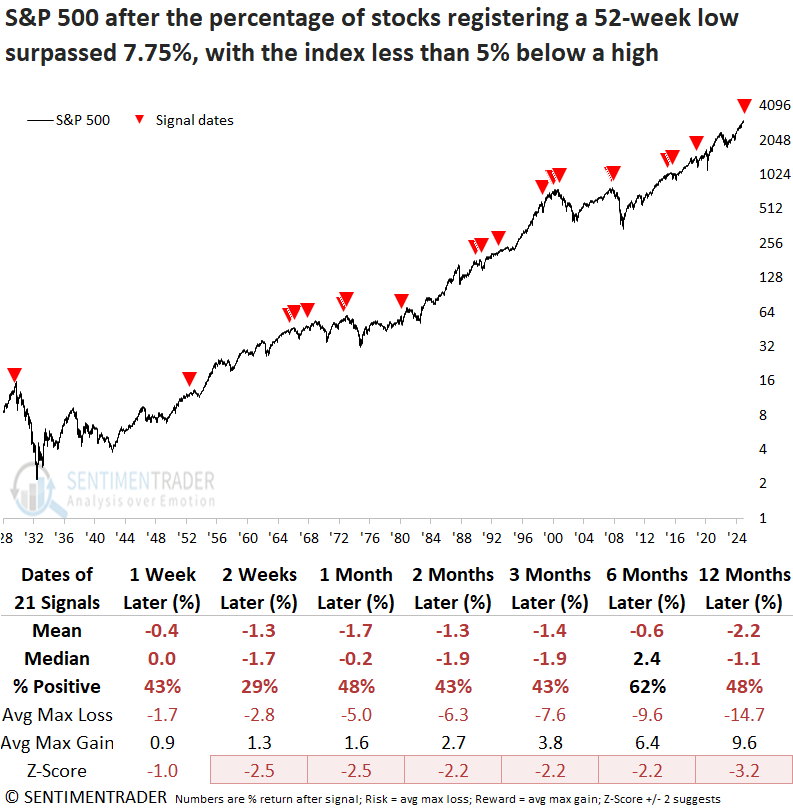
As noted in previous reports, the deterioration in market breadth indicators continues to be primarily influenced by defensive and commodity-focused sectors. It's crucial to note that Financials, the most critical sector to monitor, did not experience any new lows on Thursday. This absence is a positive sign, offering hope amidst broader signals suggesting the uptrend could falter.
Waiting for value
Contrarians have long been waiting for mean reversion to take hold. They've been frustrated by the conflict between small and large stocks and between value and growth stocks.
It just keeps getting worse. Over the past three weeks, value stocks have slid more than 8% relative to growth, one of the worst 3-week stretches since the 1940s. The latest string of losses has pushed the total return ratio between value and growth stocks to a 23-year low. It would only take a few more bad days for value and good ones for growth to send the ratio to its lowest level in more than 40 years.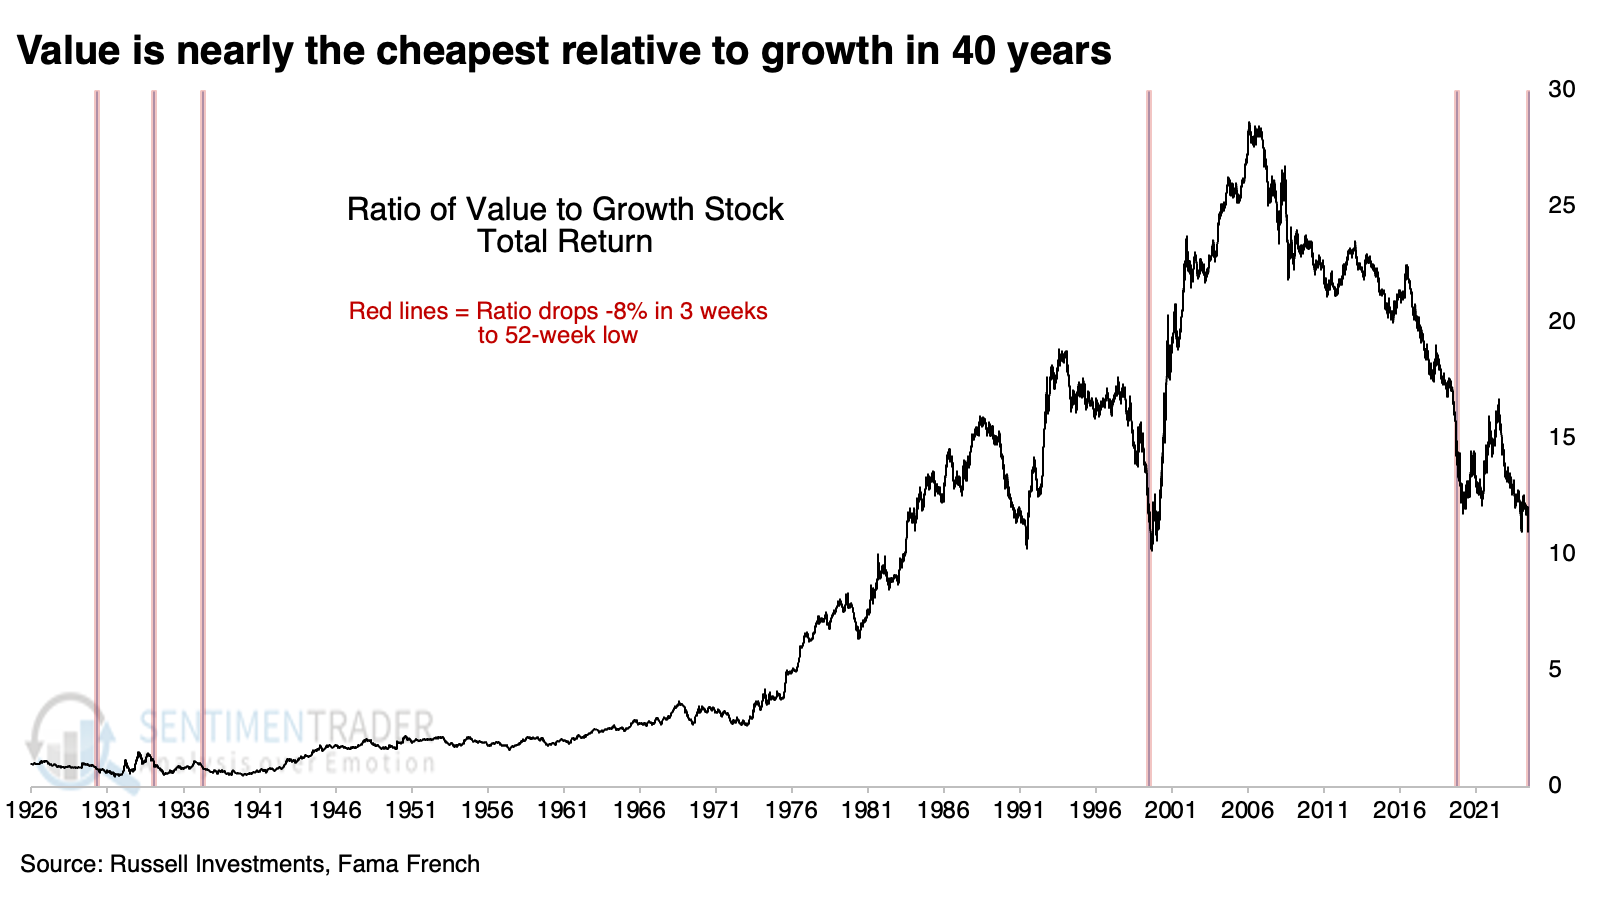
While the chart looks like a good time for mean reversion, the ratio suffered further losses every time up to nine months later. Not one of the (admittedly tiny) precedents marked the low for the ratio - value kept sliding relative to growth for up to nine months.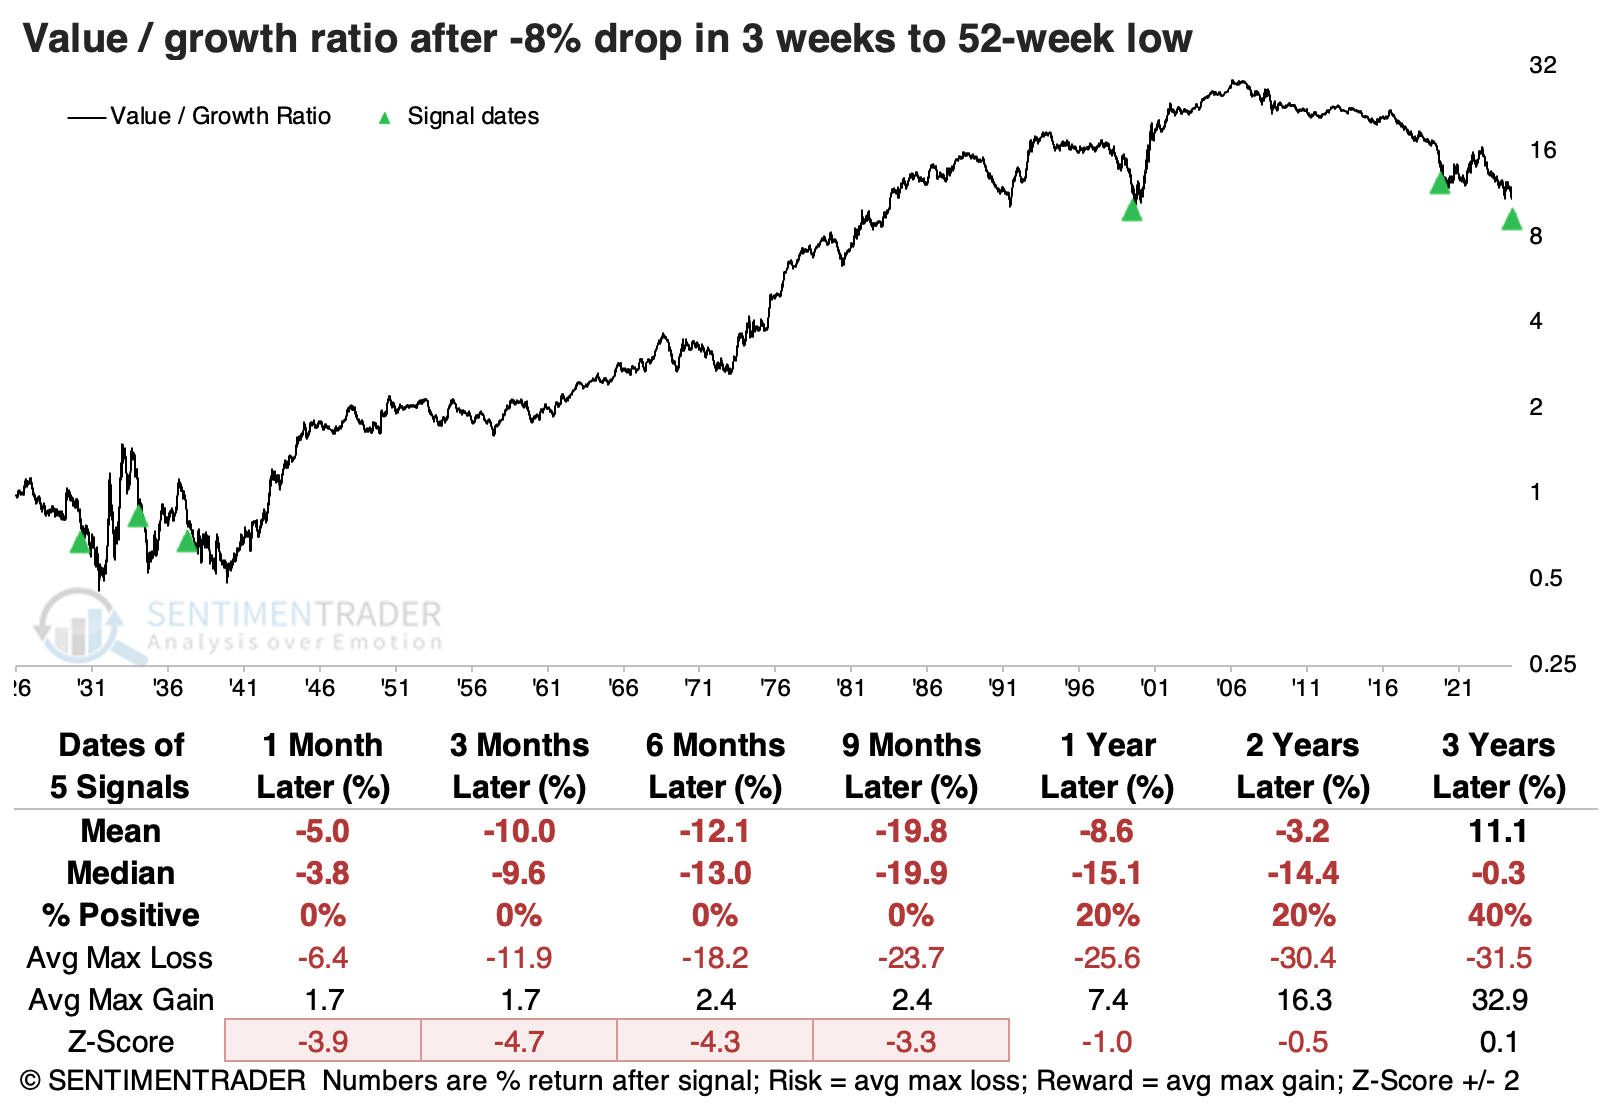
Growth stocks showed mixed returns, with two large gains in total return over the following year and two large losses. Value stocks suffered more consistently, though the losses were mostly confined to the 1930s. The 1999 signal preceded a modest gain versus horrid losses for growth stocks, a massive win for value.
It's tough to read much into such a tiny sample size. Lowering the three-week decline to -5% (instead of -8%) dramatically increases the number of precedents. If we only consider signals since the U.S. emerged from the Great Depression, the long-term relative returns for value stocks improved significantly. Over the following two to three years, value outperformed growth most of the time, and the few exceptions tended to be minor.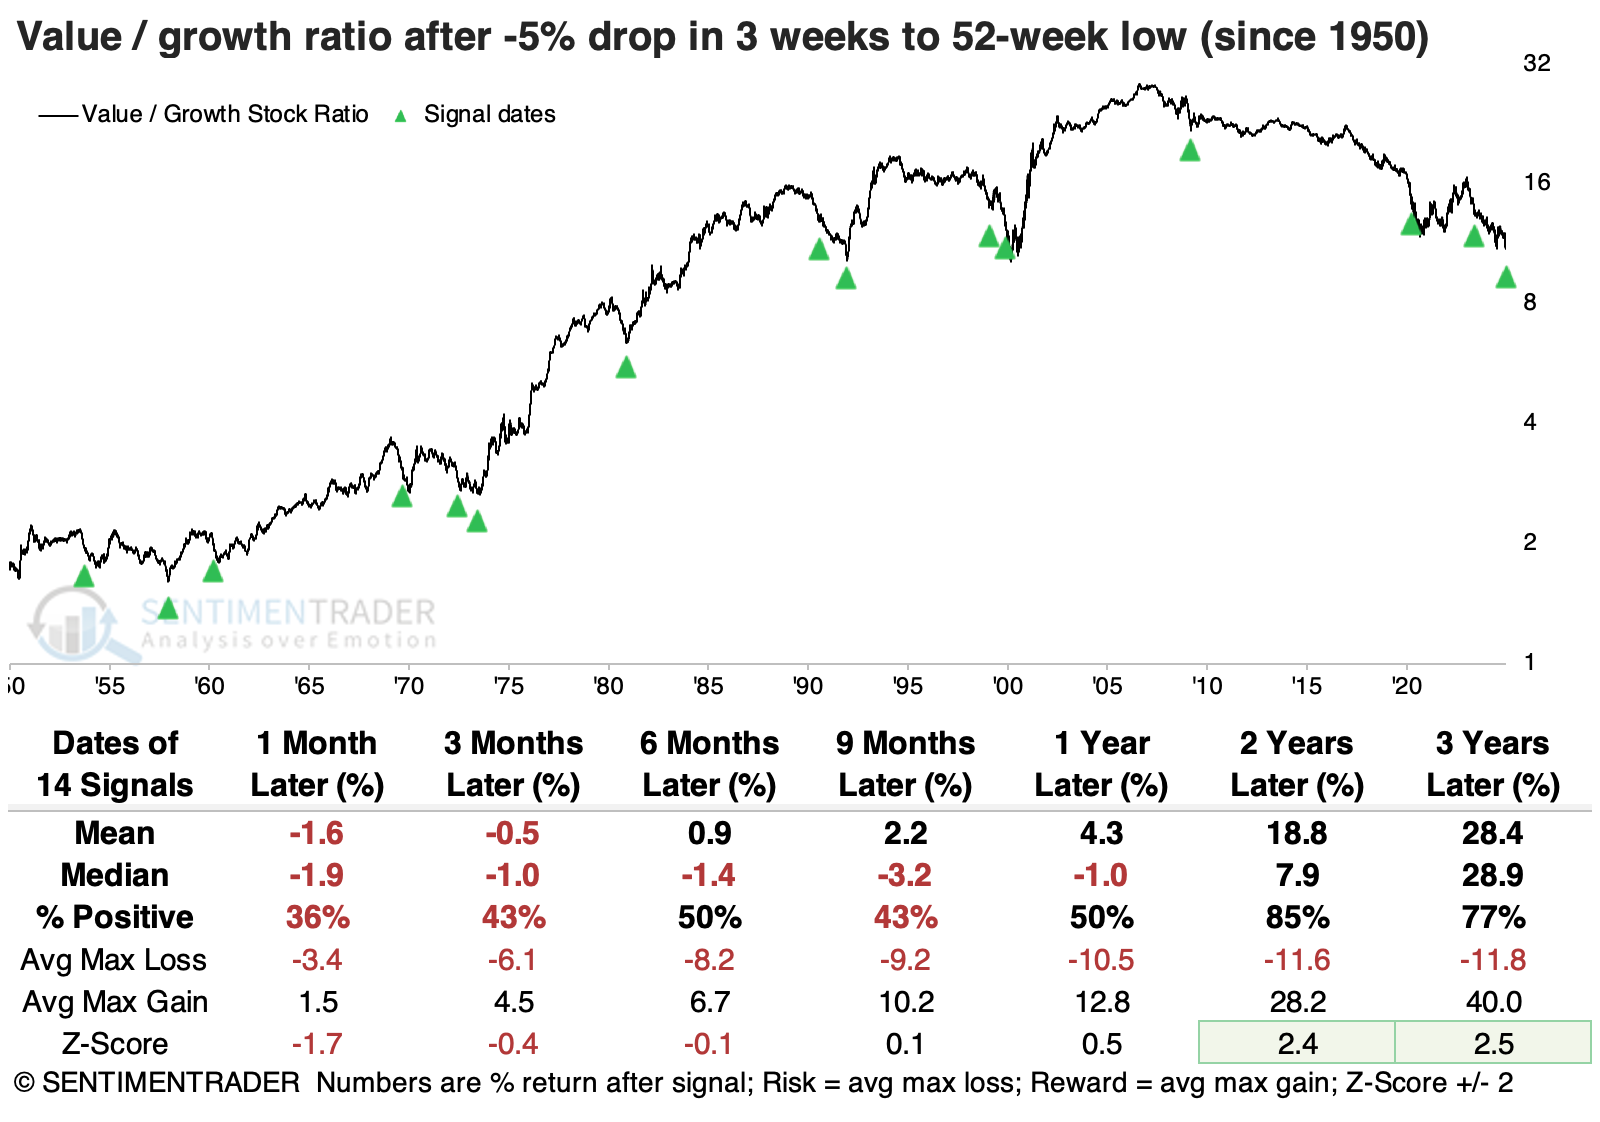
Small and value stocks into the New Year
The last portion of the year tends to be favorable for stocks into the new year. Jay showed that a simple combination of factors has demonstrated a highly consistent performance over the past 70 years.
The period we will consider starts at the close of Trading Day of the Year #244 and ends at the close of the first trading day of the following year. For 2024-25, this period extends from the close on 2024-12-18 through 2025-01-02.
The chart below displays the hypothetical cumulative growth of $1 invested in Small-cap and Value factors during this year-end period every year since 1953.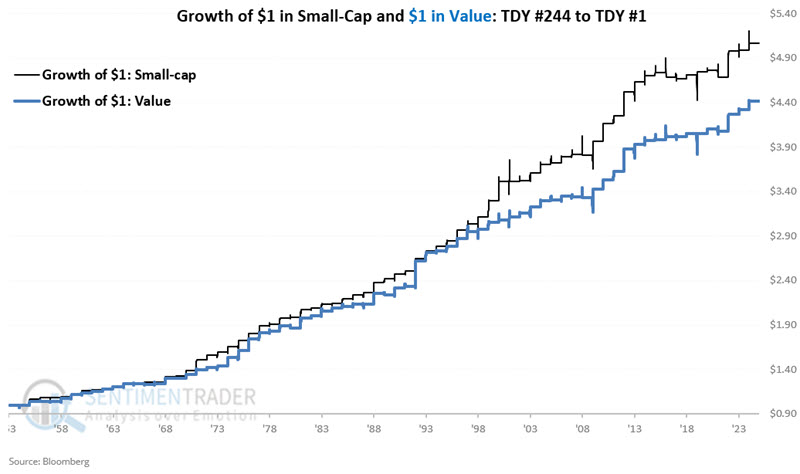
Let's consider a strategy that evenly divides capital between Small-cap and Value indexes only during this favorable year-end period. The chart below displays the cumulative hypothetical growth of $1 split evenly each year between Small-cap and Value during the TDY #244 through TDY #1 period.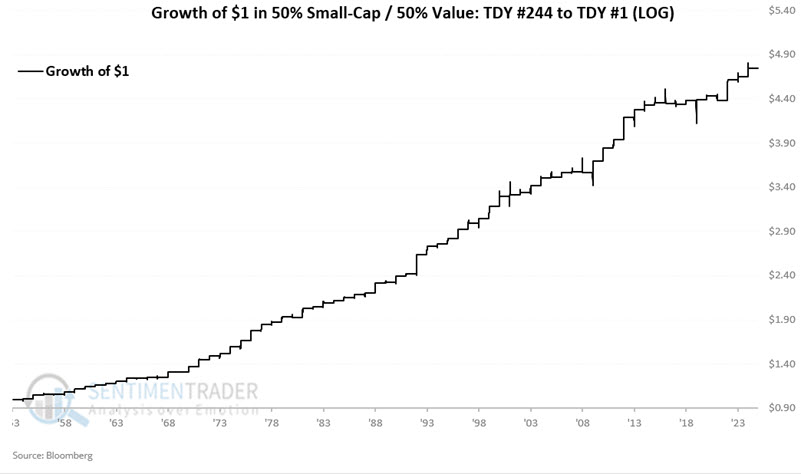
The strategy showed a gain 93% of the time, with an average gain about five times larger than the average loss. There were fourteen years that showed a gain larger than +4%, while none of them lost more than -4%.
For those using ETFs, the iShares Core S&P Small-Cap ETF (ticker IJR) tracks the S&P 600 Small-Cap Index and the SPDR Portfolio S&P 500 Value ETF (ticker SPYV) tracks the S&P 500 Value Index.
Energy stocks falling to new lows
More than 35% of S&P 500 Energy sector stocks registered a 52-week low. Dean showed that similar expansions in lows produced a slight upward bias in the sector over the next three months.
The steep pullback in energy stocks in recent weeks has caused market breadth indicators for the sector to reflect oversold conditions. For instance, more than 35% of stocks reached 52-week lows, a threshold often seen during pronounced downtrends, resulting in an annualized return of -61.8% when breached. However, during this latest occurrence, the sector traded within 15% of a multi-year high, a stark contrast from most precedents contributing to the highly unfavorable annualized returns.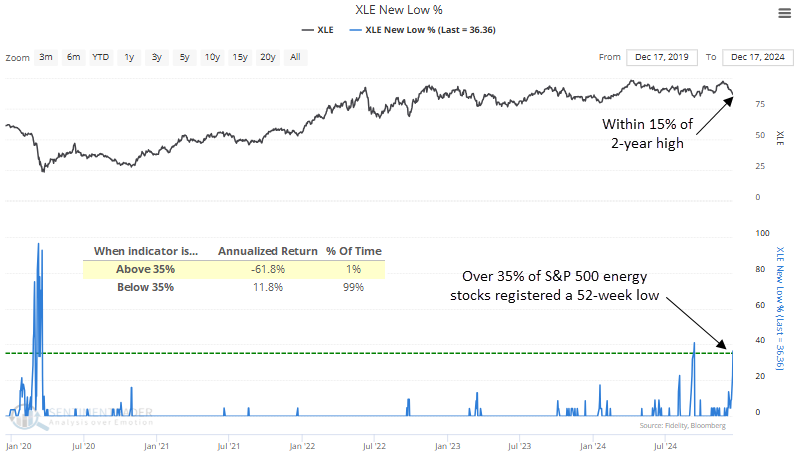
Whenever over 35% of S&P 500 Energy sector stocks hit a 52-week low with the index no more than 15% below a multi-year high, the sector demonstrated a slight tendency to recover in the ensuing three months. Within a year, the energy sector rose in all but one case.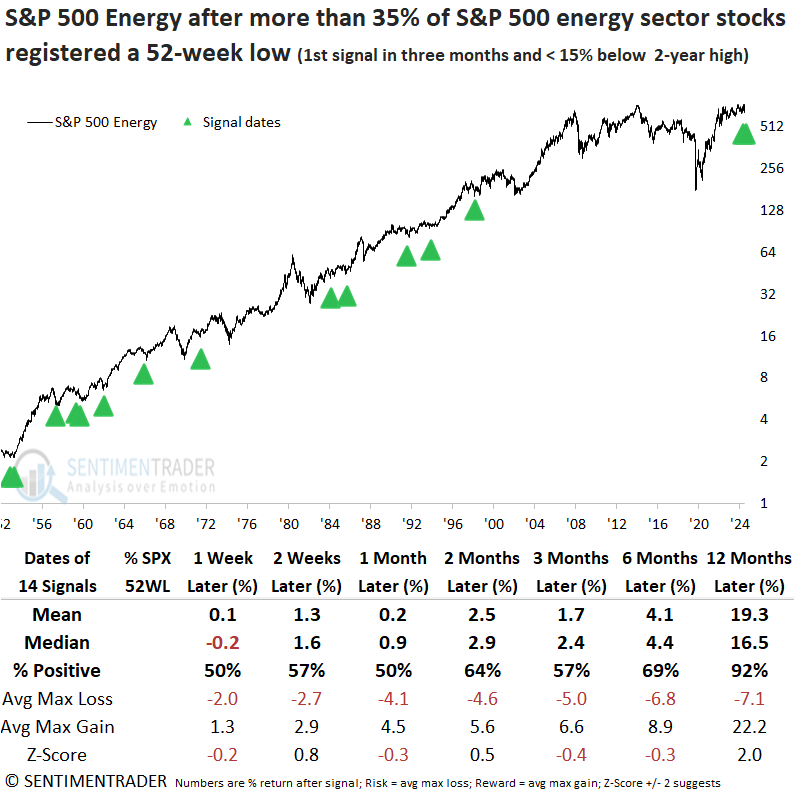
Although the last three signals, including the September 2024 instance, exhibited solid outperformance against the S&P 500, the overall outlook was decidedly negative. Moreover, the one-year timeframe, which displayed excellent absolute returns and consistency, was disappointingly lackluster from a relative perspective.
Following comparable spikes in 52-week lows for the energy sector, the broad market and sectors displayed excellent results.
Last week real estate
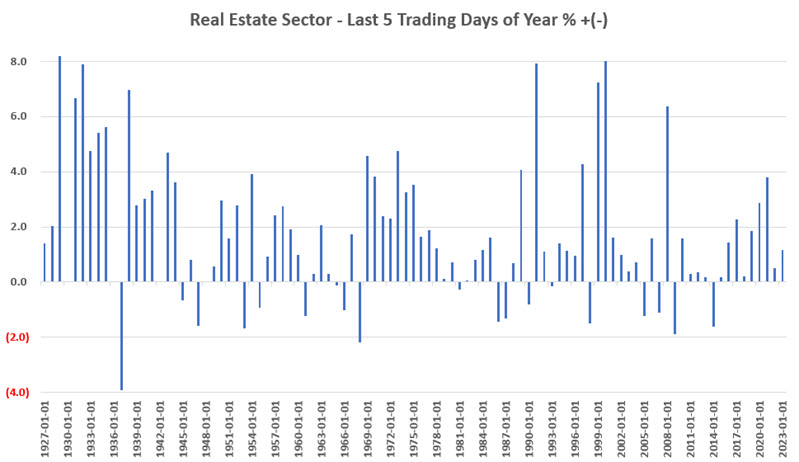
Of the 11 S&P 500 sectors, Jay noted that the real estate sector has been the top performer during the last five trading days of the year.
For 2024, the last five trading days begin at the close on 2024-12-23 and end at the close on 2024-12-31. For our test, we will use index data going back to 1927. The chart below displays the index's year-by-year % return if held ONLY during each calendar year's final five trading days.
The chart below displays the cumulative growth of $1 if invested in the index ONLY during each calendar year's final five trading days.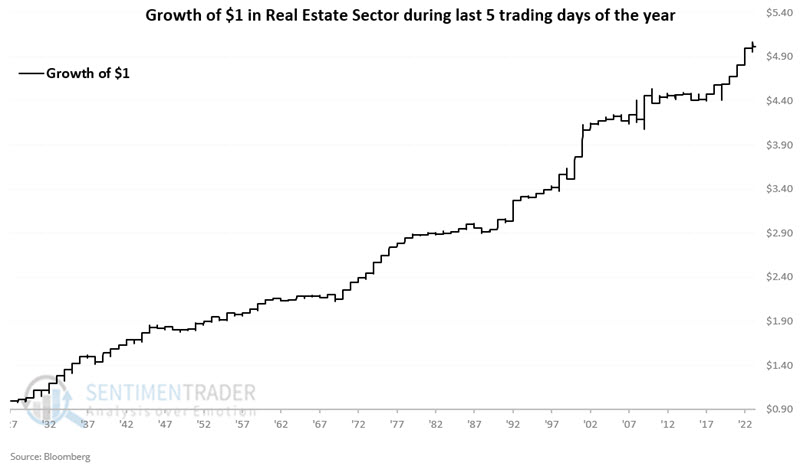
These periods witnessed a gain 76% of the time, with the average gain about twice as large as the average loss. The sector gained more than +3% during 25 years, while suffering a loss larger than -3% only once.
The most straightforward way to exploit this trend is to buy shares of an ETF. The Real Estate Select Sector SPDR Fund (XLRE) tracks the S&P 500 Real Estate Sector Index.
About TradingEdge Weekly...
The goal of TradingEdge Weekly is to summarize some of the research published to SentimenTrader over the past week. Sometimes there is a lot to digest, and this summary highlights the highest conviction or most compelling ideas we discussed. This is NOT the published research; rather, it pulls out some of the most relevant parts. It includes links to the published research for convenience, and if you don't subscribe to those products, it will present the options for access.