
TradingEdge Weekly for Dec 2 - Drastically improving trends worldwide, stumbling dollar, seasonal tailwinds

Key points:
- Despite an October rally in stocks, investors pulled back on leverage
- They may be regretting it already, as there has been a surge in uptrends in S&P 500 stocks
- Even across the broad NYSE index, more than half of securities are in uptrends
- Uptrends are improving across the globe
- Stocks in the Industrial sector have been doing even better
- Small-cap stocks are now enjoying a compelling seasonal tailwind
- They're also one of the best groups during this part of the election cycle
- Same with small-cap stocks in Germany, with the added benefit of a positive trend
- Stocks in Hong Kong have also joined the global breadth thrust party
- The U.S. dollar keeps sliding
- Unfavorable trends in the dollar are good for emerging market stocks
- There has been a divergence between oil and energy stocks
Despite an October rally, investors pulled back on leverage
We saw in April that stocks tend to fall when investors pile on debt using their securities as collateral and then pull back on their risk appetite.
Debt has continued to recede as investors cover their margin calls by selling stocks or adding additional cash to their accounts. The S&P 500 has declined more than 15% year-over-year using monthly closes through October, but margin debt has plunged more than 30% over the past year.
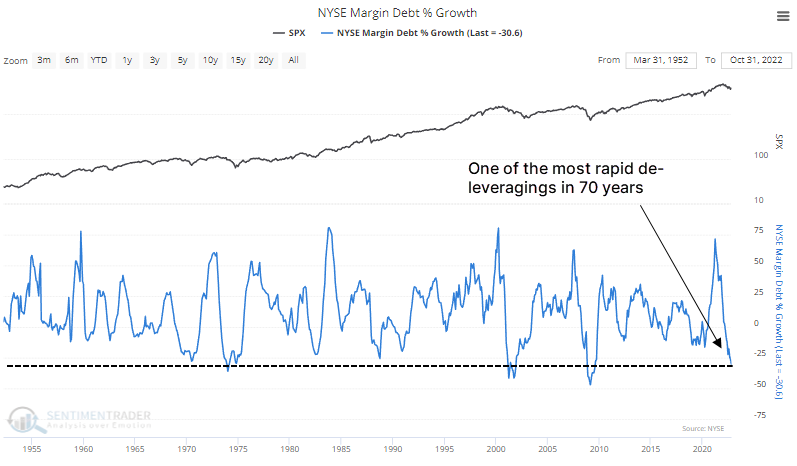
The only other month when the S&P gained more than 7.5% during the month and debt declined by 2% or more was October 1974.
After any month in which the S&P 500 rebounded 3% or more from a one-year low, yet debt continued to fall to a new low, stocks tended to rebound in the months ahead. It wasn't a perfect indicator by any stretch, as it triggered in April 2008 before one of the most gut-wrenching periods in history for equity investors.
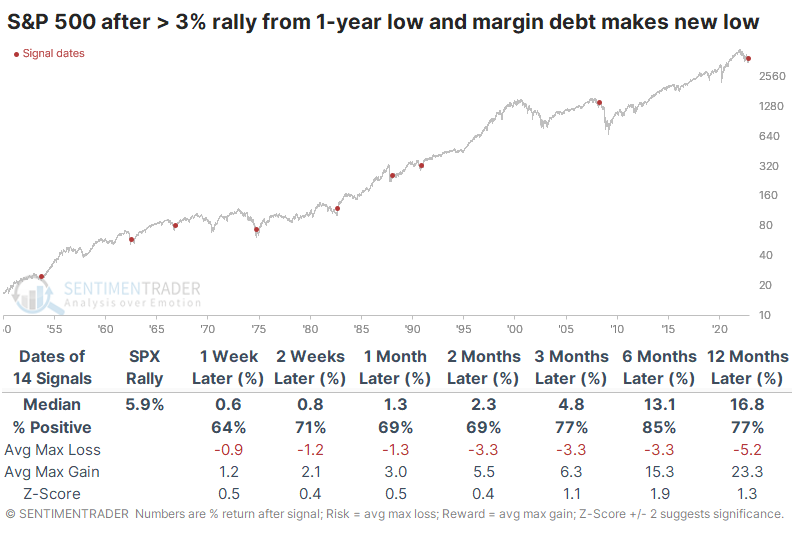
The sample size gets even more uncomfortably small, but when the S&P jumped at least 5% yet debt hit a low, returns were better. Over the next few months, stocks rose every time, and a year later, the S&P averaged a gain of more than 20%.
The rally has been even more impressive under the surface
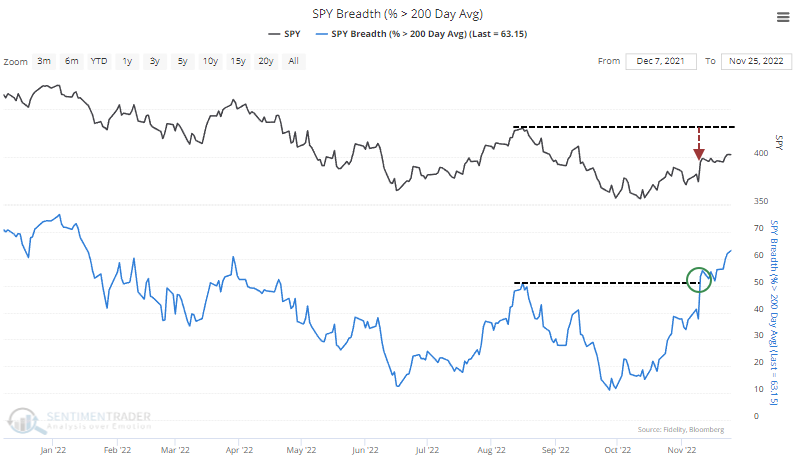
The rally in October continued into November, and there has been a marked divergence between the most benchmarked index in the world and the trends of its underlying stocks.
Earlier in November, the S&P was trading more than 8% below its high of the past six months, while the percentage of its member stocks trading above their 200-day averages reached a new six-month high.
The table below shows every time when the S&P was at least 8% below its six-month high, but the percentage of its members trading above their 200-day average hit a six-month high. Forward returns were good, but a signal in 2000 was a woeful exception.
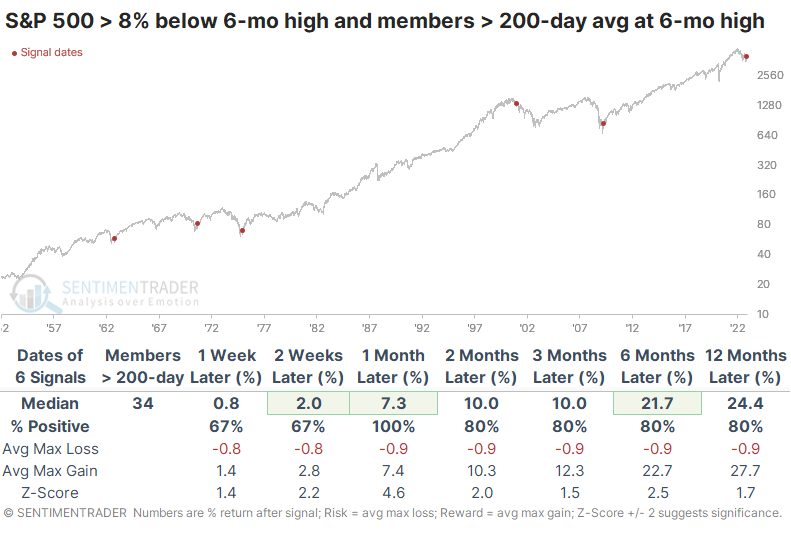
If we relax the parameters, we can generate a larger sample size. Generally, divergences like this tend to resolve in favor of the members and not the index. In other words, internal participation tended to be a better indicator than the index's price action.
It's a modest positive that when this divergence first triggered a couple of weeks ago, stocks didn't fall apart. The S&P has added to its gains, which is not something that occurred in either 2002 or 2008, so it's a small indication that perhaps this time is different than a couple of the worst outcomes.
Another difference with the midst of the last two protracted bear markets is that there has been a tremendous surge in the percentage of stocks trading above their medium-term 50-day moving averages.
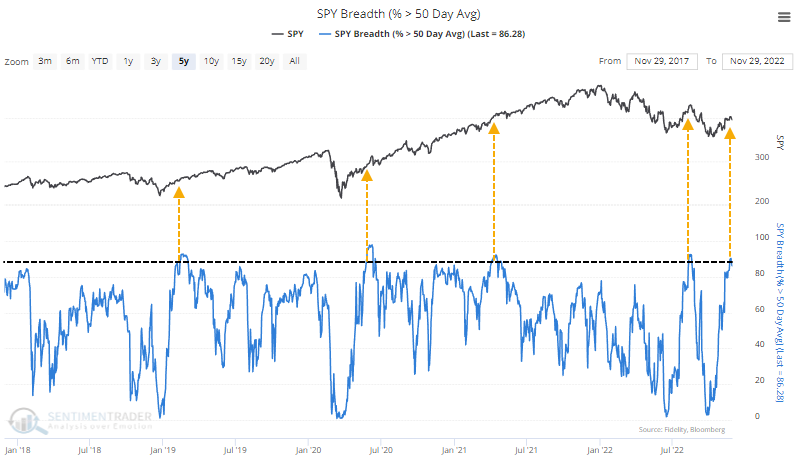
During modern markets, there have been 13 other times when the percentage of S&P 500 members above their averages cycled from fewer than 3% to more than 90%. All of them showed gains 6-12 months later.
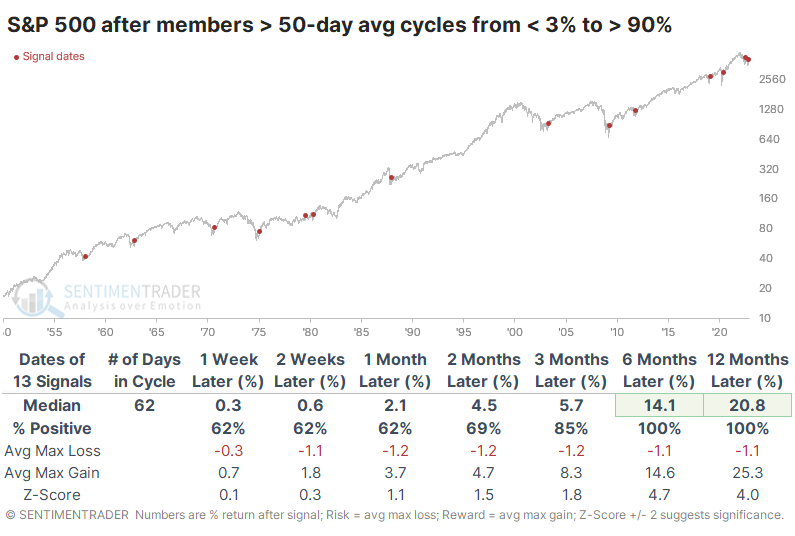
The biggest caveat here is that the last signal was a miserable failure, the worst one in 70 years. It's the only time the S&P lost more than 10% at any point within a year.
Uptrends are spreading even across the broader NYSE universe
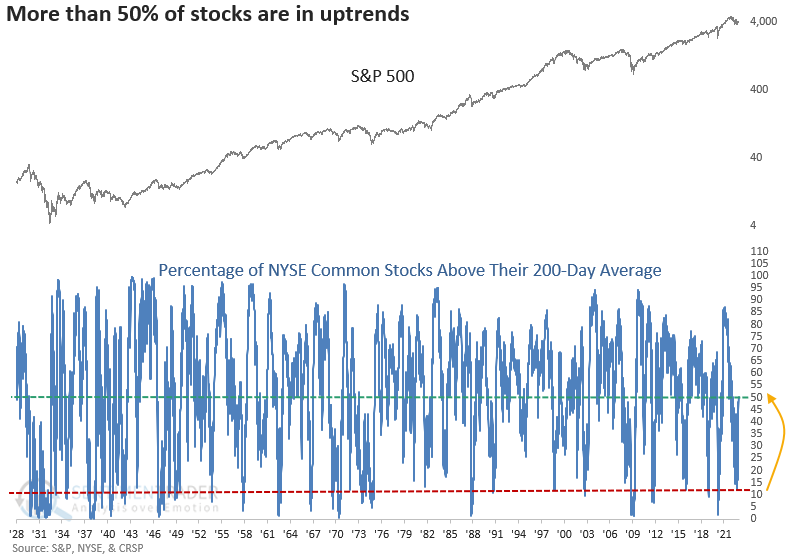
Dean noted that on Thursday, the recovery got even more impressive when the percentage of NYSE common stocks trading above their 200-day moving average exceeded 50%. Keep in mind the NYSE common stock basket contains over 2000 constituents.
The recovery in long-term uptrends occurred after fewer than 13% of members closed above their 200-day average as recently as late September.
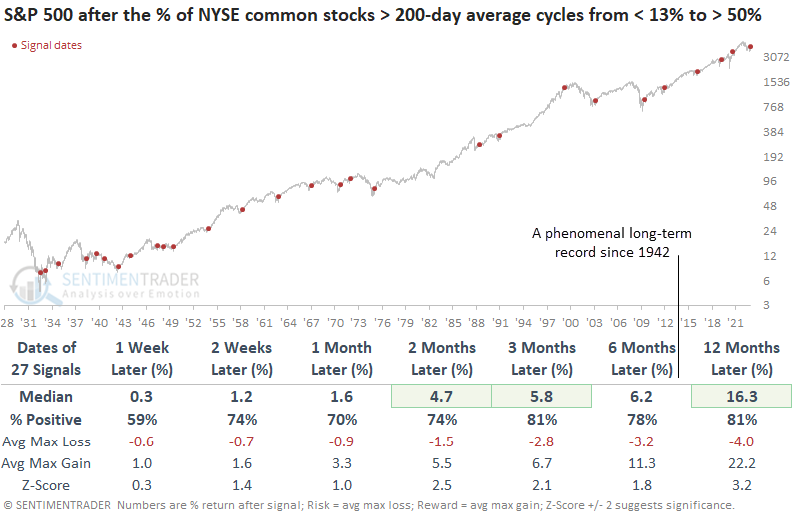
When the percentage of NYSE common stocks above their 200-day average cycles from < 13% to > 50%, returns, win rates, and z-scores were excellent across all time frames. Besides two signals, drawdowns were remarkably low throughout history. Since 1942, the S&P 500 has shown a positive return every time at some point in the next year.
Usually, during extended bear markets, the percentage of stocks above their 200-day moving average will register a series of lower highs and lower lows, similar to stock indexes. However, the recent recovery in long-term uptrends exceeded the previous peak from August. i.e., a higher high. The improvement above the previous high water mark resulted in an 8-month high for the indicator.
The stock market outlook improves further when the percentage of NYSE common stocks above their 200-day average cycles from < 13% to > 50% and the percentage exceeds an 8-month high. The signal has a perfect record a year later since 1942. Once again, drawdowns were minimal.
Uptrends are improving across the globe
We've looked at some sectors and indexes that have had impressive recoveries in medium- and long-term trends lately. It's not restricted to specific sectors, though - entire countries have enjoyed rebounding markets.
In record time, the percentage of major country indexes trading above their 200-day moving averages has cycled from zero to above 75%. As recently as November 3, every global index out of more than twenty was in a downtrend. The rebound over the past few weeks pushed three out of every four back into an uptrend.
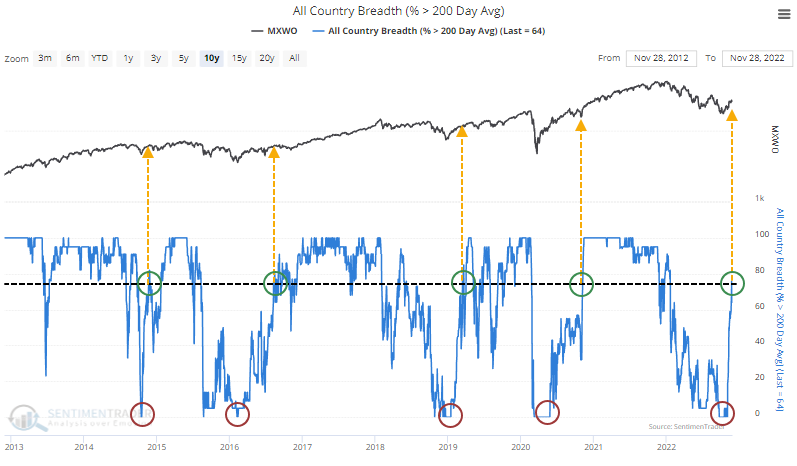
It took only 15 trading days for this recovery to trigger, the quickest cycle in 50 years. The previous record was 18 days in 1977, which wasn't the best time to jump on board, but it also wasn't a disaster by any means.
After similar recoveries, the MSCI World Index tended to suffer short-term profit-taking, but they were good signs of long-term momentum. While the average return and win rates weren't exceptional, risk was low.
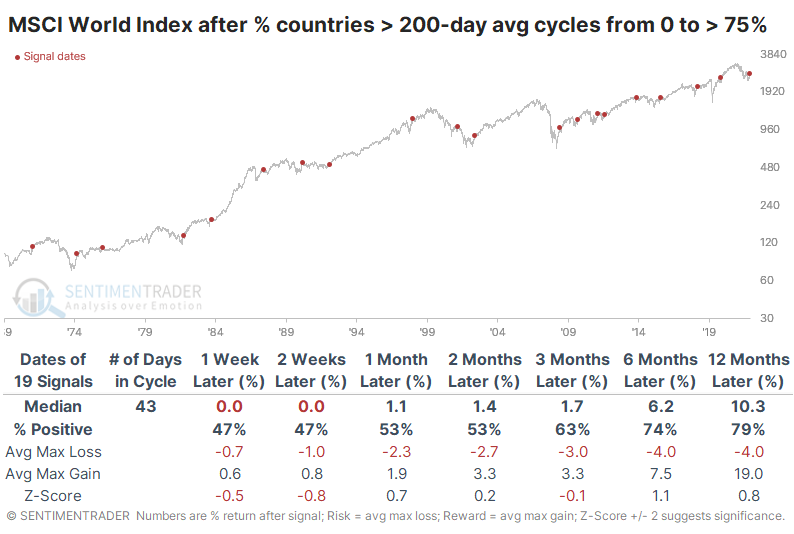
Out of the 19 precedents, there were only 3 with more than a 10% drawdown at any point within the following year. Two of those corrections just barely exceeded -10%.
Industrial stocks are doing even better
We already looked at the surge in Industrial stocks at the end of October as internal momentum surged, and again a couple of weeks later as they entered a positive seasonal window along with other tailwinds.
They've continued to climb, and as of last week, more than 97% of the stocks managed to hold above their 50-day moving averages.
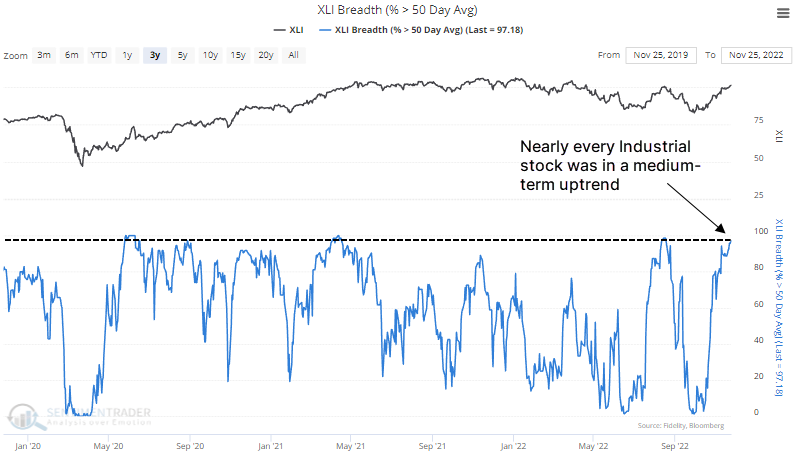
Granted, this happened in early August, and the sector immediately turned tail, which is disturbing. But at no point during the 2001-02 or 2007-08 bear markets did more than 97% of Industrials trade above their 50-day averages.
If we look at the past 70 years, there have been 21 times when fewer than 3% of Industrials traded above their 50-day averages, then a recovery pushed more than 97% of them above their averages. In the six months following these cycles, Industrial stocks showed a positive total return every time. The maximum loss during the next six months averaged only -1.8%, while the sector enjoyed an average maximum gain of 15.5%. The largest six-month drawdown out of all 21 signals was only -6.5%.
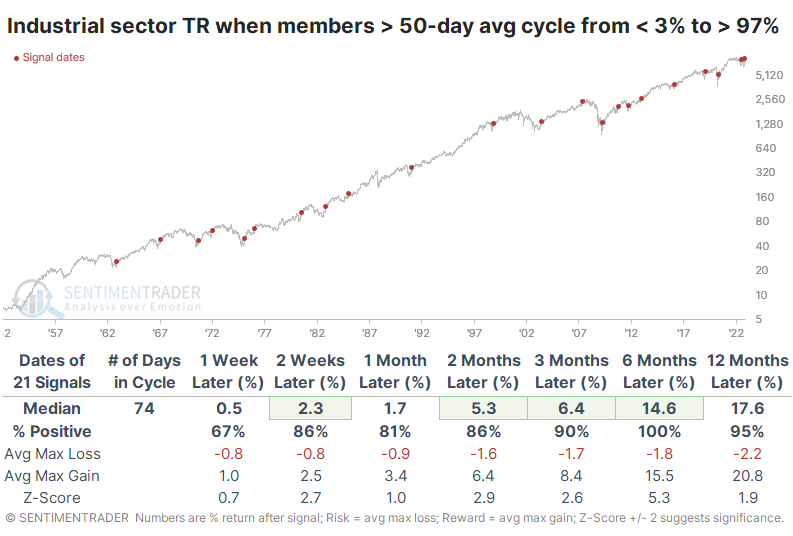
These signals were good for the broader market, too. The S&P 500 (price only, not including dividends) sported only one loss over the next 6-12 months, though it was a notable one.
Small-caps are entering a time with tailwinds
Jay showed that small caps have entered their most favorable seasonal period of the year.
The chart below displays the annual seasonal trend for the Russell 2000 Index, which comprises the 2000 smallest companies (based on cap size) in the Russell 3000 Index.
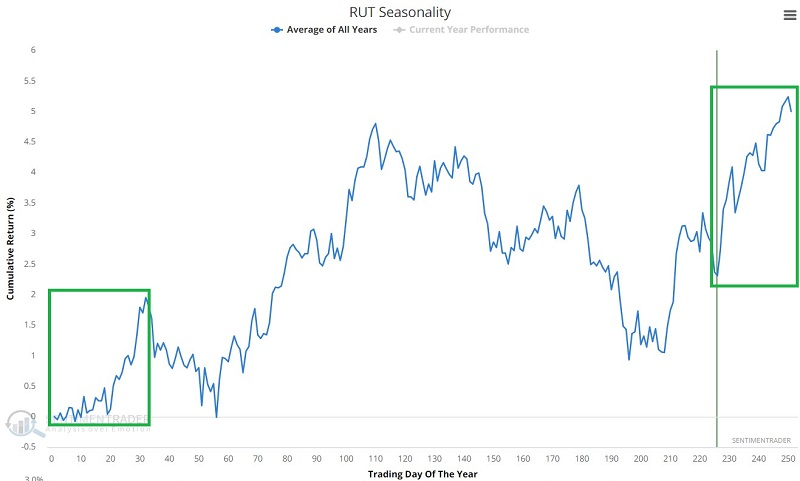
For this piece, we will look at the performance of the Russell 2000 Index itself from TDY #226 through TDY #32 the following year, beginning in 1953. The chart below displays the cumulative % return for the Russell 2000 if held long only during these windows over the last 69 years.
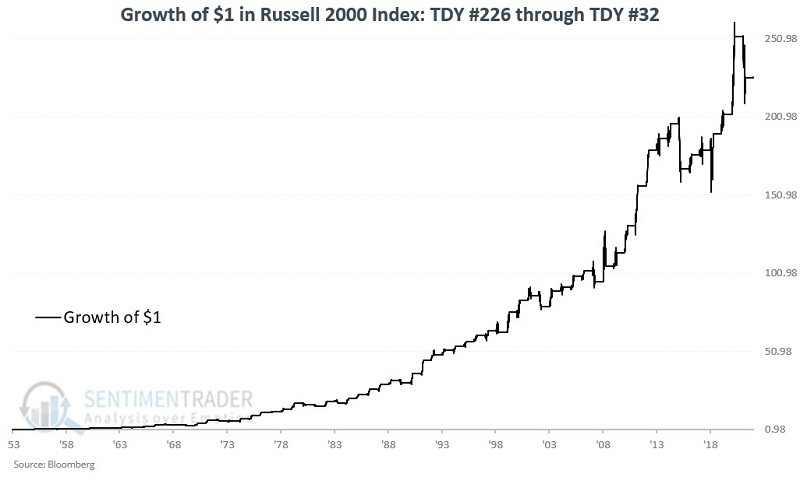
The Russell 2000 Index showed a gain during this seasonal period in roughly 4 out of every five years (81%) over the last 70 years. While there are no guarantees from year to year, that represents a high degree of dependability.
The worst decline was -14.6% in 2016. Not good. Still, there has never been a decline over -15%. On the flip side, the index has shown a gain of over +15% on 20 separate occasions. In essence, when this seasonal period is bad, it's not good, but when it's good, it's terrific.
Discretionary and small-cap stocks during the election cycle
In previous research, Jay highlighted that the most favorable portion - by far - of the four-year election cycle that starts October 1st of the mid-term year and ends July 31st of the pre-election year. Based on the S&P 500 Index, there has not been a loss during this period since the1930's.
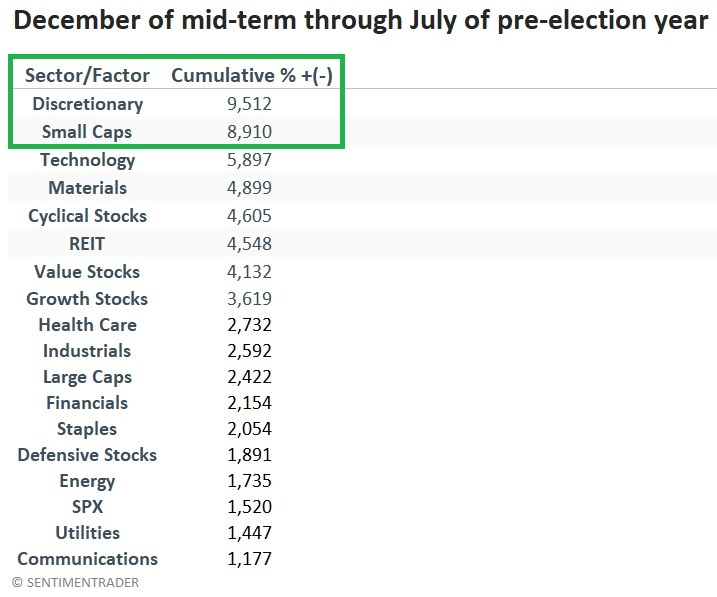
With December beginning, he took a closer look at the sector and factor performance over the last seven months of this favorable period.
For this test, we use the Fama French data set from 1926 to 1991 and S&P 500 indexes and sector data after that. The table below displays the total return for each sector and factor if held only from December 1st of each mid-term year through the end of July each pre-election year, starting with the 1926-1927 period. By far, the two top long-term performers were Consumer Discretionary and Small caps.
The chart below displays the growth of $1 invested in the Consumer Discretionary sector only during the favorable period.
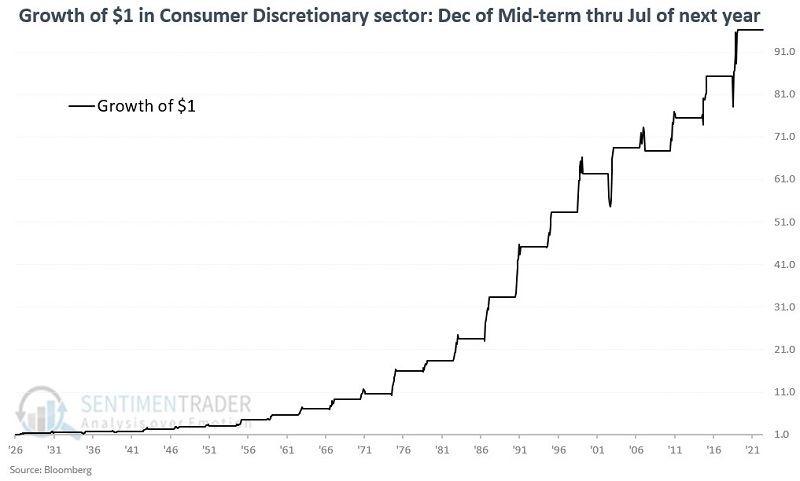
The frustrating thing about seasonal trends is that there is never any guarantee that they will continue to work. That said, the performance for consumer discretionary during this particularly favorable period is hard to quibble with. The largest full-period decline was a loss of -1.6%; on 15 separate occasions, the full-period gain exceeded +15%.
The chart below shows the growth of $1 invested in the small-cap sector only during the favorable period.
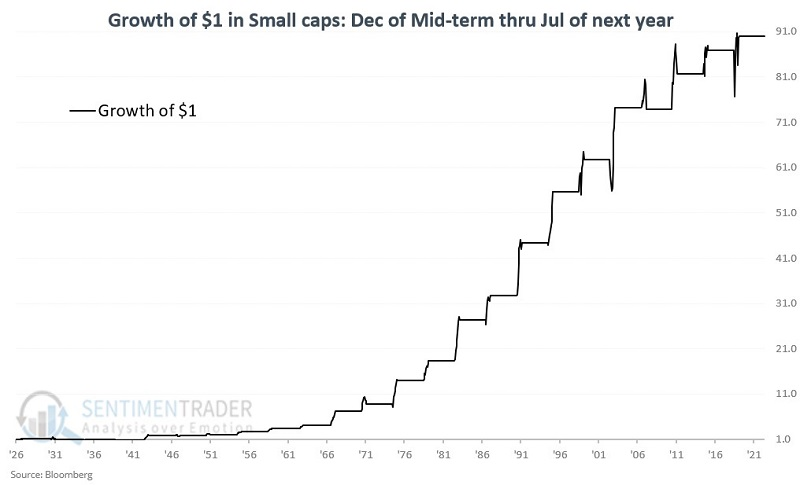
During the favorable period, Small-caps suffered two losses in excess of -15% in the 1930s. Since then, the only down period was a loss of -0.5% in 2006-2007. On 14 separate occasions, Small-caps showed a gain above +15%.
Combining trend and seasonality in German small-caps
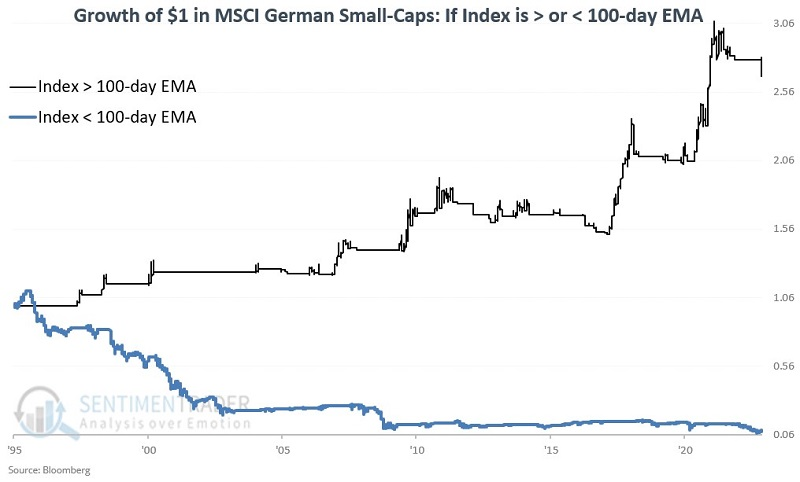
Jay showed that for the first time all year, German small-caps are in a sustained uptrend, defined as trading above their 100-day exponential moving average.
The black line in the chart below shows the growth of $1 invested in the Index only when that market closed the previous day above its 100-day EMA. The blue line shows the growth of $1 invested in the Index only when it closed the last day below its 100-day EMA.
The cumulative gain when price > 100-day EMA was +167.3%. The cumulative decline when price < 100-day EMA was a fairly stunning -90.7%.
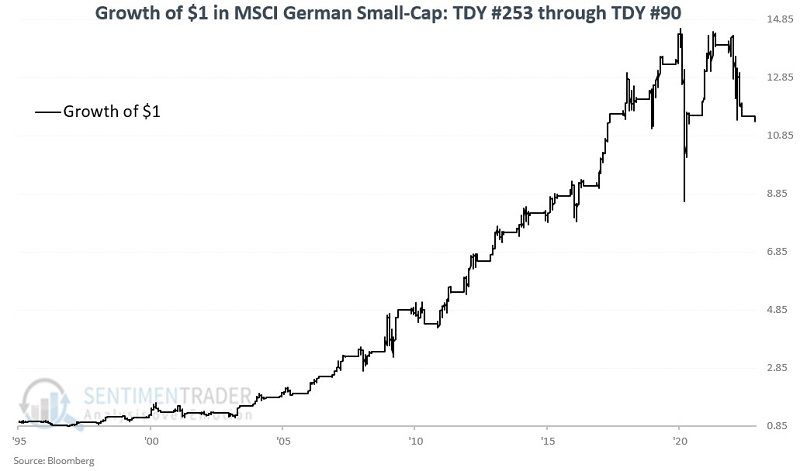
A favorable seasonal period for German small-caps begins at the close of Trading Day of Year (TDY) #253 and extends through TDY #90 the following year. The rest of the year is considered seasonally unfavorable.
The chart below displays the growth of $1 invested in the Index only during these windows since 1994. During this favorable seasonal period, the Index registered a cumulative gain of +1,034%. The next favorable seasonal period will start at the close on December 21.
When BOTH price and seasonal filters are favorable, the cumulative return was +758%. The chart below shows the cumulative growth of $1 invested in the Index only when EITHER price OR seasonal filters are favorable. The cumulative return when either filter is favorable was +2,539%.
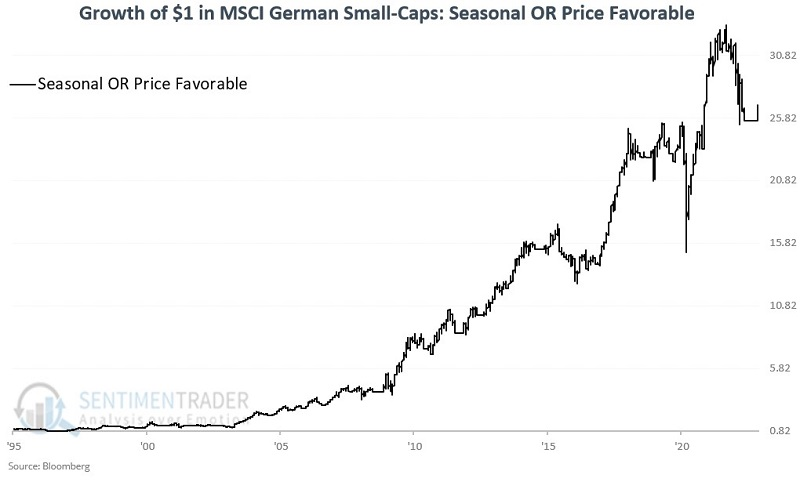
When NEITHER price NOR seasonal filters are favorable, the cumulative return was a staggering -93%. So, with the trend positive for now, and seasonality about to be, this niche sector should benefit.
Hong Kong has joined the global breadth thrusts
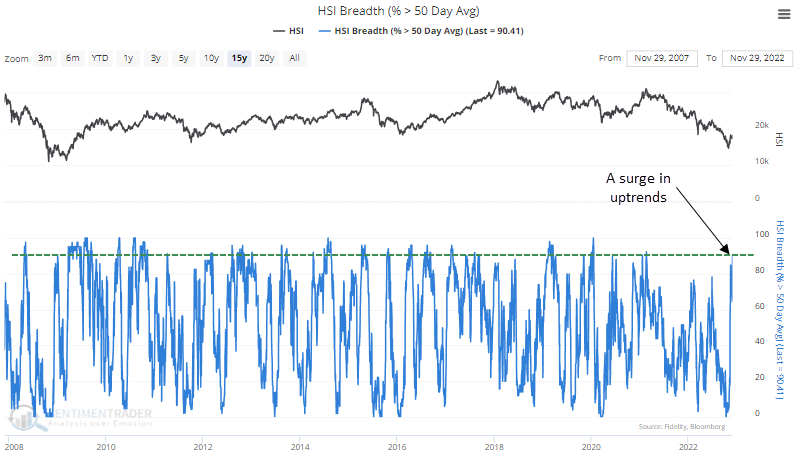
The Hang Seng Index joined the breadth thrust party this week when the percentage of Index members trading above their 50-day average exceeded 90%. Dean noted that the surge in medium-term uptrends represents the highest level of participation from Index members in more than 20 months. And it confirms several other bullish developments for Chinese-based stocks.
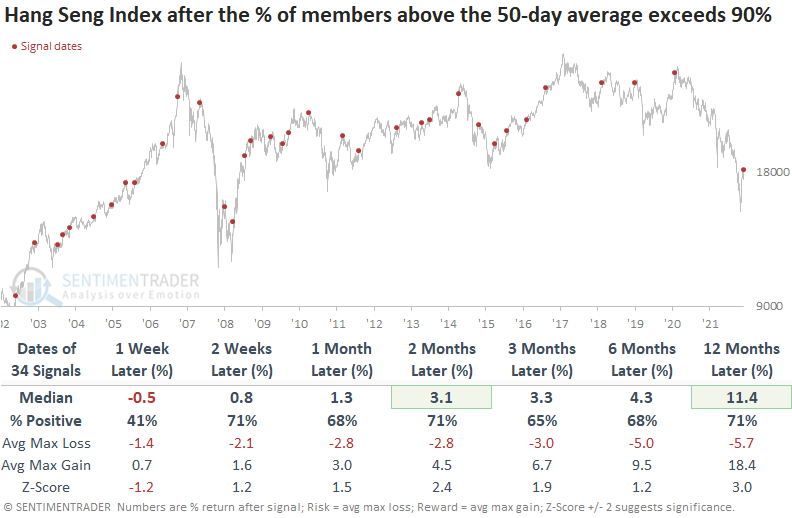
When the percentage of Hang Seng Index members above their 50-day average exceeds 90%, the popular Hong Kong Index tends to rally over most time frames.
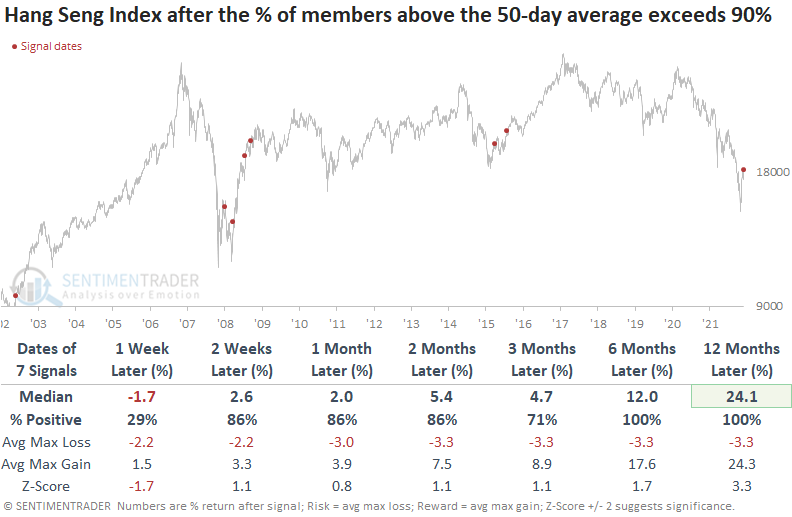
With sentiment as bad as it gets after a 50% drawdown in 22 months, let's isolate signals when the Hang Seng Index was down 20% or more from a multi-year high at the time of the signal. While the 1-week time frame once again shows the Index typically pulls back after the burst in participation, the medium and long-term results were excellent.
The January 2009 signal suffered a significant drawdown. However, the Hang Seng Index remained above the prior October low. Sometimes, the initial breadth thrust signal breaks the downside momentum and sets the stage for a meaningful trend change when a second alert occurs.
The dollar keeps sliding
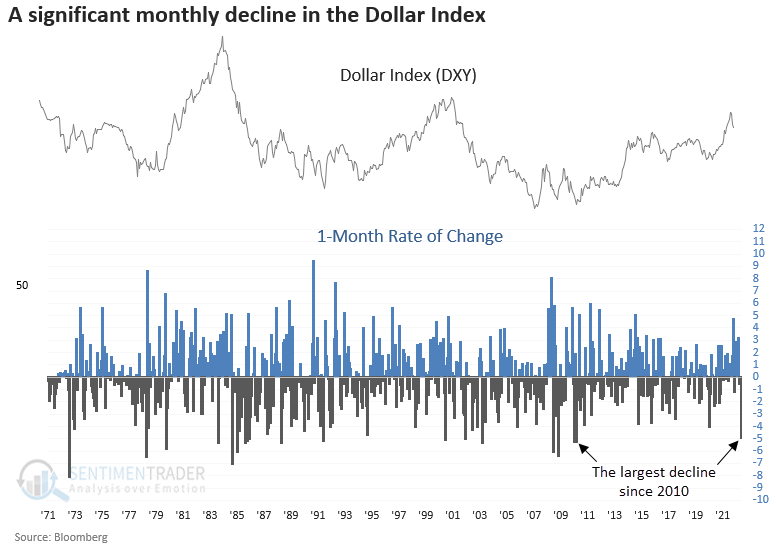
Dean noted that the Dollar Index (DXY) was down over 1% late this week, adding to the swift reversal from a 20-year high. Today's adverse price action comes after the DXY declined by almost 5% in November, representing the most significant monthly decline since 2010.
Could the plunge in the Dollar Index foreshadow a potential trend change or a recession? Unfortunately, we will only know in hindsight. However, we can use history as a guide to provide us with some potential outcomes for the DXY and other asset classes on a go-forward basis.
The Dollar Index tends to decline after it plunges by 4.5% in a month, especially six months later. The signal shows a negative return at some point in the first six months in 17 of 18 cases.
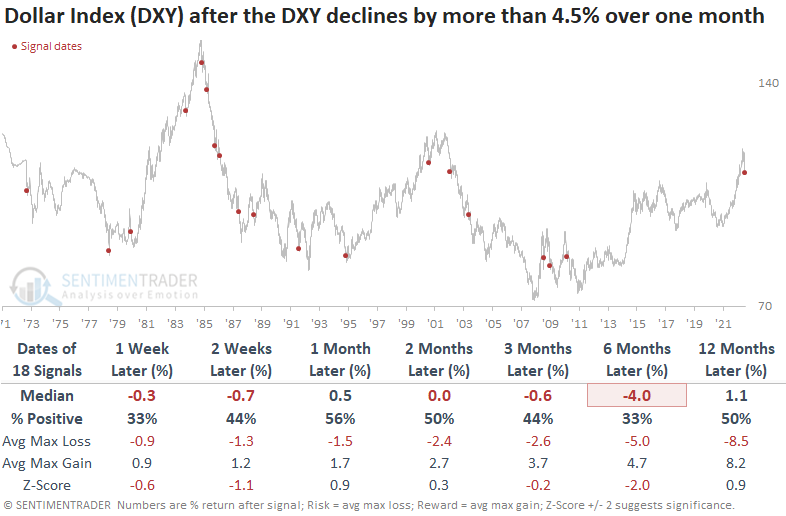
The S&P 500 was slightly negative to flat over the first month. Still, it showed a tendency to recover and post solid returns in six- and 12-month periods. The significant drawdowns a year later all occurred during long-duration bear markets.
The S&P 500 equal-weighted index shows a similar return profile to the cap-weighted version. One notable difference is the performance in the 2000-02 bear market. The average stock performed much better as the cap-weighted index was impacted by Technology. Sound familiar.
Interestingly, large-cap sectors did not benefit as much from the weaker dollar as the all-cap industry groups. i.e., the lower dollar did not benefit large companies with more overseas exposure.
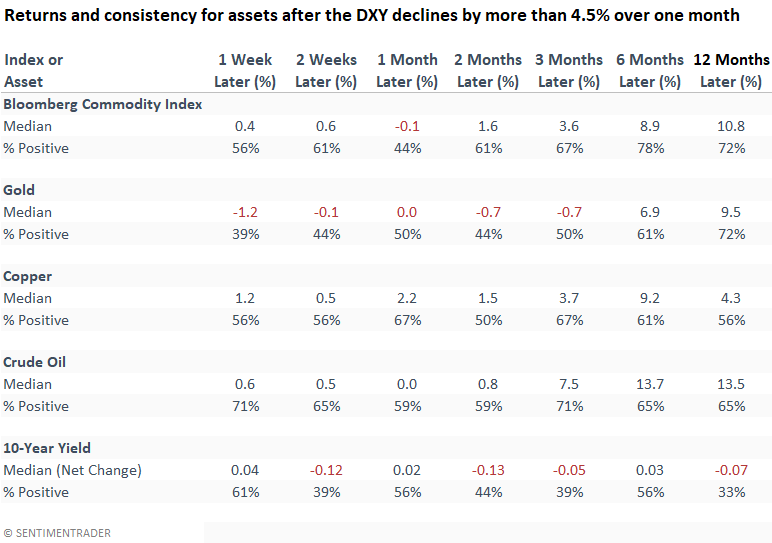
Commodities tend to show an upward bias, with solid results in the six-to-12-month time frames. Interestingly, gold struggles in the first three months. With gold up 8% in November and 3% more today, that could be the case again.
The 10-year yield should decline. However, we must remember that most signals occurred during a secular decline in yields.
A falling dollar and emerging market stocks
Jay showed that emerging markets have been dead money for the last 15 years. The trend of the US Dollar can help assess the prospects for emerging markets, namely when moving averages on the dollar were unfavorable, it preceded good gains for emerging markets.
First, our baseline results since 1988 for the MSCI Emerging Markets Index:
- Buy-and-hold = +622%
- Long only when MSCI Emerging Markets Index 5-week moving average > 30-week moving average = +828%
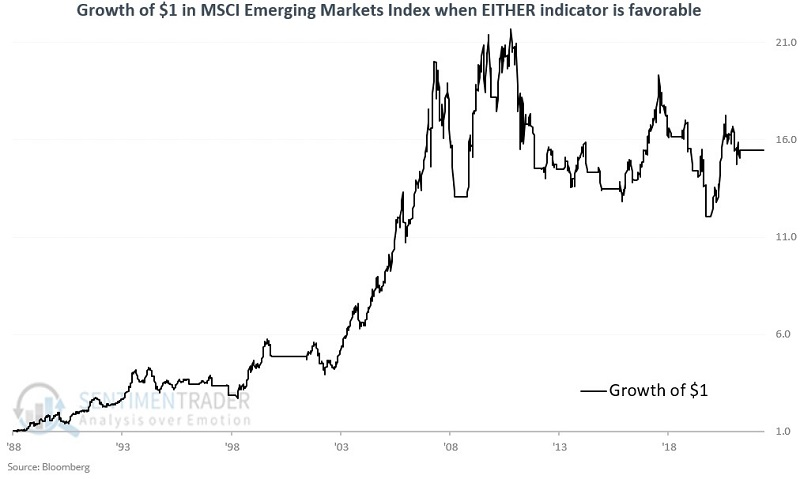
Below, we can see the growth of $1 invested in the index only when either the Emerging Markets Index is in an uptrend (5-week MA > 30-week MA) OR the US Dollar Index is in a downtrend (5-week MA < 30-week MA). In other words, as long as either index is in a favorable trend, we will hold Emerging Markets.
The chart below shows the growth of $1 invested in emerging markets only when the index is in a downtrend AND the US Dollar Index is in an uptrend - the worst of both worlds.
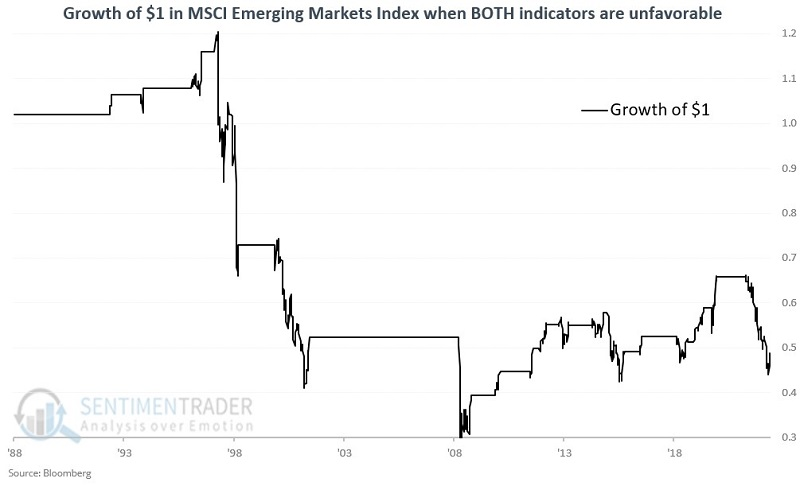
Investors who attempted to play the Emerging Markets sector in the past 44 years could have avoided a lot of grief and aggravation by simply monitoring price trends for the MSCI Emerging Markets Index and the US Dollar.
If either trend filter was favorable, emerging markets returned +1,444%, but if both were unfavorable, that turned into a loss of 53%.
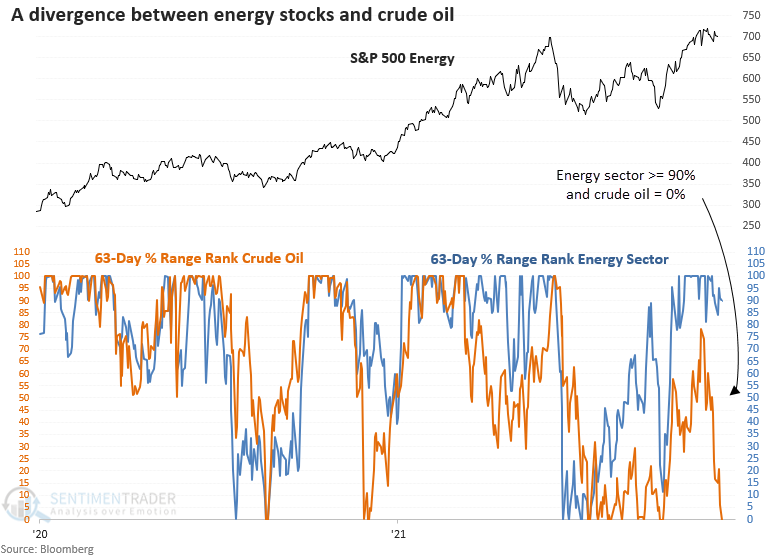
Oil vs. energy stocks
Dean noted that the energy sector is near the upper end of its recent range, with crude oil at the bottom of its range. After similar divergences, energy stocks weakened in the near term.
Crude oil closed at a new 63-day low last week and is now more than 38% below its 252-day high. At the same time, the S&P 500 energy sector closed less than 3% below its 252-day high.
A divergence between the energy sector and crude oil of this magnitude is rare, with the last instance occurring over a decade ago.
When the energy sector ignores the deterioration in crude oil prices, energy stocks tend to weaken in the near term. The catch-down in the energy sector appears to be nothing more than a consolidation within an uptrend, with one notable exception. The 1997-98 Asian contagion period led to a broad trading range.
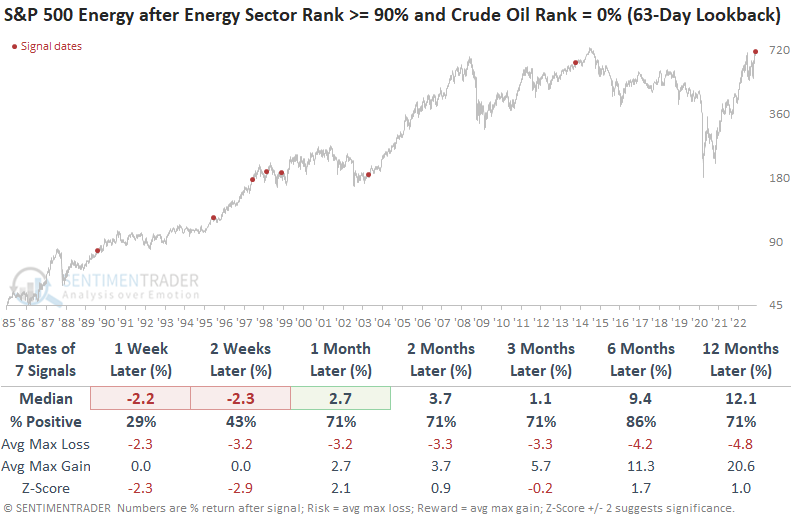
The weak price trend backdrop for crude oil tends to accelerate further to the downside in the near term, especially two weeks later. As with the energy sector, oil tends to rebound with solid results two months later.
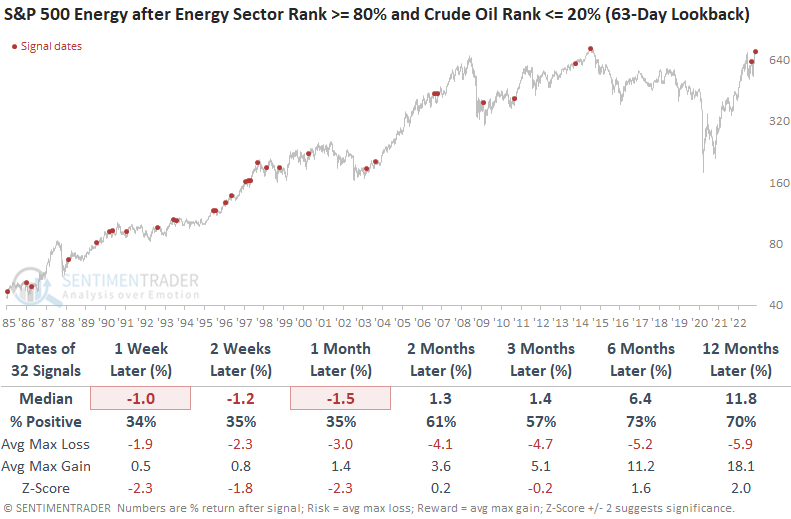
Let's expand the sample size by adjusting the parameters to capture signals with a range rank of >= 80% and <= 20% over the last 63 days. The relaxed parameters provide a similar message; energy stocks could weaken over the next month.
About TradingEdge Weekly...
The goal of TradingEdge Weekly is to summarize some of the research published to SentimenTrader over the past week. Sometimes there is a lot to digest and this summary is meant to highlight the highest conviction or most compelling ideas we discussed. This is NOT the full research that's published, rather it pulls out some of the most relevant parts. It includes links to the published research for convenience; if you don't subscribe to those products it will present the options for access.