
TradingEdge Weekly for Dec 13 - Extended trends, semi signs, high-yield caution

Key points:
- Tech's relative trends are improving
- Three of the "four horsemen" of equity indices have extended trends while breadth is weakening
- Economic and consumer sentiment is recovering
- The next couple of months tend to favor small cap stocks over large caps
- A way to use semiconductors to gauge stocks' attractiveness
- High-yield bonds are divergening from the stock market
- Using an index of credit default swaps as a trend-following tool for stocks
Better relative performance for tech
The Nasdaq 100's relative trend score climbed to eight, aligning with a favorable trend score. Dean showed that similar trend score profiles saw the NDX 100 rally 78% of the time over the next two months.
After falling to a reading of one in the last week of November, the relative trend score for the Nasdaq 100 surged by seven points, the most significant week-over-week increase in history. The boost pushed the overall composite score to eight, aligning it with a favorable trend score of ten.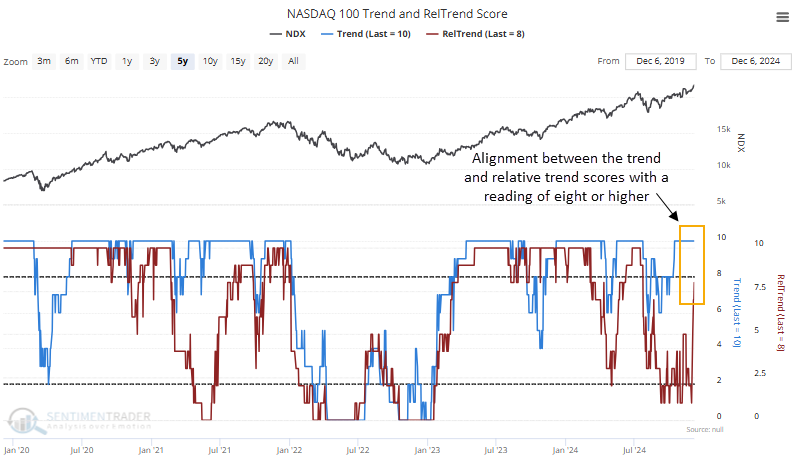
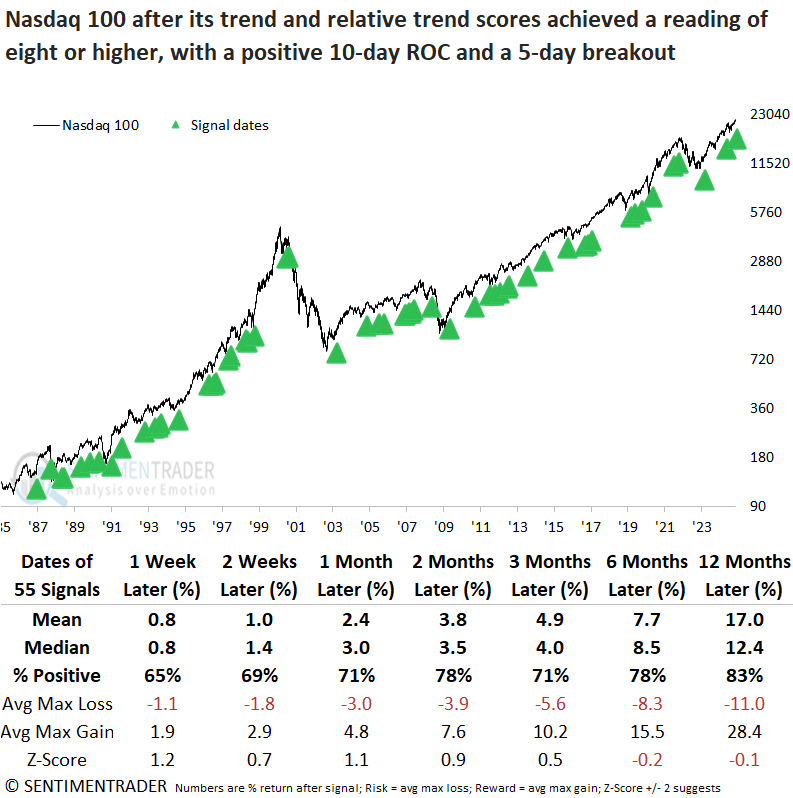
When both trend and relative trend indicators maintained scores of eight or higher, coupled with positive momentum and a short-term breakout, the tech-heavy index rallied 78% of the time over the next two months. The only drawback, if it can even be considered one, is that none of the time frames showed statistical significance.
Comparing the Nasdaq 100 to the S&P 500 reveals that the tech-focused index has consistently outperformed the broader benchmark, achieving a 69% win rate over the subsequent two months.
The 5-day net change in the relative trend score composite for the Nasdaq 100 surged by seven points, a scenario that has never occurred since the index was created. When the 5-day net change for the Nasdaq 100's relative trend score surged by five points or more, it produced solid returns and consistency for the Nasdaq 100 over all time frames, especially a year later, with the index rising 100% of the time.
A worry is that the long-term trend is long in the tooth
Last week, we saw that the "four horsemen" indices are extended. Those trends only considered price, not time. So, let's rectify that and see if it clarifies the picture at all. If a trend can persist, instead of just jumping fast and flaming out, then perhaps it's more likely to last.
We're going to round to the nearest round number. The S&P 500 just reached 540 trading days since its last 252-day low. That's among the longer streaks, though it has lasted far longer between new lows. The only trends when the S&P was within 1% of a record high at 540 days after a low were August 1925, November 1992, and November 2013. It added to its gains after all three.
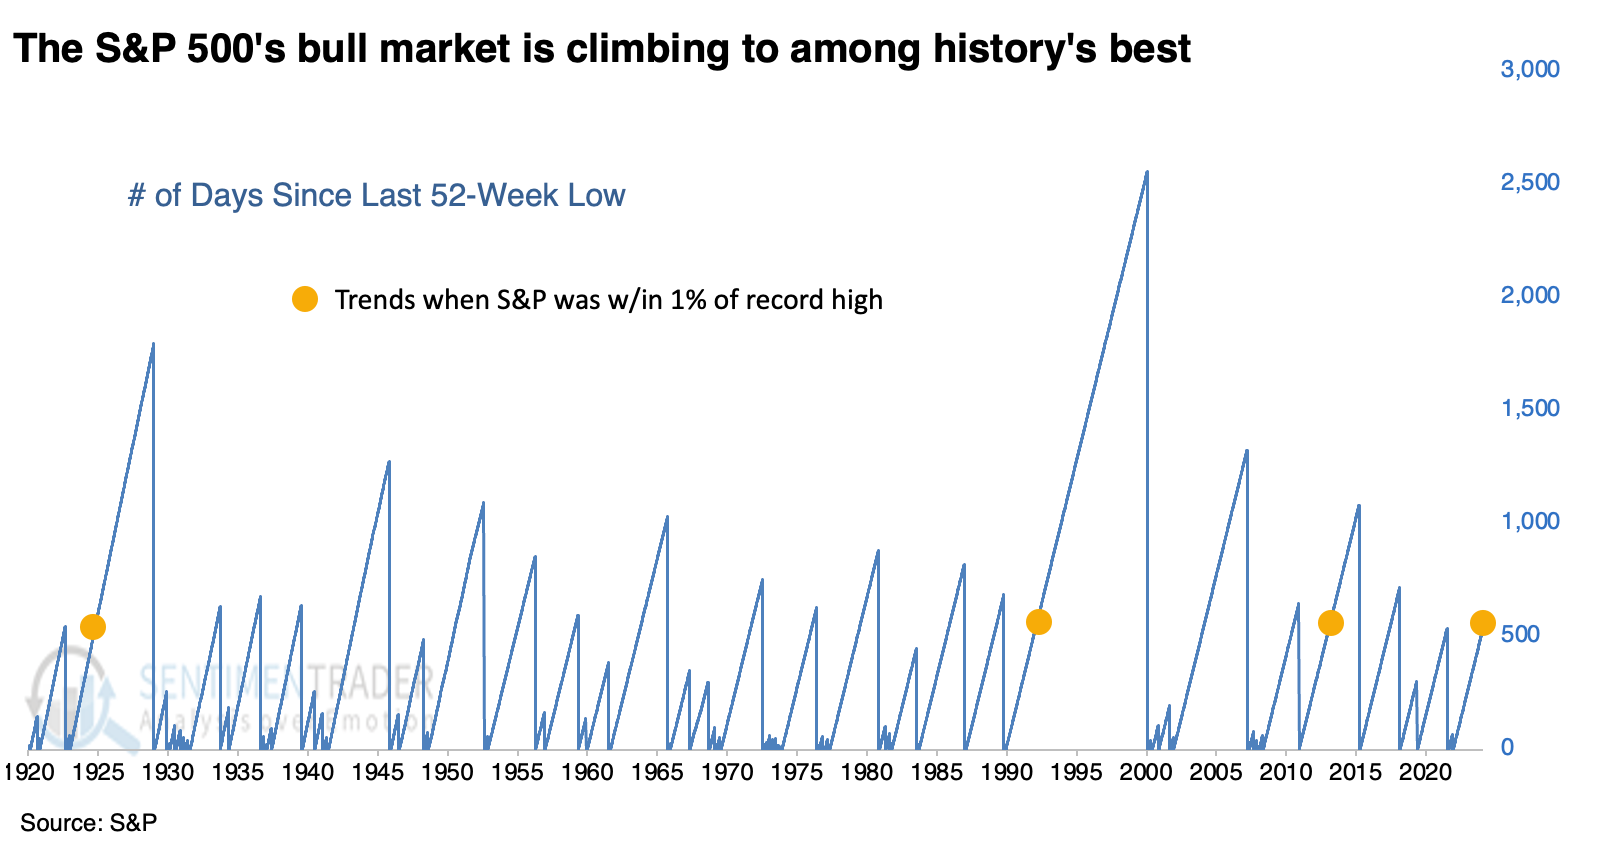
When the S&P hit 540 days since a low and was within 5% of a record high, its returns going forward were good, especially over the following month. But in the months following, returns were inconsistent and meandered around random.
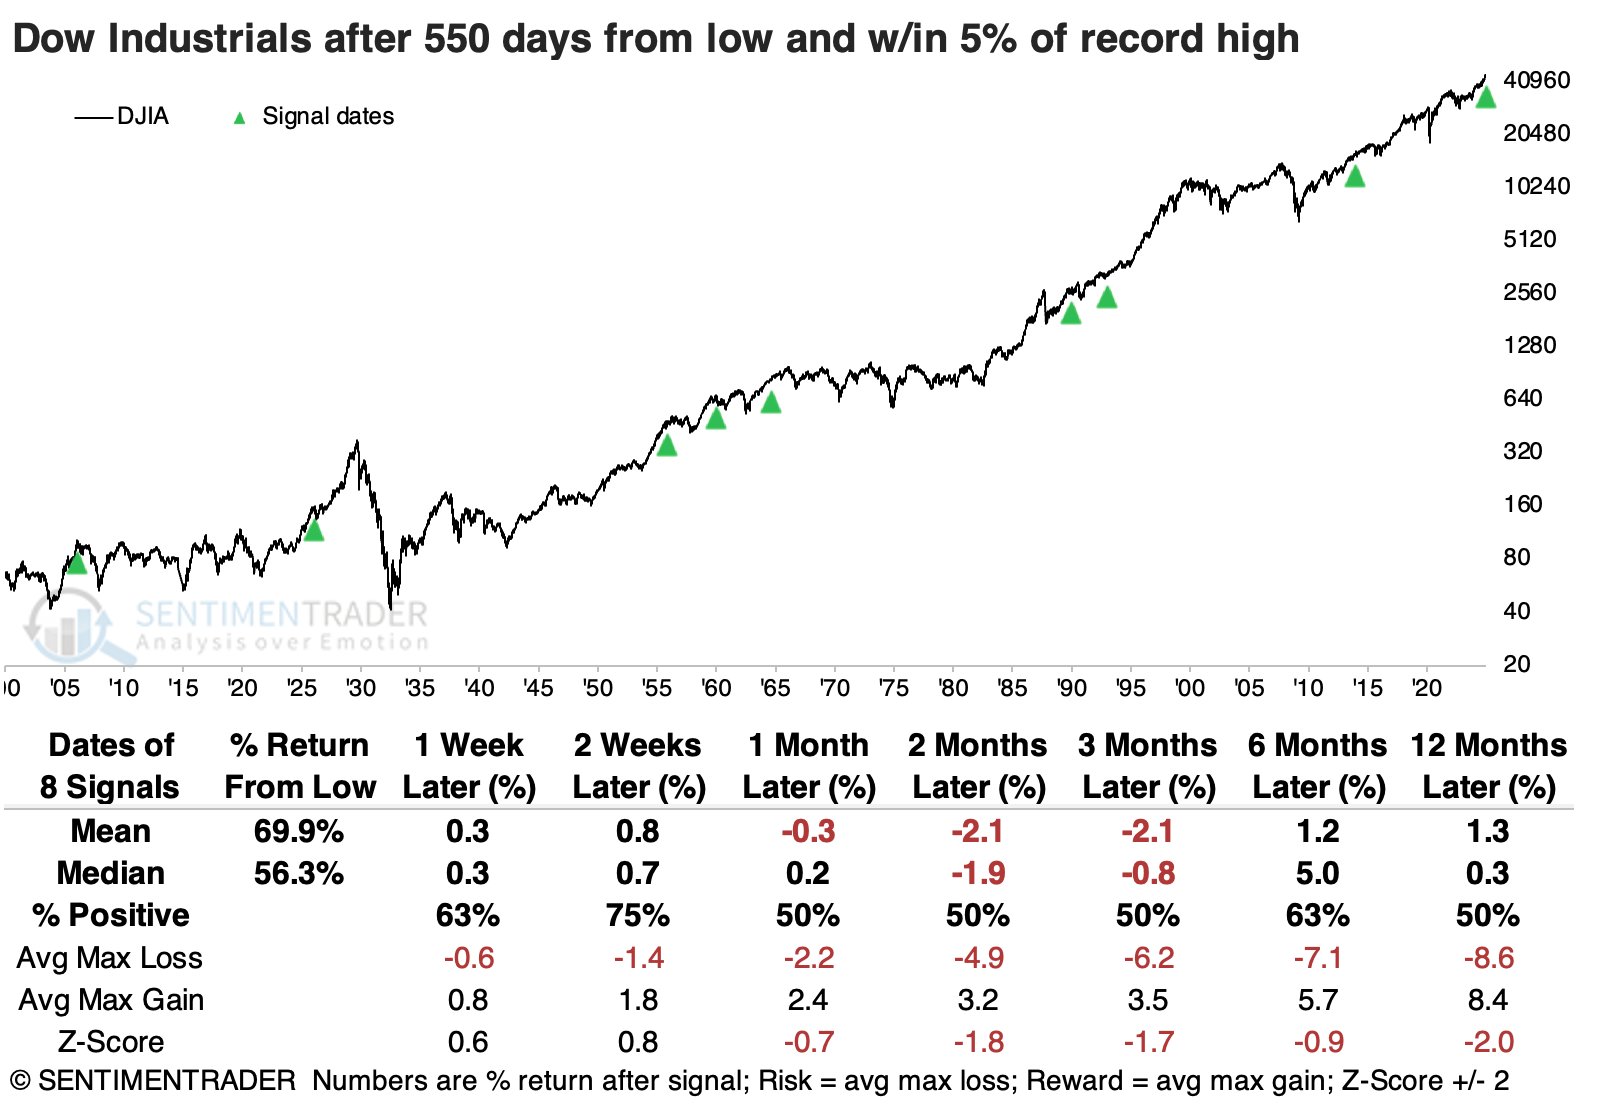
The Dow Industrials has lasted 550 days since its last 252-day low. We can see below that the Dow showed mediocre returns over the medium term following similar strong and persistent trends. All but two signals showed a negative return between one and three months later.
 The Nasdaq Composite has gone 480 days since its last low. Only four other times did the Composite last this long since a low and was within 5% of a record high. Unfortunately for bulls, every single one witnessed losses in the index over the next few months.
Oddly, despite the indices holding up well over the past week, breadth has been negative for the past seven days. Within the S&P 500, the past seven sessions all saw more declining stocks than advancing ones. In the past 25 years, this has only happened twice before when SPY was within 3% of a multi-year high. And those precedents were...ick.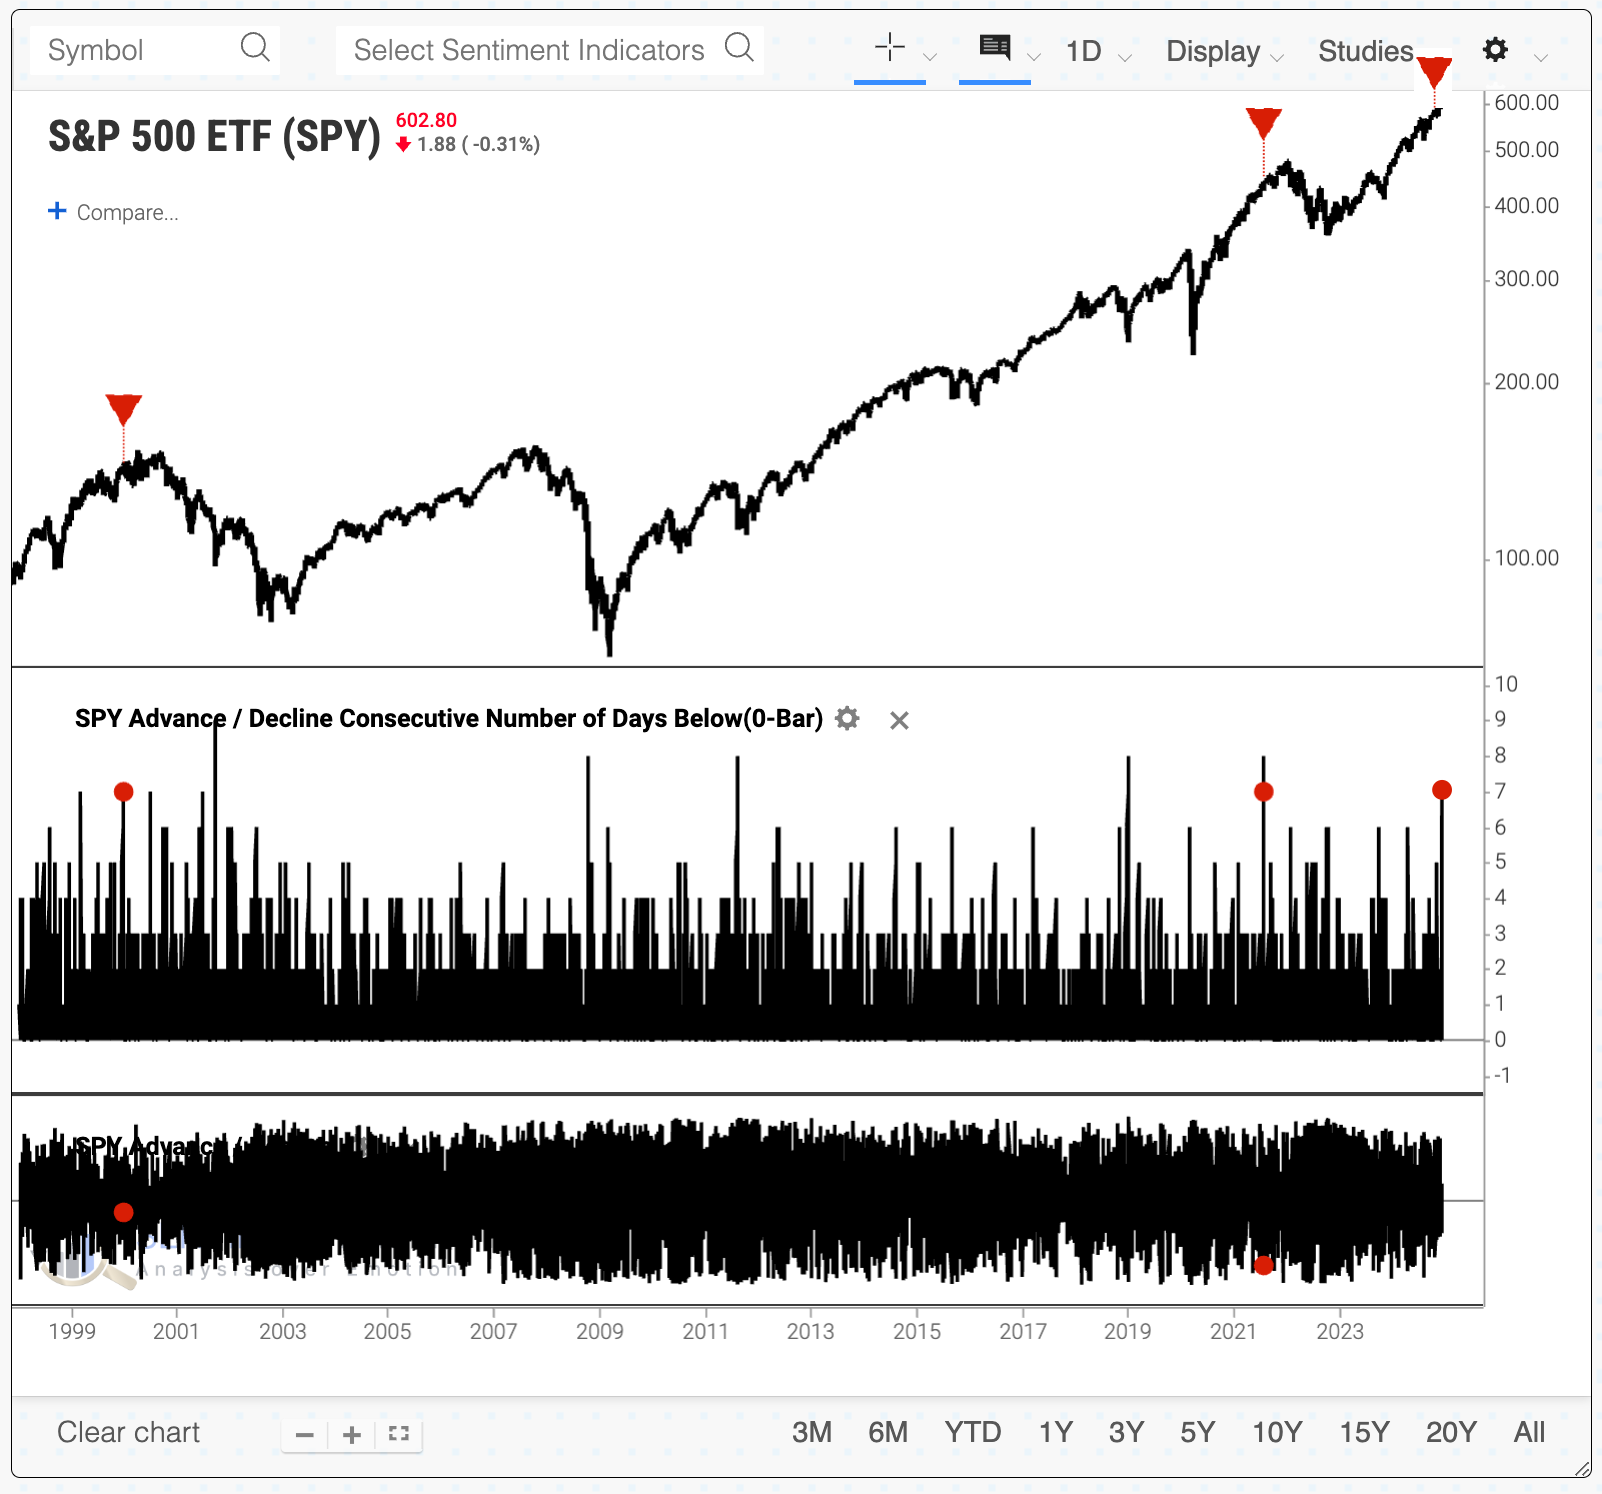 This is also an unusual setup when the equal-weight version of the S&P 500 is hovering within 3% of a multi-year high. Over the next 1-2 weeks, the equal-weight S&P rallied only 18% of the time. If we expand the sample to look for any 7-day negative breadth streak while the equal-weight S&P was trading above its 200-day moving average, we get a large number of precedents. However, with 31 signals, only 39% witnessed a rally over the next few weeks.
Economic and consumer sentiment is improving
An economic and consumer sentiment composite surged over the last three months. Dean noted that similar upticks in survey-based optimism suggest the uptrend in the S&P 500 will persist.
As the chart below depicts, an economic and consumer sentiment composite of 8 surveys shifted upward after languishing in pessimistic territory frequently associated with recessions amidst challenges like inflation and Fed policy that soured sentiment.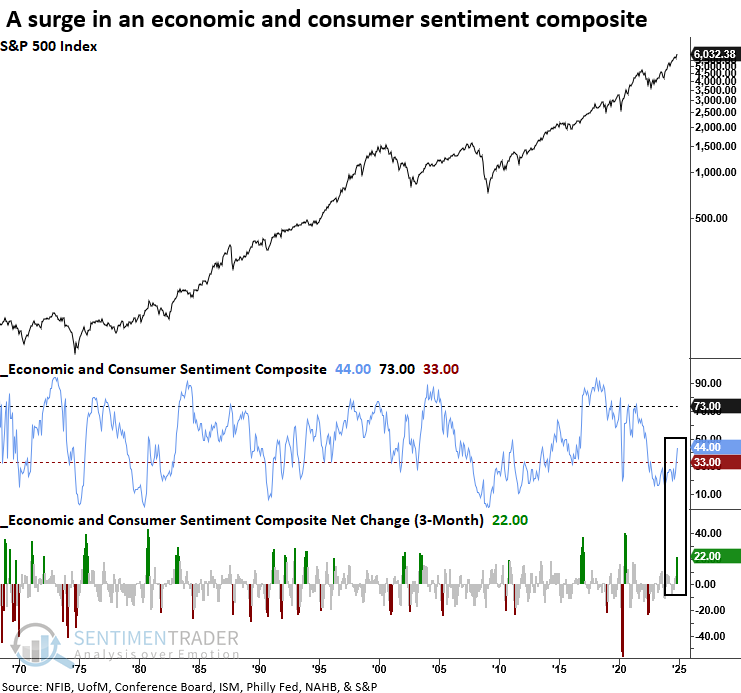
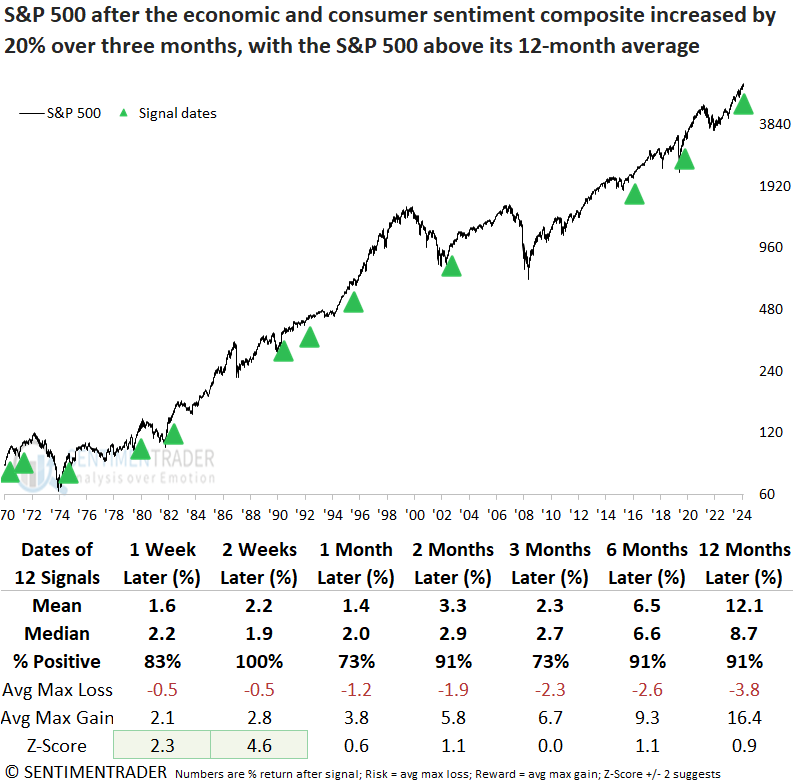
Whenever the economic and consumer sentiment composite increased by over 20% in three months, and the S&P 500 exceeded its 12-month average, the surge in optimism from surveys across a broad range of the economy provided a favorable tailwind for stocks. Although most signals occurred as stocks emerged from a bear market linked to an economic contraction, 1996 and 2016 offer compelling comparisons.
Unsurprisingly, an uptick in sentiment regarding the economy and consumers provided a more compelling case for owning cyclical sectors over defensive groups.
Transitioning into a bear market accompanied by a recession typically requires widespread optimism from investors and business cycle surveys. At present, only investor sentiment reflects such optimism.
A good time for smaller stocks
Jay showed a particular window from mid-December into mid-February that has tended to witness outperformance by small-cap stocks, while large-cap stocks have historically dominated the rest of the year.
- Period #1 extends from the close on the 11th trading day of December through the close on the 11th trading day of February. This period tends to favor small-caps. $1 in small caps grew to $211 (+20,994%), versus $1 in large caps, which increased to $10.59 (+959%).
- Period #2 extends from the close on the 11th trading day of February through the close on the 11th trading day of December. This period tends to favor large caps. $1 in small caps grew to $17.38 (+1,638%), while $1 in large caps increased to $358.86 (+35,786%).
Let's examine a strategy that holds small-cap stocks during the Dec TDM #11 through Feb TDM #11 period and large-cap stocks Feb TDM #11 through Dec TDM #11 starting in December 1945.
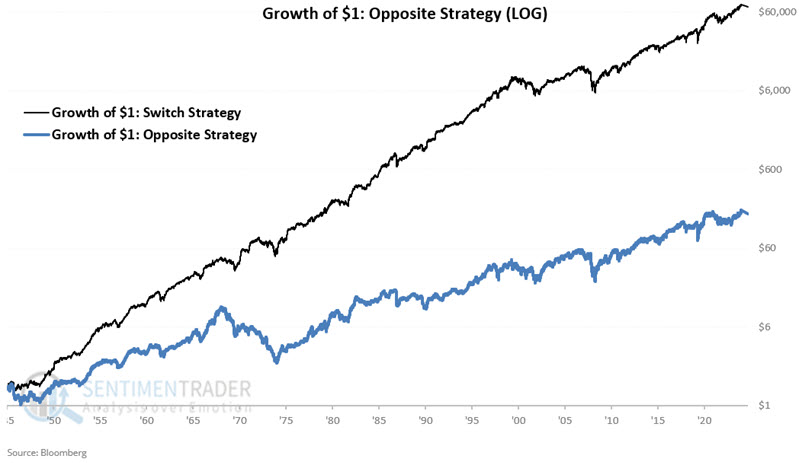
Jay also looked at a strategy that would do the exact opposite. $1 invested in the Switching Strategy grew to $75,700 while $1 invested in the Opposite Strategy grew to only $184. Owning small-caps from mid-December to mid-February and large-caps the rest of the year produced over 400 times the profit of doing the opposite.
The chart below displays the hypothetical growth of $1 using the Switching Strategy.
The table below displays the performance of the Switching Strategy versus the Opposite Strategy, measuring one year's results at the close on the 11th trading day of December each year.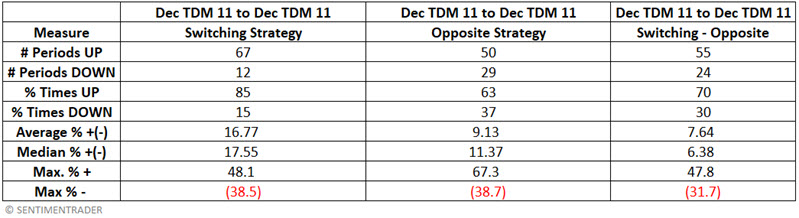
The Switching Strategy showed a gain 85% of the time (versus 63% for the Opposite Strategy) and outperformed the Opposite Strategy 70% of the time. It showed a Median Gain of +17.55% versus 11.37% for the Opposite Strategy.
Semis as a bellwether
The semiconductor sector is considered by many to be a bellwether for the overall stock market. Jay put that theory to the test.
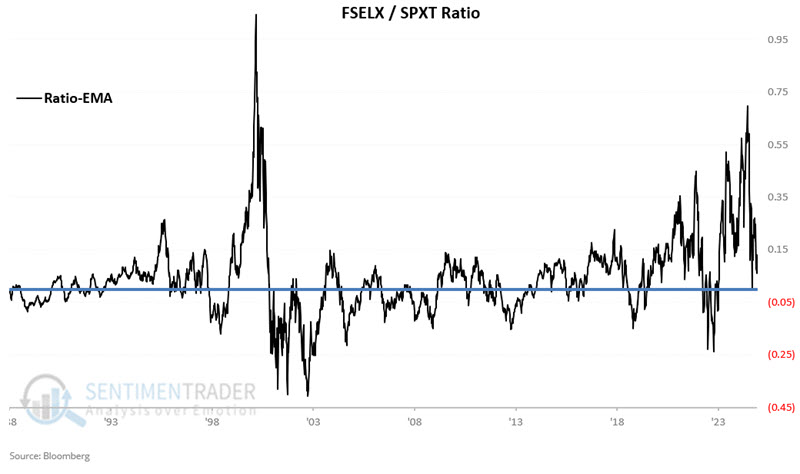
Our operating theory for this test is that the S&P 500 index should perform better when the semiconductor sector outperforms it than when the semiconductor sector underperforms it. For our test, we will use weekly total return data for the S&P 500 Index (SPXT) and the Fidelity Electronics Select Sector mutual fund (FSELX) starting on 1988-01-08.
For the text, we will use a 78-week (1.5 year) exponential moving average of the FSELX/SPXT ratio. If the ratio is above its average, it will be deemed favorable; otherwise, unfavorable.
The chart below displays the hypothetical growth of $1 invested in SPXT only when the ratio is above its trend. The hypothetical net gain since 1988, when this indicator is deemed favorable, is +3,184%. As importantly, note the lack of prolonged and deep bear market declines.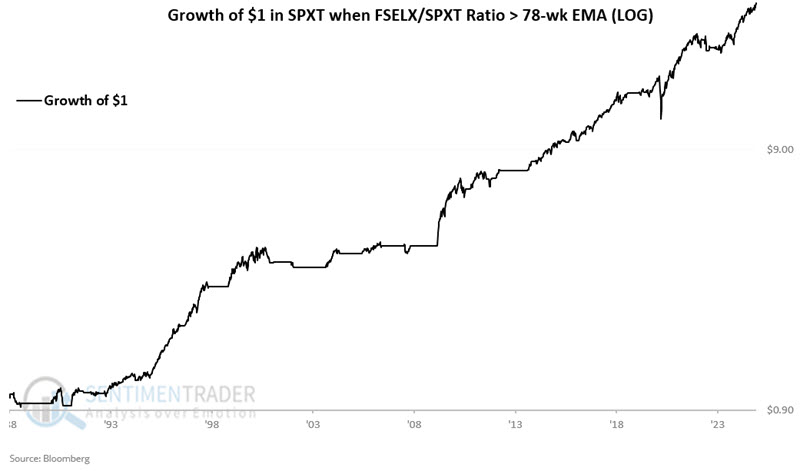 The chart below displays the hypothetical growth of $1 invested in SPXT only when the ratio's trend is negative. It showed a gain of 67% since 1988. So, it would be technically incorrect to deem this "bearish." That said, no new money has been made since 1991.
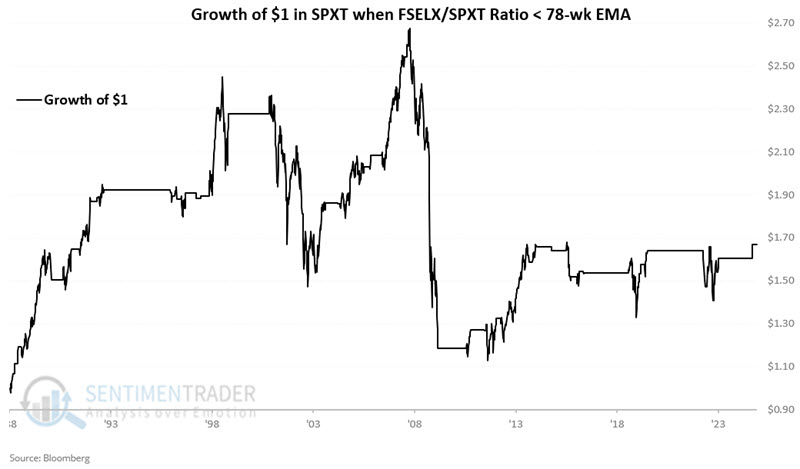 Three favorable periods have had drawdowns greater than -15% and a maximum drawdown (during the COVID selloff in 2020) of -31.7%. At their worst, unfavorable periods suffered a maximum drawdown of -57.8%.
The ratio is still favorable for now, but is plunging rapidly toward its moving average.
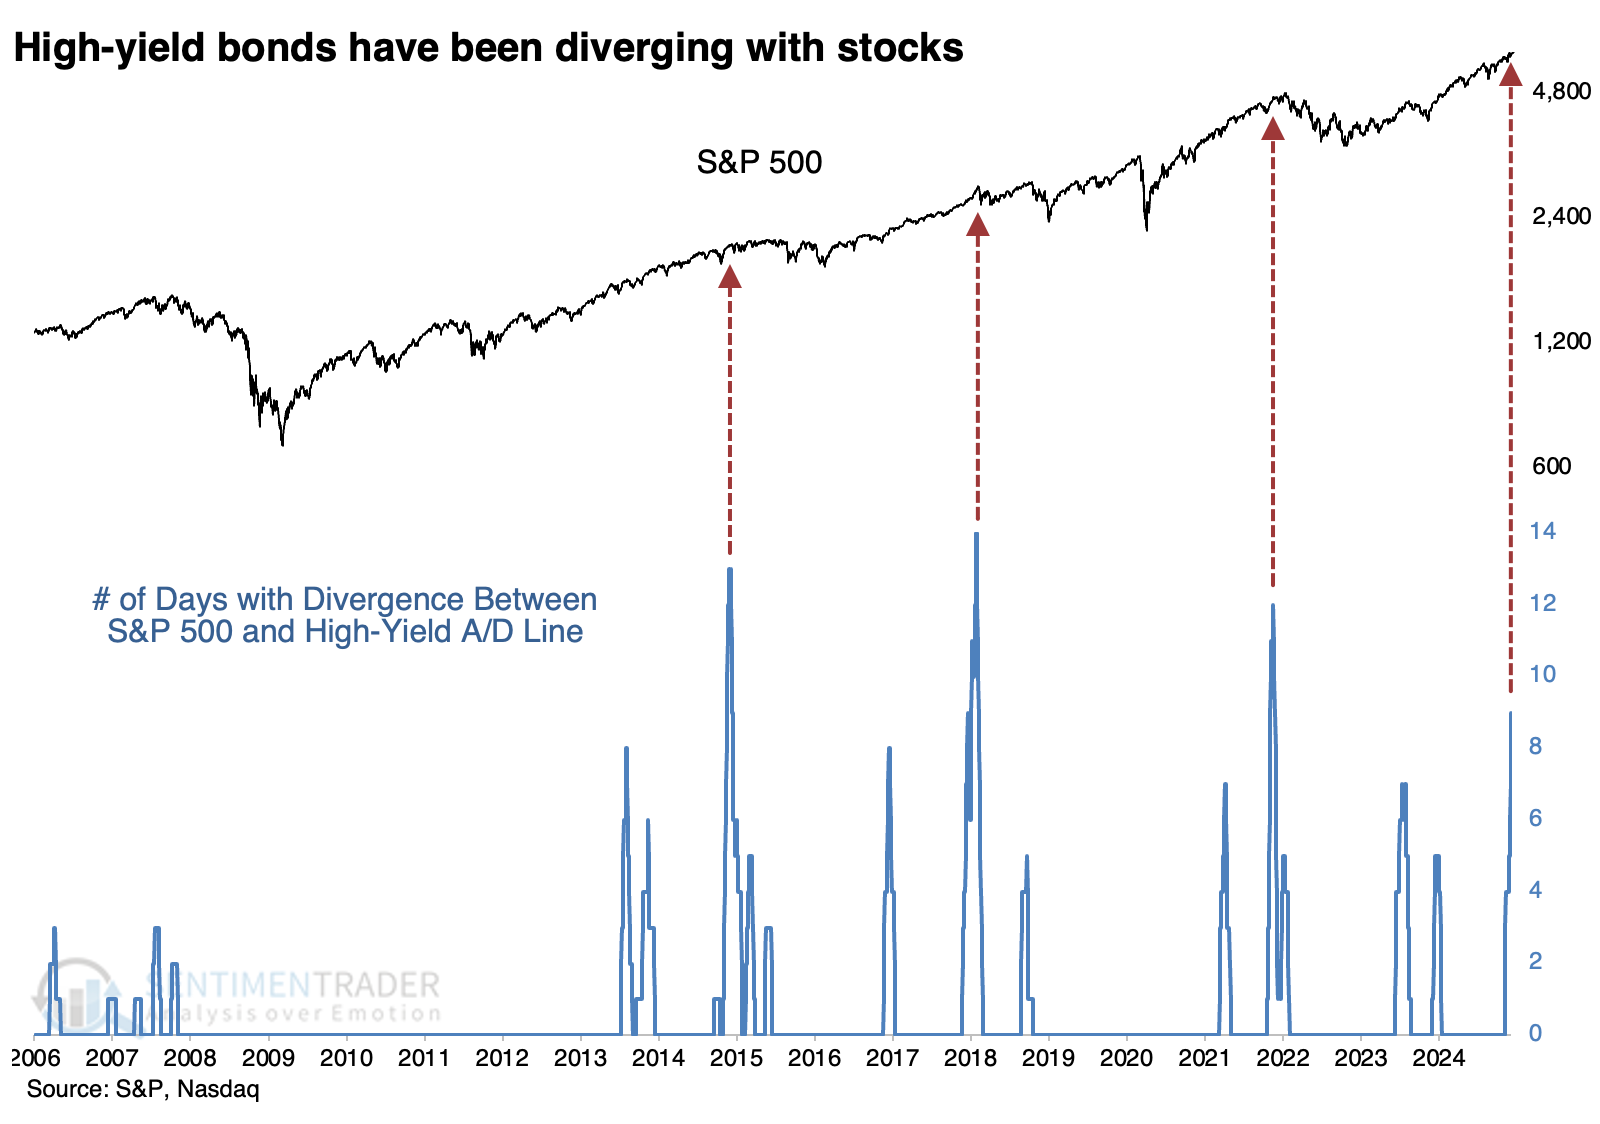
High-yield bonds diverge with stocks
One of our favorite early-warning markets is the high-yield (junk) bond market. And there are some developing concerns in that market.
As the S&P 500 has been notching new highs, fewer and fewer high-yield bonds have been rallying, and the High-Yield Cumulative Advance/Decline Line hasn't eclipsed its September high. Over the past month, the S&P has hit nine new highs on days when the HY A/D Line was at least 2% below its peak.
The popular SPY fund struggled to hold gains when there were so many divergences. The biggest takeaway from all three instances was limited upside, and any short-term gains that did occur evaporated during a subsequent correction.
The leading ETF focused on high-yield bonds, HYG, suffered even worse returns. There was almost no upside after these signals, and HYG suffered some stinging losses in the months ahead.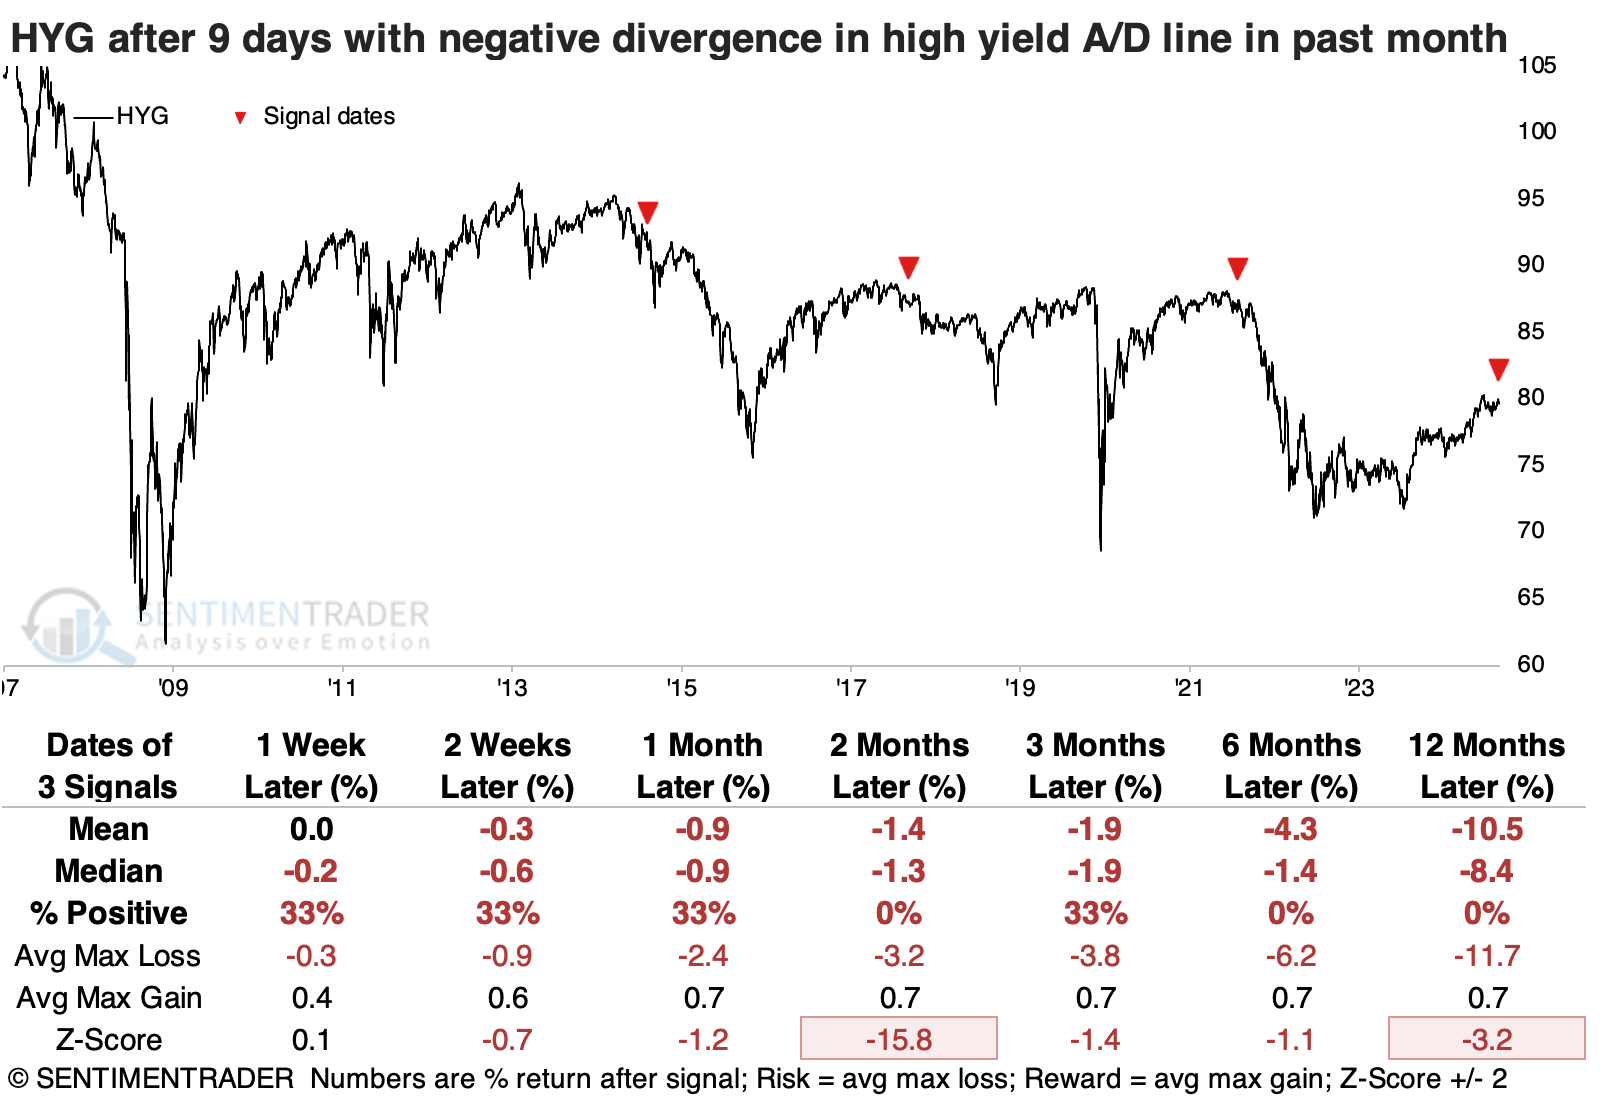
The lackluster participation among high-yield bonds kept its long-term McClellan Summation Index in negative territory even when the S&P 500 was making new highs. It's uncommon for the High-Yield McClellan Summation Index to be mired in negative territory on days when the S&P is at fresh highs. The S&P suffered no ill effects over the next six months or so two times, while five times, it either stalled out or showed a negative return.
Waiting for an uptick in spreads for trend confirmation
The trend in credit default swaps remains in a downtrend. Jay showed a way to use spreads as a trend-following confirmation tool.
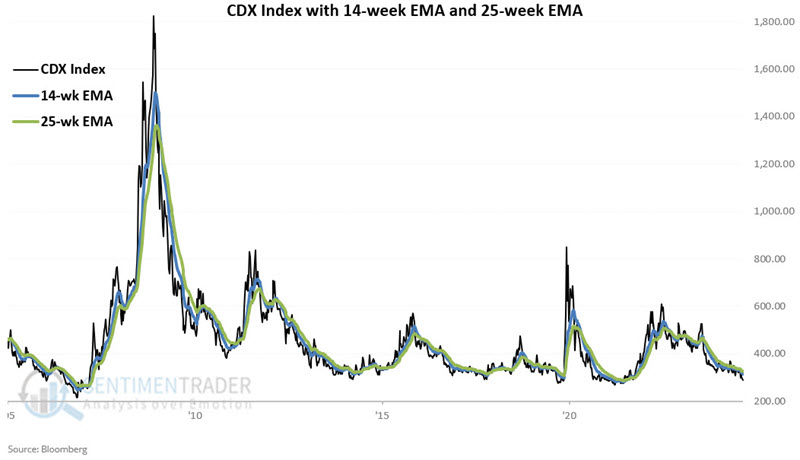
The type of credit spread we will focus on in this piece is known as a "credit default swap." A CDS allows various parties to swap the default exposure of the underlying credit. For example, investors in a relatively risky bond might be uncomfortable that its issuer could default on their payments. To hedge that risk, the investor buys a CDS.
The CDX Index is a "fear gauge" that measures stress in the financial markets. As such, we expect it to rise when the stock market falls and vice versa. The chart below zooms in on the last five years of history for a closer look.To track the trend of the CDX Index, we use a 14-week and a 25-week exponential moving average.
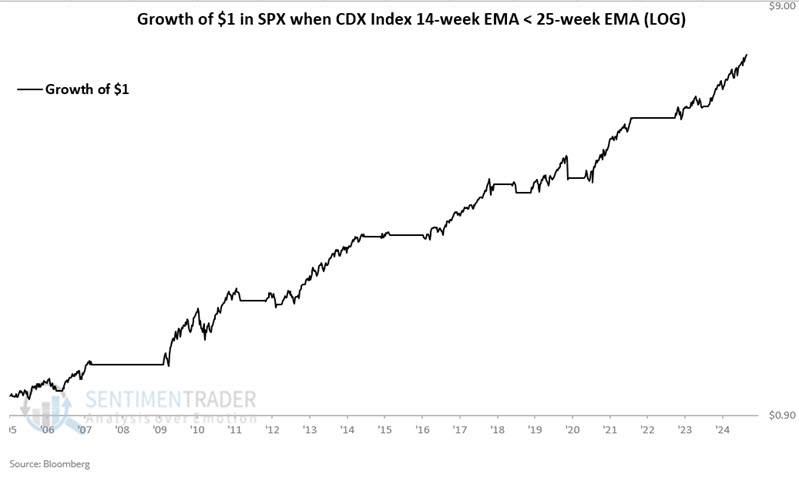
The chart below displays the hypothetical growth of $1 invested in the S&P 500 Index if held long only when the CDX Index's 14-week EMA is below its 25-week EMA. Since the CDX Index was first calculated in 2005, the S&P 500 has gained +586%, while the 14-week EMA is below the 25-week EMA.
The chart below displays the cumulative percentage performance (-22%) for the S&P 500 Index if held long only when the CDX Index's 14-week EMA is above its 25-week EMA.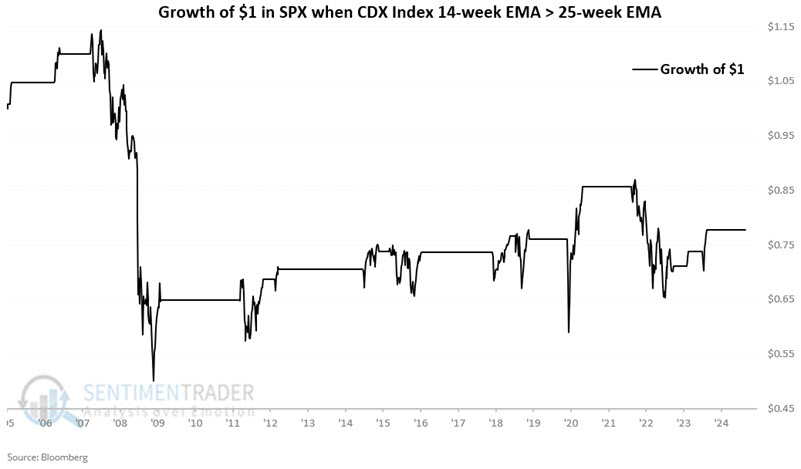
Note the choppy, inconsistent behavior of the S&P 500 Index during other periods when this CDX Index indicator was unfavorable. This once again lends weight to why investors may do well to pay attention to this indicator.
So far, the CDX index is below its moving averages, but given the divergence in some bonds lately, it's worth watching for a spike in this indicator.
About TradingEdge Weekly...
The goal of TradingEdge Weekly is to summarize some of the research published to SentimenTrader over the past week. Sometimes there is a lot to digest, and this summary highlights the highest conviction or most compelling ideas we discussed. This is NOT the published research; rather, it pulls out some of the most relevant parts. It includes links to the published research for convenience, and if you don't subscribe to those products, it will present the options for access.