
TradingEdge Weekly for Dec 1 - Easing conditions, impressive momentum, sentiment cycles

Key points:
- Financial conditions are easing
- The S&P 500 has established a bullish momentum reversal
- Easing conditions have helped foster bullish sentiment
- More indicators are tipping into risk-on territory
- Curiously, investors are still shoveling cash into money market funds
- Growth stocks have outperformed Value by more than +30% through November
- An 8-year calendar that has highlighted optimal times for gold mining stocks
- Gold mining stocks have underperformed gold by a historic degree
- Why copper is at an interesting juncture
- There are bullish kernels for the corn market
Financial conditions are easing
The Goldman Sachs Financial Conditions Index reversed relative to its recent range. Dean showed that returns for the S&P 500 are more favorable when financial conditions ease rather than tighten, and the Technology sector tends to outperform.
As the headwind from interest rates, the dollar, and credit spreads ease, the weight of the evidence favoring a bullish market outlook strengthens.
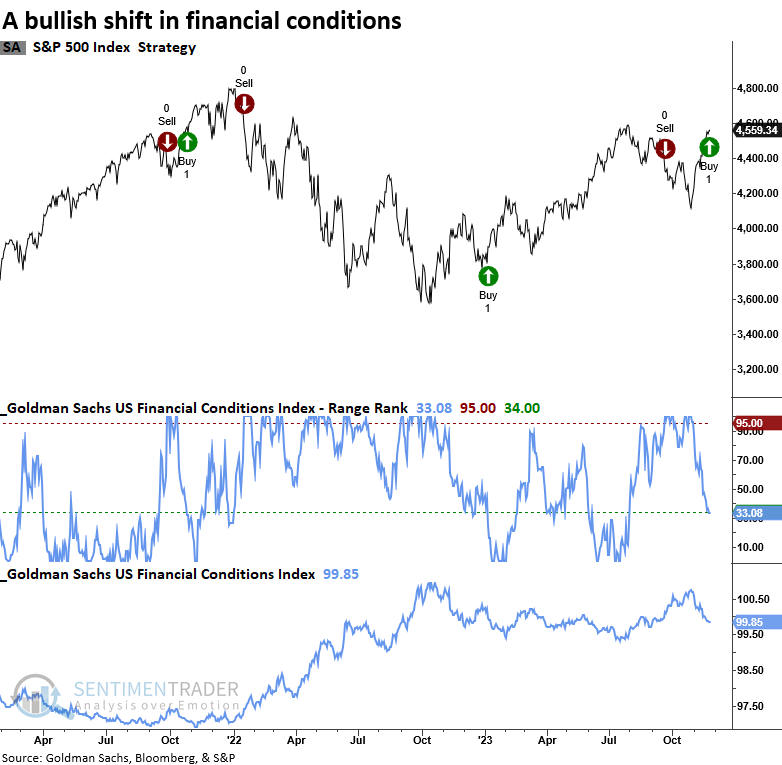
The model applies an 84-day range rank to the Goldman Sachs Financial Conditions Index. When the range rank declines below the 34th percentile, and price momentum for the S&P 500 is positive, the system goes long.
Whenever the Goldman Sachs Financial Conditions Index transitions from an unfavorable backdrop in conditions to a more advantageous one, the S&P 500 displayed solid returns, win rates, and z-scores.
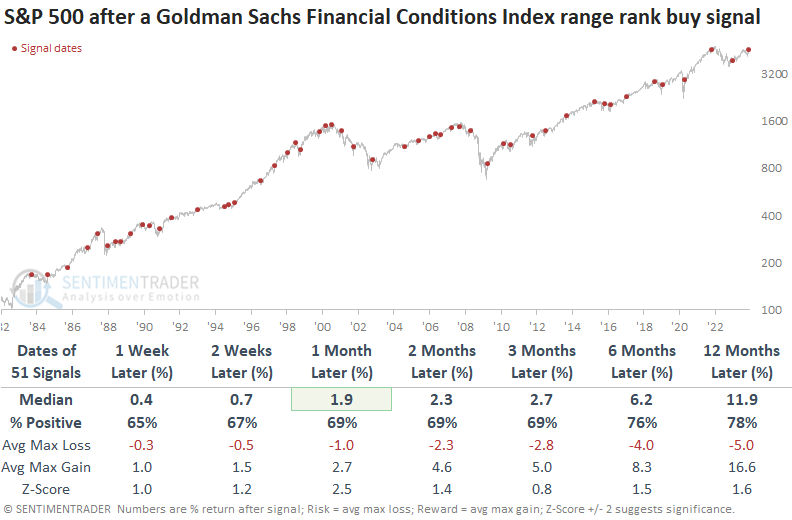
The ongoing dominance of the Technology sector could persist in an environment where financial conditions are less of a burden on stocks, based on sector returns following past signals.
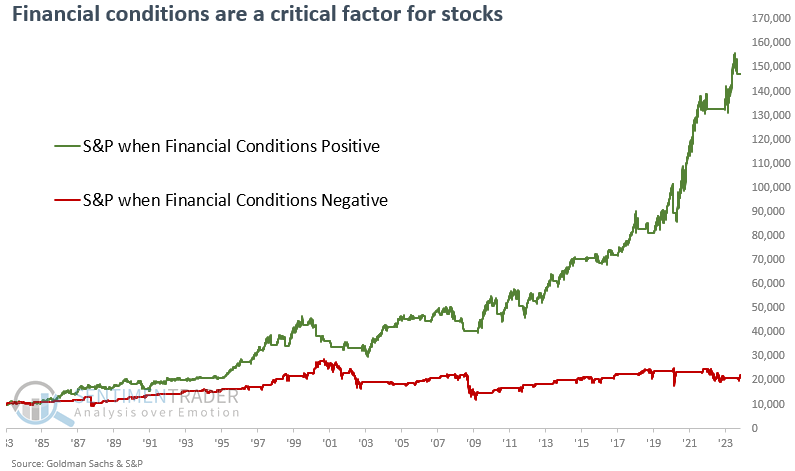
Utilizing the range rank rules, a $10,000 investment in the S&P 500 increases to $147,000 when financial conditions ease. Conversely, tightening conditions result in significantly smaller growth, with the initial investment reaching only $22,000.
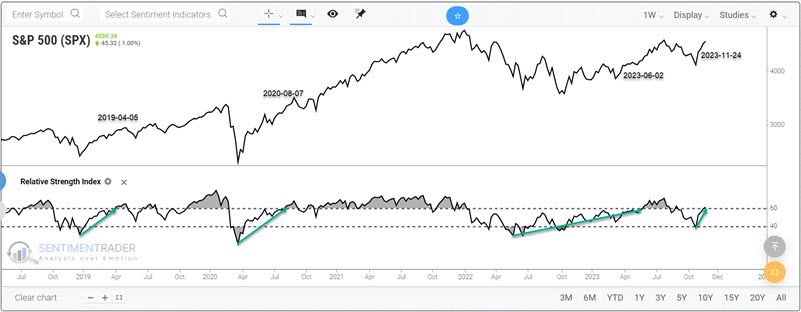
A bullish momentum reversal
Jay showed that the S&P 500 Weekly Relative Strength Index (RSI) recently crossed above 60%. When this indicator crosses above 60% after previously dropping below 43%, it tends to be followed by favorable price action.
We will focus on the standard Welles Wilder Relative Strength Index (RSI) indicator using the typical default of 14 periods. We will apply this to the S&P 500 Index using weekly data. A favorable signal occurs when the 14-week RSI crosses below 43.0 and THEN crosses back above 59.99.
Note that this process can take several weeks to several years to play out. The chart below displays the most recent signals generated using this method since 2019. The green arrows in the chart highlight the completion of a "drop below 43, then hit 60 or higher" cycle.
For the test below, we will assume the following rules:
- After the 14-week RSI cycles from below 43 to 60 or higher, buy the S&P 500 Index and hold for 189 trading days (i.e., roughly nine months)
- If a new cycle is completed BEFORE an existing 189-day holding period expires, reset the counter to 189 trading days and continue to hold the S&P 500 Index
In other words, if no new signal occurs within 189 trading days of the previous signal, then the holding period is 189 trading days. If there is an overlapping signal, we extend the holding period for another 189 trading days.
The chart below displays the hypothetical growth of $1 invested in the S&P 500 Index using the abovementioned rules.
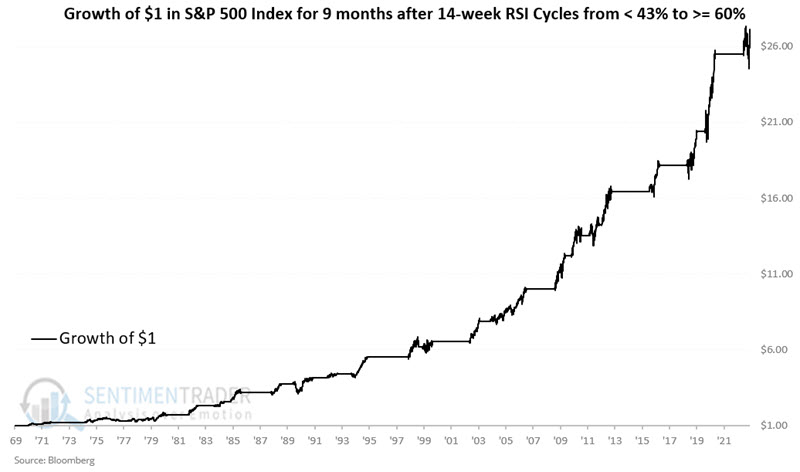
Note that:
- 26 of the 27 completed holding periods (96%) showed a gain
- 17 of the 27 completed holding periods witnessed a maximum drawdown of less than -2.5%
- 20 of the 27 completed holding periods saw a maximum drawdown of less than -5.0%
- 3 of the 27 completed holding periods saw a maximum drawdown of greater than -10%
The most recent holding period began at the close of 2023-06-02, with the S&P 500 at 4,282.37. The subsequent overlapping signal on 2023-11-24 means the holding period will be extended until 2024-08-24.
Easing conditions and better momentum have helped foster bullish sentiment
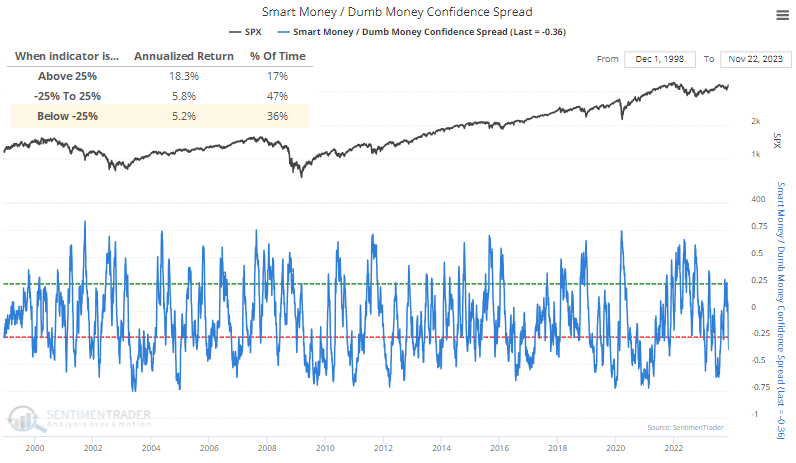
After a bout of high anxiety in October, investors have fully reversed course. Trend-following traders have become more comfortable with the idea of a further rally, while contrarians have started to express some doubts.
The spread between Smart Money and Dumb Money Confidence has fully cycled from one modest extreme to the other. This is similar to their behavior in March and April.
Because strong bull market trends tend to generate extreme sentiment and then keep going, the S&P 500's annualized return when the spread is below its lower threshold isn't all that bad at +5.2%. That's less than when it's neutral or showing extreme pessimism, but it's okay.
If we look at times when sentiment cycled from a moderate pessimistic extreme to a modest optimistic one, the S&P's return two months later was unimpressive at -0.5%. Other than that time frame, its median returns were positive but mediocre. After a rapid sentiment cycle, when it took a month or less to go from one extreme to the other, its returns worsened in the short term. Over the next 6-12 months, however, its returns improved and with less risk.
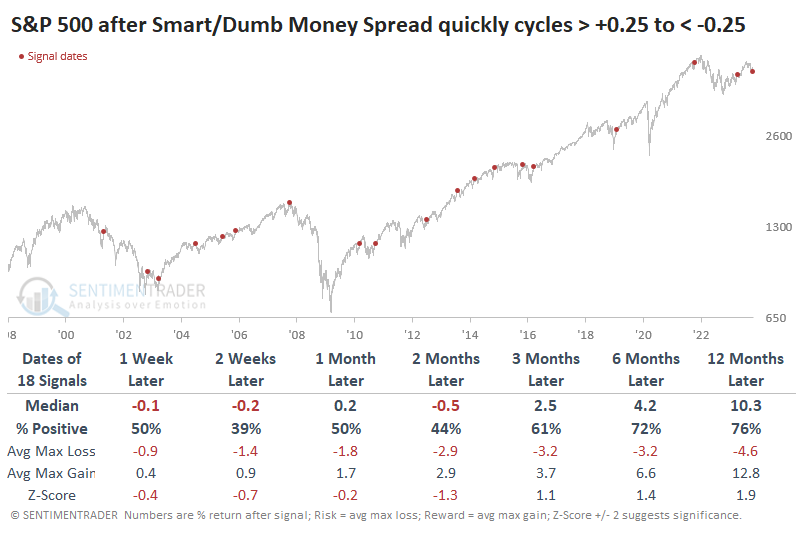
If we look at quick cycles in sentiment when the S&P was still mired in a pullback, then forward returns were okay, though the sample size necessarily gets smaller. There weren't any significant losses within the next two months, though two signals did lose more than that in the months after. A year later, there was only one large loss: the totally failed signal in 2001.
More evidence of bullish sentiment: risk-off has reversed
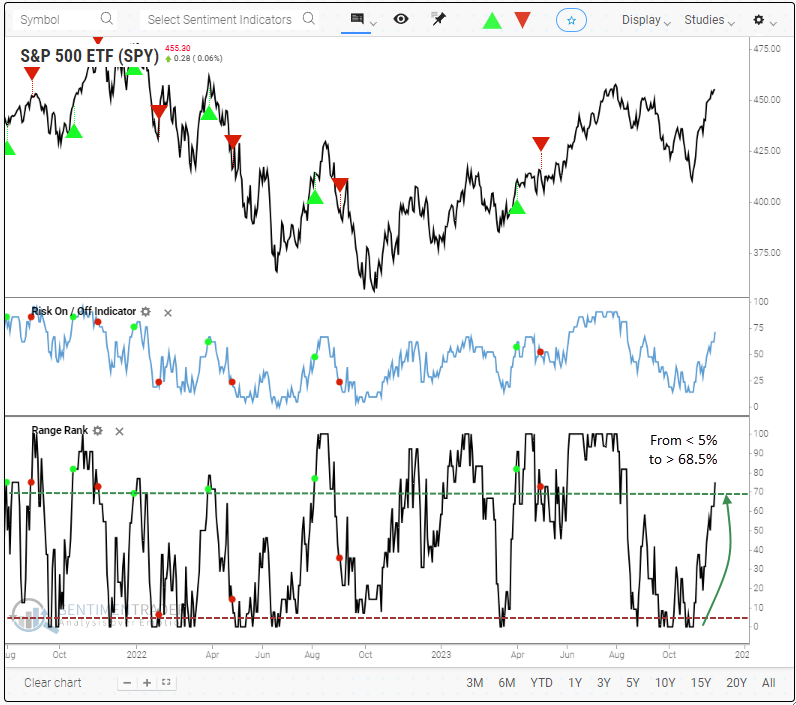
The Sentimentrader Risk On/Off Indicator shifted higher relative to its recent range. Dean noted that similar composite reversals produced a consistent upward bias in the S&P 500 across all time frames.
With our proprietary Risk-On/Off Indicator, a composite encompassing 21 diverse sentiment and breadth-based measures, coupled with our upgraded backtest engine, we can harness the power of composite models and reversal signals to identify advantageous trading setups.
With the new and improved backtest engine, subscribers can apply a range rank for a user-specified number of lookback sessions to any of our indicators. As a reminder, the range rank measures the current value relative to all other values over a lookback period. 100 is the highest, and 0 is the lowest.
The chart below showcases both the Risk On/Off Indicator and an 84-day range rank associated with the composite. Utilizing the multi-condition feature in the entry criteria section of the backtest engine enables us to identify instances when the range rank shifts from being below 5% and reverses above 68.5%.
Whenever the Sentimentrader Risk On/Off Indicator range rank cycled from below 5% to above 68.5%, S&P 500 returns, win rates, and z-scores are excellent across all time frames. While the model exhibited proficiency in navigating countertrend rallies amid the 2000-02 and 2007-08 drawdowns, the 2022 bear market diverged from expectations by registering consecutive losses greater than -10 % over the subsequent two months.
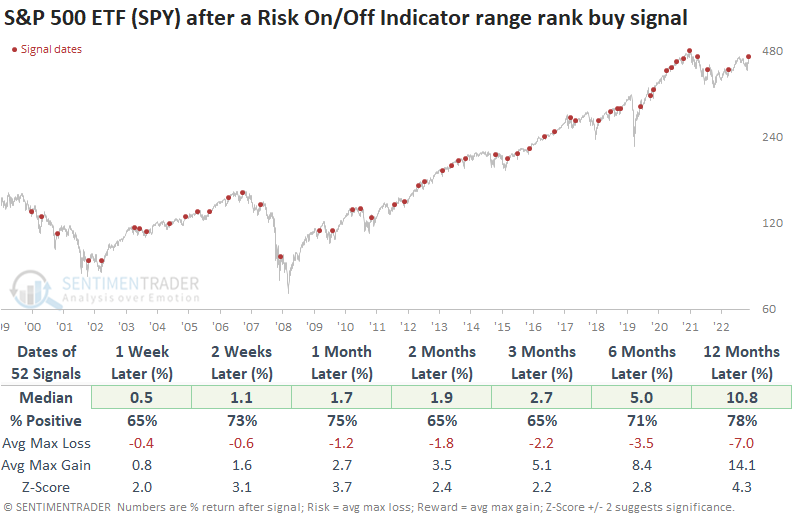
Suppose we include a condition that requires the S&P 500 to close within 5% of a two-year high at the time of an alert for context similar to now. In that case, returns, win rates, and z-scores were still outstanding.
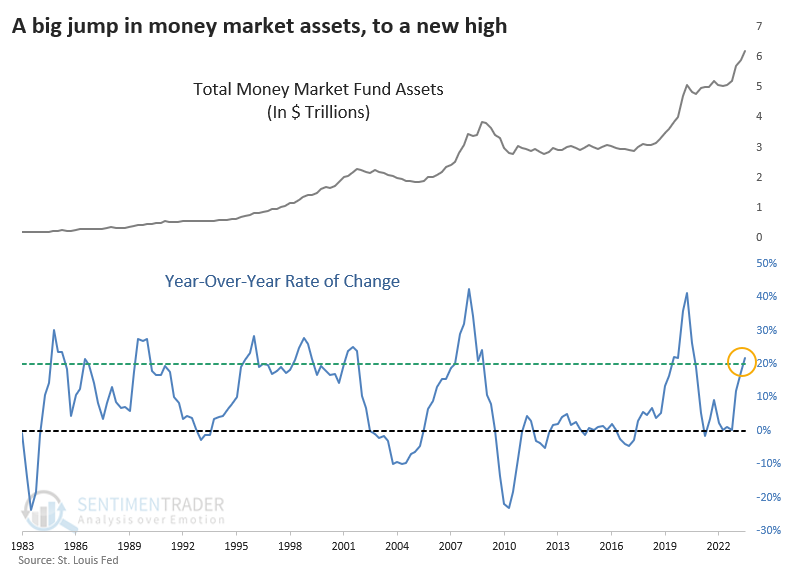
Curiously, though, investors are still shoveling cash into money market funds
The age-old debate about cash on the sidelines is roaring again. The amount of money investors have been pouring into money market funds has been staggering and shows no signs of letting up; the latest weekly figure from the Investment Company Institute shows yet another record high.
If we extrapolate a long-term data series from the Federal Reserve to include data as of quarter-end, money market assets totaled nearly $6.2 trillion. Not only is the absolute level high, it's rising at a faster rate. Assets at the end of Q3 were likely 20% higher than this time last year.
If we take the 20% growth rate in money market assets at face value, the table below shows that long-term returns in the S&P 500 were decent, with the last two protracted bear markets being the exceptions.
Three and nine months later, there was only a single loss. Still, investors seemed prescient in ramping up their cash levels ahead of rocky markets in 1990, 1998, 2002, 2008, and 2020, even if losses were unevenly spread after those dates.
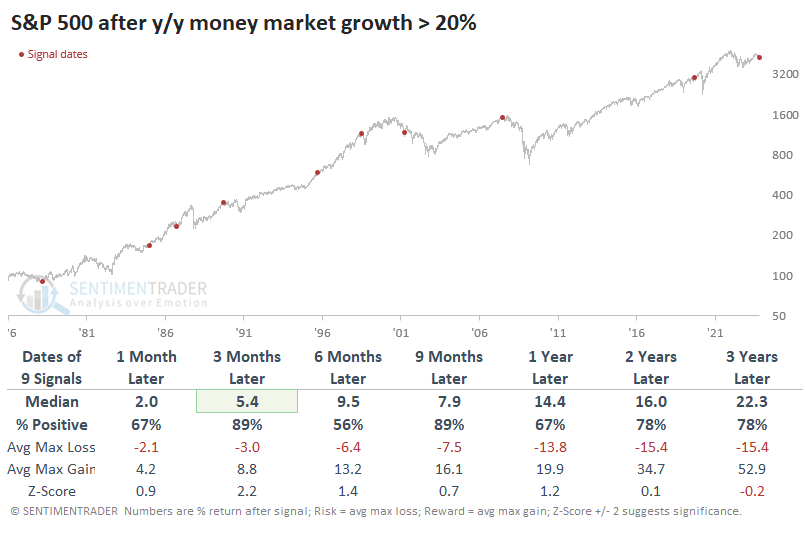
Since a rapid and significant increase in money market assets tended to precede some tough markets, it's unsurprising that some defensive sectors showed among the strongest returns. Consumer Staples and Health Care were standouts.
Interest rates are easing, and Wall Street is increasingly expecting the next Fed move to be a cut, so it's entirely likely that money market assets have peaked or are close to it. If we waited for money market assets to peak, it helped to lessen some of the risk. Since markets are cruel, it also lessened reward on longer time frames. Even if we had patience and perfect knowledge of when assets would peak, it didn't prevent us from suffering heavy losses in 2002 or 2008.
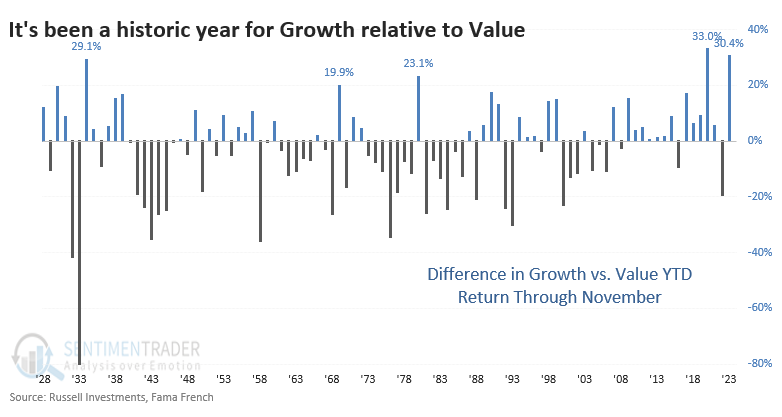
Growth stocks have had a very good year
It what must be one of the all-time shockers for doomers, the rapid rise in interest rates didn't kneecap Growth stocks. This year has been anything but difficult for the group.
Both Growth and Value stocks followed the same general price path during the year, but Growth's trajectory was supercharged by a handful of outstanding stocks that drove the group higher. This isn't just the 2nd-biggest underperformance for Value since 2000; it is the 2nd-biggest since...ever. The explosive rally in the latter half of 2020 was the only other time Growth outpaced Value by more than +30% through November.
As always, we're more concerned about what this might mean going forward. The table below shows returns in the S&P 500 in the weeks and months following similar investor behavior.
Somewhat surprisingly, it wasn't much of a sign either way. It gained most of the time across most time frames, but two months later (roughly through January), it was down more than up and sported a negative median return. Most of the negative returns occurred prior to 1980, however, and recent decades were much more positive for the S&P, with the notable exception of 2008.
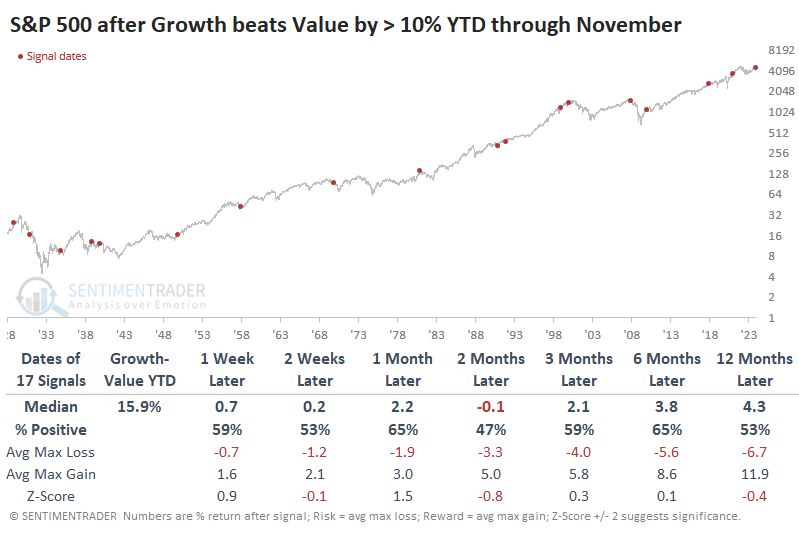
Growth stocks tended to fare better than the S&P 500 after the first couple of weeks, rising more than 70% of the time three and six months later. Value stocks fared even worse through the first couple weeks of December, then rebounded most of the time, though returns were generally weaker than that for Growth stocks.
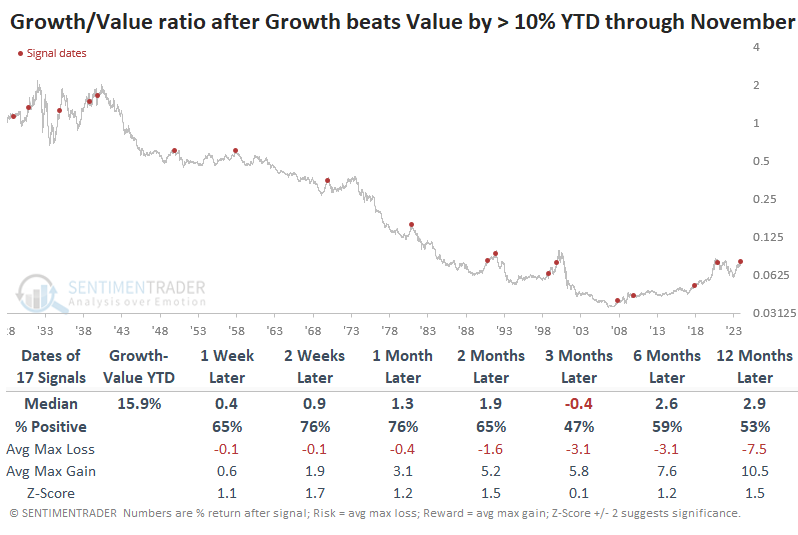
The ratio of Growth to Value shows that over the next month (roughly through year-end), Growth tended to continue to outpace Value. It underperformed by more than -2% only twice. After that, it was more of a mixed bag, particularly three months later when Value actually showed a slight edge.
A gold miner cycle calendar
Jay detailed a Gold Miner Calendar and related gold mining stock performance based on years within a cycle. The Calendar may be used as a standalone trading model, but realistically, it might be best suited as part of a weight-of-the-evidence approach.
An alternating eight-year cycle began on 1961-01-01, with the first four years considered favorable and the second four years considered unfavorable. During favorable years, gold miners are held all months except October. During unfavorable years, gold miners are held only during January, February, November, and December.
The table below displays the complete eight-year Gold Miner Calendar. The current eight-year cycle began on 2017-01-01 and will end on 2024-12-31. The current cycle is in November of the 7th year, as highlighted in green.
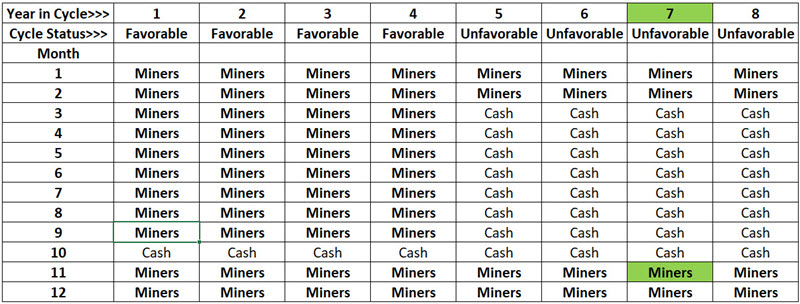
Per this Calendar, gold miners will be held through the end of February 2024 and then sold. They will not be repurchased until the close of the last trading day of October 2024.
The results below are based on daily price fluctuations for the Gold Bugs Index (Ticker HUI). It should be noted that HUI is an index and cannot be invested in directly. An investor could get highly correlated exposure to gold mining stocks by trading the VanEck Gold Miners ETF (ticker GDX) or Fidelity Select Gold Fund (FSAGX), among others.
For this test, any month labeled "Miners" in the calendar above is considered a "favorable" month, regardless of whether it occurs during the first four or last four years of the eight-year cycle.
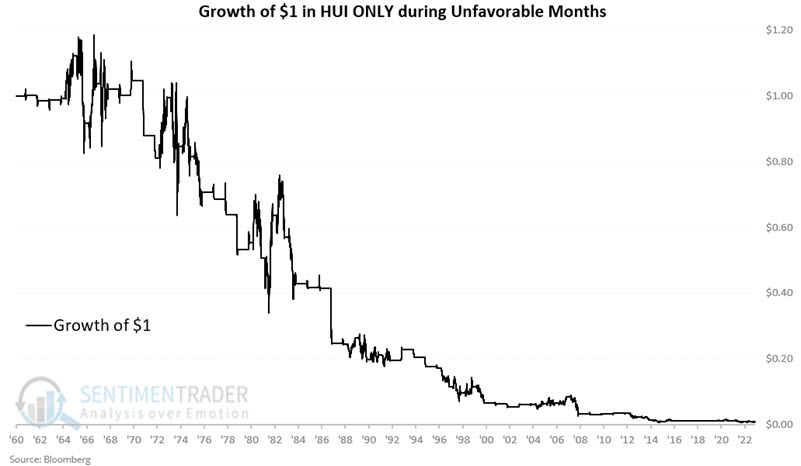
The chart below displays the hypothetical growth of $1 invested in ticker HUI only during favorable months (for all other months, no gain or loss is accrued. In real-world trading, the account would likely earn some interest in cash).
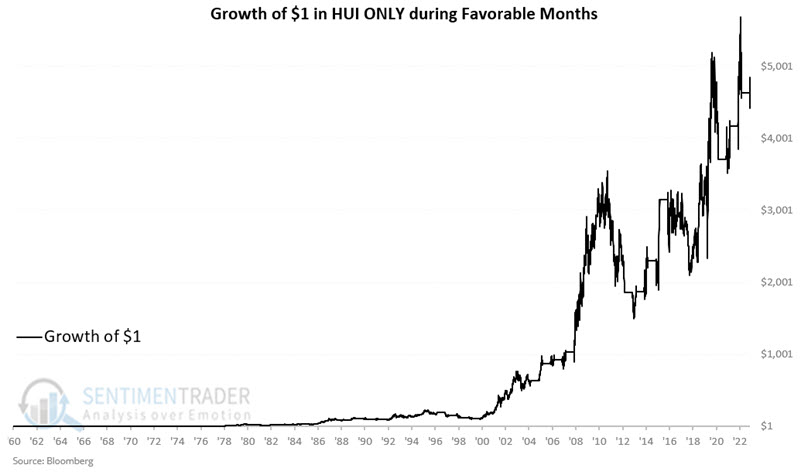
The good news is that this Calendar generated a hypothetical gain of +466,023% in 73 years. The bad news is that the results are hypothetical, there is no guarantee that future results will look similar, and an investor following this method would have experienced drawdowns exceeding 50% three times along the way. The only potential saving grace regarding drawdowns is that buy-and-hold experienced a maximum drawdown of a staggering -84.1%.
The strategy outperformed buy-and-hold by a factor of 117-to-1. So, there appears to be potential value.
The chart below displays the growth of $1 in ticker HUI only during all months NOT labeled Miners in the Gold Miner Calendar starting in 1961.
More potential good news for miners
Dean showed that gold miners reside in the lower half of their 3-year range, while gold trades near the upper end. Similar divergences led to a rally in the miners every time over the subsequent six and twelve-month periods.
For only the 7th time in more than five decades, gold futures closed higher than 91% of all other prices over the trailing three years as a gold mining index resided in the bottom half of its range with a reading of 36%, creating a massive divergence.
The spread between their range ranks recently fell to -60, a phenomenon observed in less than 1% of cases since 1969. While rare, readings below -60 tend to ignite an explosive rally, with annualized returns exceeding 76%.
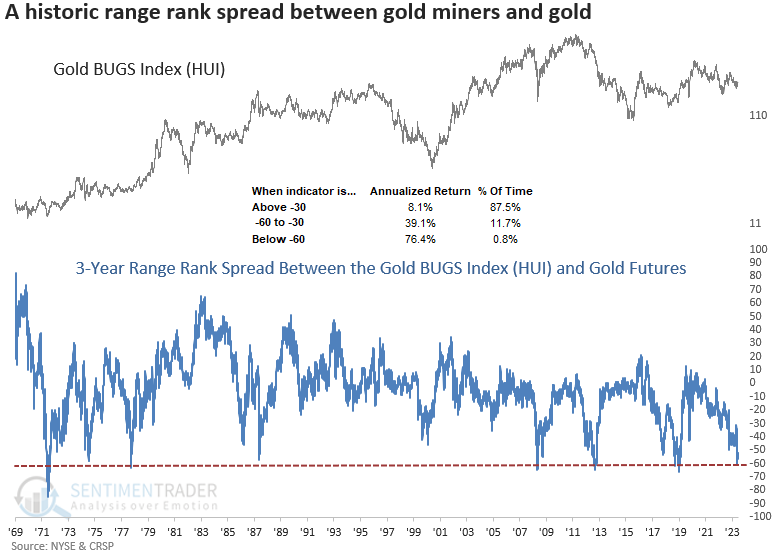
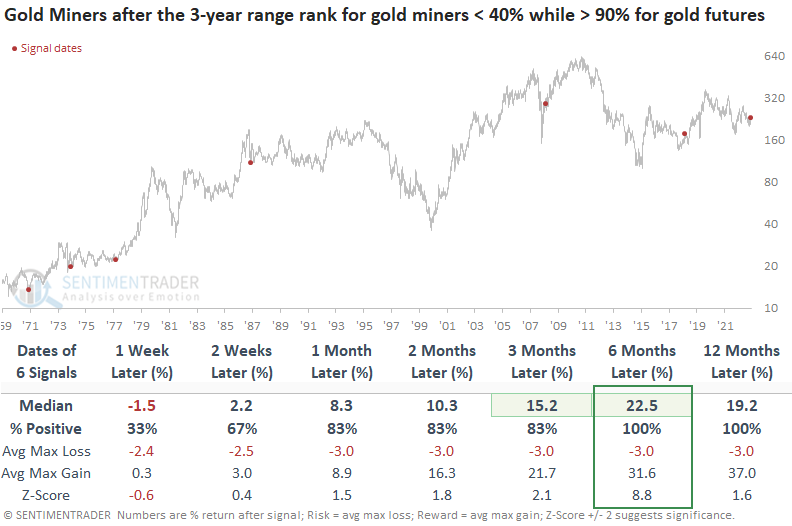
While the sample size is small, whenever the 3-year range rank for gold miners resides below 40% while the rank for gold futures exceeds 90%, the Gold BUGS Index (HUI) was higher over the subsequent six and twelve months every time.
While gold tends to rally over the next few weeks, the medium-term outlook is not encouraging. From a long-term perspective, the path is pretty straightforward. Either gold is about to top like 1974 and 1987, or it's in a sustainable uptrend like the other precedents. A decisive breakout above the previous resistance around 2051 would suggest the latter.
One plausible reason gold miners rally as gold struggles is an overall favorable backdrop for the stock market. The S&P 500 was higher every time from two to twelve months later.
A potentially interesting time for copper
The Copper/Gold Ratio recently crossed a threshold that has tended to portend good things for the price of copper in the year ahead. Jay noted that a seasonal tailwind also might help copper between now and March 2024.
As the name implies, the Copper/Gold Ratio compares the price of copper futures to the price of gold futures to essentially measure the relationship between the foremost industrial and precious metals. The chart below shows returns in copper after those dates when the Copper/Gold Ratio crossed above 0.19 for the first time in at least six months.
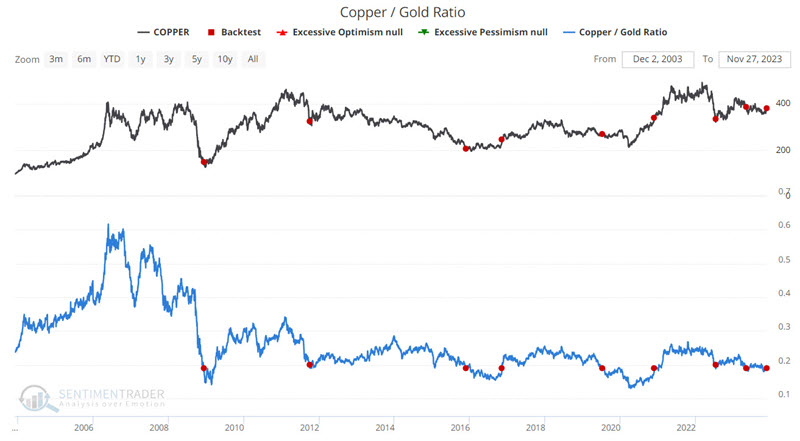
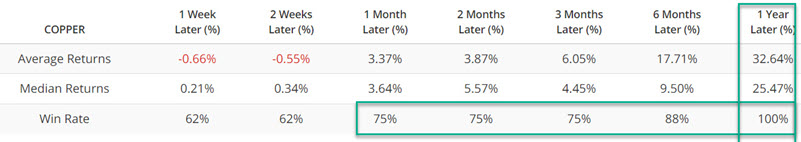
This is a relatively small sample size; however, the persistence of the Win Rate for six months and 1-year is noteworthy. Likewise, in six of seven instances, 1-year returns have been +14.5% or higher.
Jay also noted that copper has had a positive bias between now and the Trading Day of Year #47 next year. The chart below displays the cumulative $ gain/loss from holding a long position in copper futures only during this period since 1959.
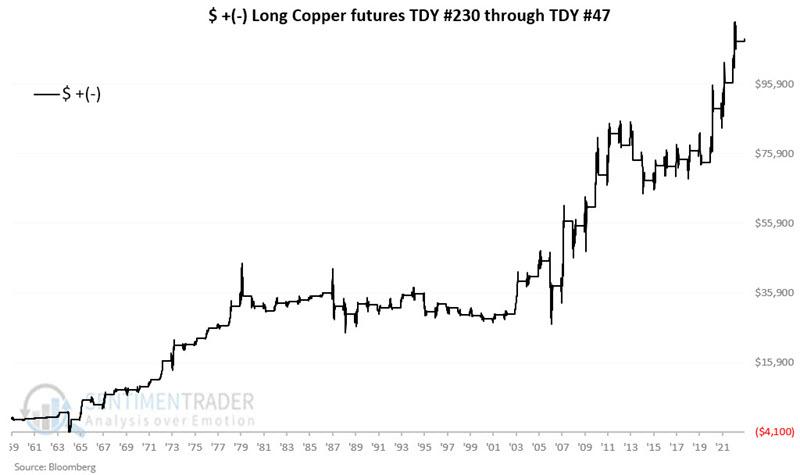
A 63% Win Rate suggests that this factor should not be relied upon as a standalone indicator. However, when combined with a more meaningful signal - such as the one from the Copper/Gold Ratio - and if also confirmed by an uptrend in price, this seasonal trend can add significant weight to the bullish side of the ledger. Large moves over $5,000 have historically skewed 10 to 3 to the winning side.
The United States Copper Index Fund, LP (ticker CPER) is an ETF that invests in copper futures contracts. Another alternative would be to take a long position in copper mining companies via an ETF like COPX or shares of individual companies. CPER and COPX trade with about an 80% correlation, so results will typically be similar in terms of trend. However, there can be wide discrepancies in terms of total return. Investors are encouraged to do their due diligence before investing in copper mining stocks based on the above signals.
Why bother looking at copper miners? Because they tend to outperform during bullish periods for copper. So, if the hoped-for rally in copper does materialize in the months ahead, history suggests that copper miners will outperform the metal itself. The caveat is that they also tend to underperform during bearish periods for copper - so if the hoped-for rally in copper fails to materialize, copper miners are likely to suffer more than the metal itself.
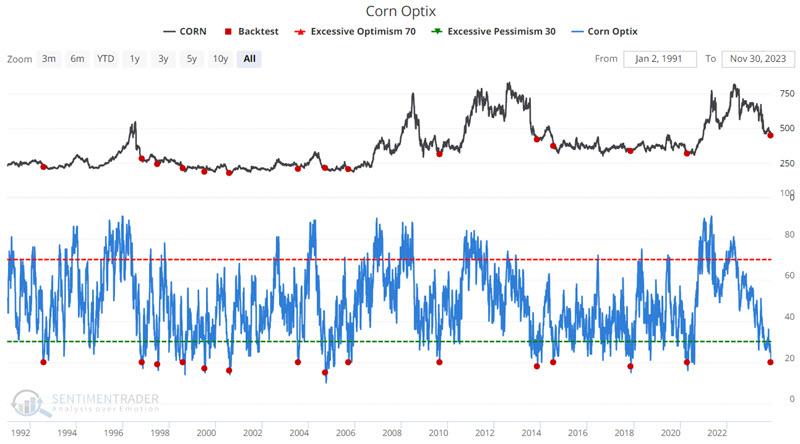
Bullish kernels for corn
Jay noted that corn is soon entering a favorable seasonal period just as sentiment has reached a significant level of pessimism.
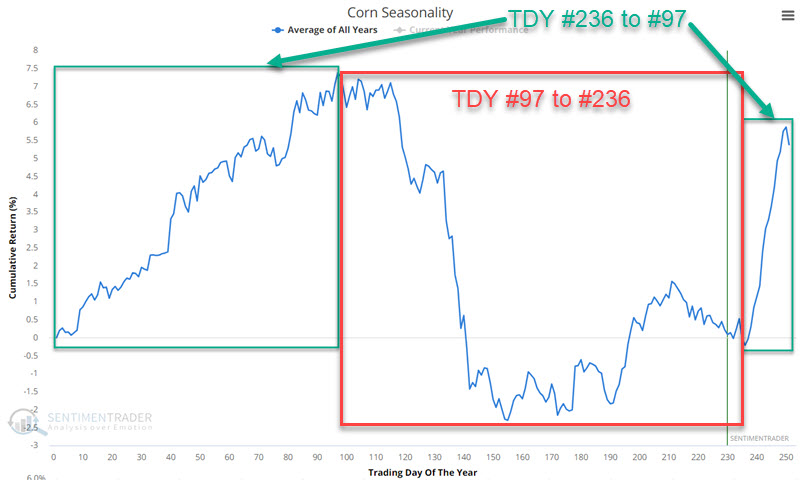
The chart below displays the annual seasonal trend for corn futures. Not that there is a favorable phase from Trading Day of Year (TDY) #236 through TDY #97 of the following year and an unfavorable phase from TDY #97 through TDY #236.
Note that corn is about to enter a favorable seasonal period. For 2023-24, this period runs from the close of 2023-12-08 through the close of 2024-05-20.
The chart below displays the cumulative dollar return achieved by holding a long 1-lot position in corn futures only during the favorable phase starting in 1940. The cumulative hypothetical return is +$98,005.
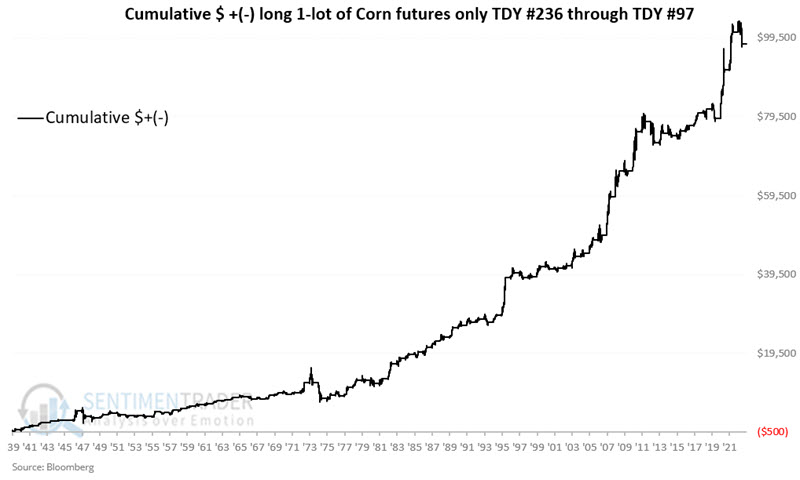
During the unfavorable phases, the return was -$78,452, so a combination of being long during the favorable phases and short during unfavorable ones tended to show strong positive returns (with high risk).
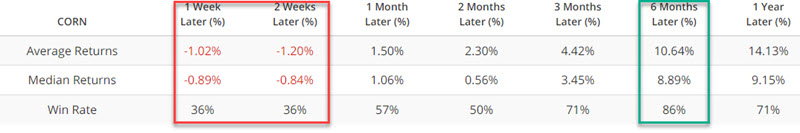
As corn is about to enter its next favorable seasonal window, sentiment is nearly washed out. The chart below highlights those dates when Corn Optix stood at 20% or lower. The most recent drop to this level occurred on 2023-11-29.
The Teucrium Corn Fund ETF (ticker CORN) may be an alternative for non-futures traders to play the corn market.
About TradingEdge Weekly...
The goal of TradingEdge Weekly is to summarize some of the research published to SentimenTrader over the past week. Sometimes there is a lot to digest, and this summary highlights the highest conviction or most compelling ideas we discussed. This is NOT the published research; rather, it pulls out some of the most relevant parts. It includes links to the published research for convenience, and if you don't subscribe to those products, it will present the options for access.