Products
SentimenTrader Trading Tools
‍
Backtest Engine
My Trading Toolkit
Correlation Analysis
Seasonality
Market Prediction
Indicators & Data API
‍
Proprietary Indicators & Charts
Market Data API
Strategies & Scanner
‍
50+ Trading Strategies
Smart Stock Scanner
Smart Option Scanner
Research Reports
‍
Research Solutions
Reports Library
Free Resources
Simple Backtest Calculator
Simple Seasonality Calculator
The Kelly Criterion Calculator
Sentiment Geo Map
Public Research Reports
Education
Sentiment Indicators
Technical Indicators
Pricing
Company
About
In the News
Testimonials
Client Success Stories
Contact
Log inLoginSign up
< BACK TO ALL REPORTS

TradingEdge Weekly for Aug 7 - Weight-of-evidence bullish signals, Bollinger Band squeeze setup, JK Economic Barometer spike, V-shaped reversal near highs, Two-sector new high, Three sectors to avoid, Copper divergence

by Sentimentrader
2026-08-07
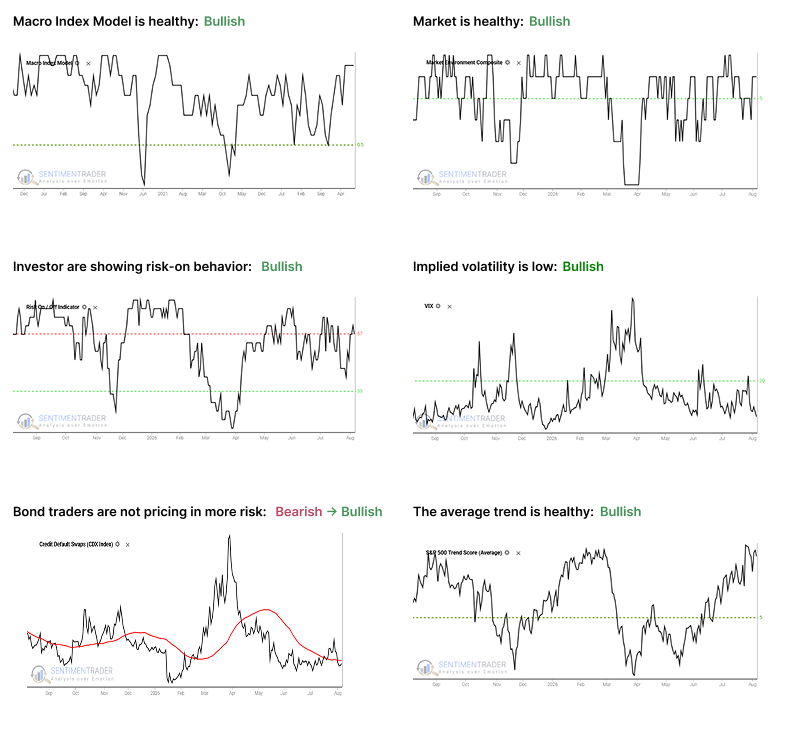
Despite short-term August headwinds and Bollinger Band squeeze volatility, a rare convergence of bullish signals—including a JK Economic Barometer spike and extreme insider holding—points to an exceptionally strong 12-month outlook.

Key points:

  • The Copper/Gold Ratio below 0.17 shows a 100% 12-month win rate for the S&P 500; over 90% of sectors with their 50-day MA above the 200-day MA has proven to be a reliable trend-confirmation signal; and S&P 500 insider selling dropping below 1,800 signals insiders don't view stocks as overvalued - together these three weight-of-evidence indicators lend significant support to the bullish case over the next 12 months.
  • SPY's Bollinger BandWidth compressed to ≤3% followed by a break below the lower band - a classic mean-reversion setup with nearly 80% win rates over 3-4 months for both S&P 500 and Nasdaq, though short-term data suggests preparing for entries rather than buying immediately.
  • The JK Economic Barometer surged from 0.864 to 3.456 on July 31; historically, when the JEB drops below 1.00 and then crosses above 2.50, the S&P 500 has a 90% win rate over the next 12 months with an average win of 16.3% vs. average loss of just -1.6%.
  • The S&P 500 reversed from a 21-day closing low to a 21-day closing high in just four sessions - only 18 such events on record. By itself, the signal is inconsistent, but when it occurs within 2% of a 52-week high, returns improve to 100% positive at one year with a 13.28% mean.
  • Only Industrials and Financials joined the S&P 500 at record highs; historically, when exactly two sectors hit all-time highs alongside the index, expected returns average over 11% one year later with a 72% sho

Sorry, you don't have access to this report

Upgrade your subscription plan to get access
Go to Dasboard
PRODUCTS
SentimenTrader
Trading Tools
Indicators & Data API
‍
Strategies & Scanner
‍
Research Reports
FREE
RESOUrCES
Simple Backtest
Calculator
Simple Seasonality
Calculator
The Kelly Criterion
Calculator
Sentiment Geo Map
‍
Public Research Reports
‍
Education
Sentiment Indicators
‍
Technical Indicators
‍
Pricing
Bundle pricing
‍
FAQ
‍
Announcements
‍
COMPANY
‍
About
‍
In the News
‍
Testimonials
‍
Client Success Stories
CONTACT
‍
General Inquiries
‍
Media Inquiries
‍
Financial Professionals Inquiries
‍
© 2026 Sundial Capital Research Inc. All rights reserved.
Setsail Marketing
TermsPrivacyAffiliate Program
Risk Disclosure: The information and tools provided are for research and analytical purposes only and are not intended as investment advice. Market analysis involves uncertainty, and outcomes may differ from expectations. Users should conduct their own due diligence and consider their individual circumstances before making any financial decisions. Past performance is not necessarily indicative of future results.

Hypothetical Performance Disclosure: Hypothetical performance results have many inherent limitations, some of which are described below. No representation is being made that any account will or is likely to achieve profits or losses similar to those shown; in fact, there are frequently sharp differences between hypothetical performance results and the actual results subsequently achieved by any particular trading program. One of the limitations of hypothetical performance results is that they are generally prepared with the benefit of hindsight. In addition, hypothetical trading does not involve financial risk, and no hypothetical trading record can completely account for the impact of financial risk of actual trading. for example, the ability to withstand losses or to adhere to a particular trading program in spite of trading losses are material points which can also adversely affect actual trading results. There are numerous other factors related to the markets in general or to the implementation of any specific trading program which cannot be fully accounted for in the preparation of hypothetical performance results and all which can adversely affect trading results.

Testimonial Disclosure: Testimonials appearing on this website may not be representative of other clients or customers and is not a guarantee of future performance or success.