
TradingEdge Weekly for Aug 25 - Oversold in an uptrend, sentiment is flipping, a major breakout in rates

Key points:
- Leading indicators have turned up, triggering a buy signal
- The Smart Money and Dumb Money are flipping positions
- Stocks are in the midst of their worst seasonal window
- There has been a jump in one-month lows in the S&P 500, but not twelve-month lows
- There are more indicators suggesting oversold-in-an-uptrend conditions
- The put/call ratio shows a quick return to fear among investors
- An options hedging strategy just in case the oversold conditions don't work
- A major breakout in the most important interest rate
- The Optimism Index on several retail stocks neared all-time lows
Leading indicators trigger a buy signal
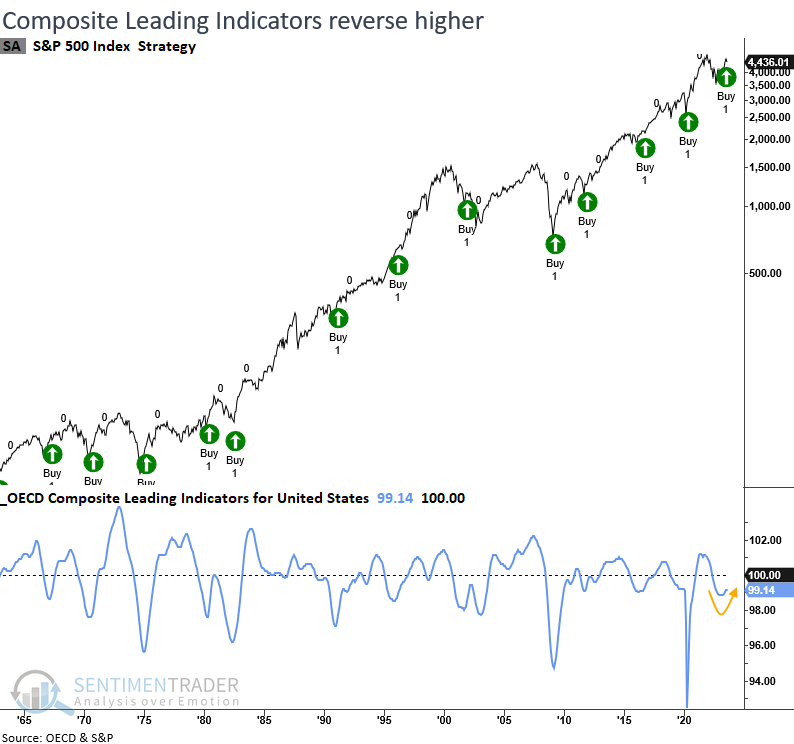
The OECD Composite Leading Indicators for the U.S. reversed higher from contraction territory. Dean noted that similar reversals led to extremely bullish outcomes for the S&P 500 over the next twelve months.
The Organization for Economic Cooperation and Development (OECD) compiles a composite of leading indicators for G20 countries. The model we use for individual countries requires the CLI to fall into contraction territory and rise by a certain amount from a low.
In the case of the United States, the CLI fell below 99.5 and rose by 0.25 points from its trough, a condition that triggered a new buy signal with the most recent update from the OECD.
Whenever the OECD CLI for the United States falls below 99.5 and increases by 0.25 points from the subsequent low, the S&P 500 displays remarkable returns, win rates, and z-scores across all time frames. Two months later, the S&P 500 was higher every time. In the two previous instances when the FOMC adopted a more restrictive monetary policy stance, returns remained positive, albeit falling short of the median over the next year.
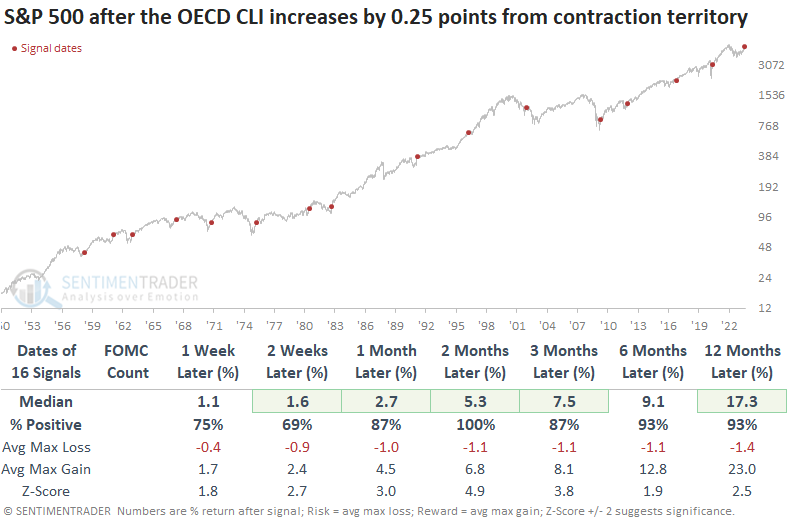
From a sector perspective, early cycle leaders like Consumer Discretionary and Technology are clear-cut winners, which aligns with current relative strength trends.
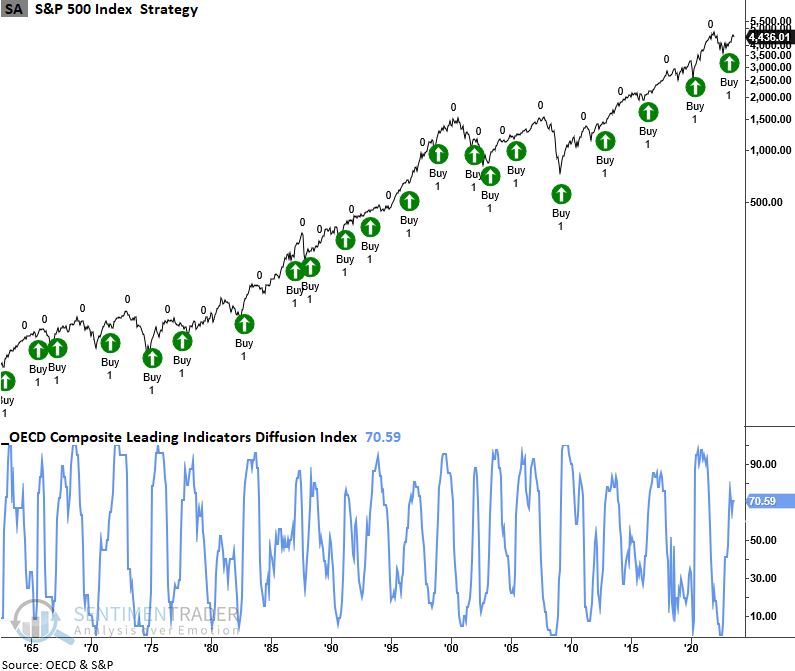
The diffusion index, which aggregates individual country CLIs, continues to maintain a bullish level after Dean showed it triggering a buy signal in the spring.
The Smart Money and Dumb Money are switching positions
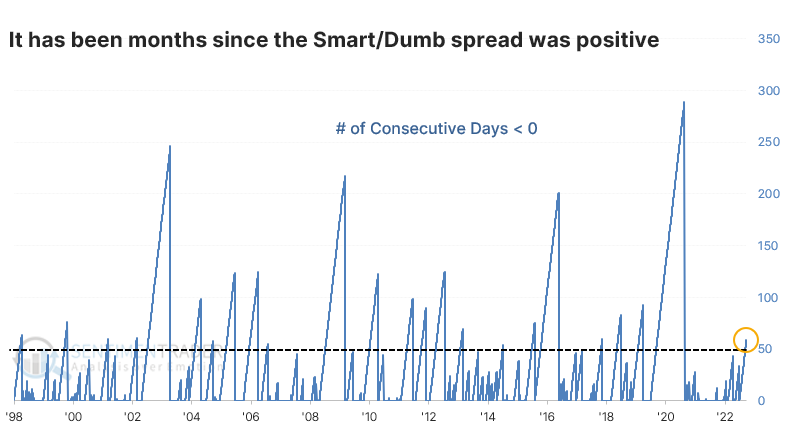
For the first time in months, Smart Money is about to be more confident in a stock market rally than the Dumb Money.
This is somewhat counterintuitive, but typically we see this behavior during declining markets. The "dumb money" mostly reflects trend-followers, who tend to be correct during the meat of protracted trends, but also grossly offside at turning points. The "smart money" tends to buy as stocks decline and sell as they rally, which doesn't look very smart during trending markets, but they also tend to be heavily long at market lows and neutral or short at peaks.
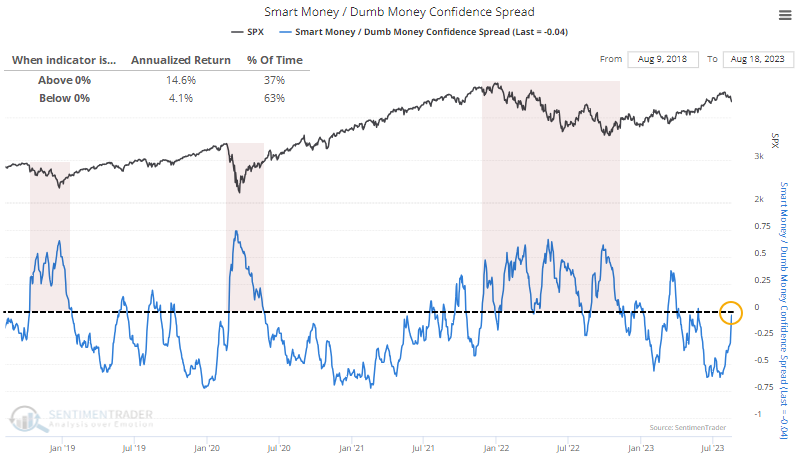
Because of this dichotomy, when the spread between the two groups is positive, it tends to occur during rough markets. Staying out when the spread was positive, until it exceeded +0.5 anyway, would have kept a trader out of challenging markets in 2018, 2020, and 2022, and before that. But as we can see from the chart, the S&P's annualized return when the spread is positive has been more than triple the return when the spread was below zero. That's because the strongest days have occurred as stocks were bottoming; when the S&P 500 is in an uptrend, and the spread is negative, it tends to enjoy consistent but small average daily gains.
When the spread cycles from an extreme negative back to neutral, the S&P has mostly shown gains in the weeks and months ahead. We try to add context when possible, and one important piece of context here is duration. The spread between Smart and Dumb Money Confidence had been negative for months. Streaks longer than 50 trading days have been relatively rare since we began computing this in 1998.
When the spread turned positive after spending at least 50 days below zero, returns were again decent but pretty mixed in the shorter term. There were a few uncomfortable losses in there. When we combine the studies, we can approximate conditions most like the current ones. The table below shows the S&P's future returns when the spread had been extremely negative and was below zero for a protracted amount of time, then turned positive.
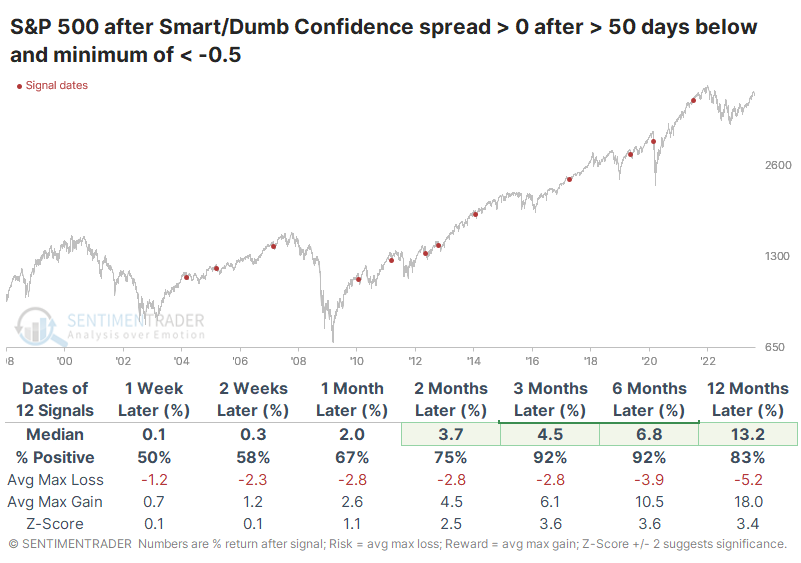
This triggered during the once-in-a-century pandemic panic and preceded ugly losses. But outside of that outlier, these were not bear market signals. None of them happened during protracted declines, only during bull phases. As a result, the index's returns over the medium- to long-term were superior. Over the next 3-6 months, there was only a single minor and temporary loss.
The worst seasonal window is here
The stock market may be reaching potentially oversold levels, but Jay noted that the S&P 500 is entering its weakest seasonal period of the year.
We are entering what is generally the weakest part of the year for stock market performance. This period extends from the close of Trading Day of Year (TDY) #158 through TDY #197. It is essential to remember that annual seasonal charts are an average of what has happened in the past and not a roadmap of what will happen this time around. For 2023, this period extends from the close on 2023-08-21 through 2023-10-16.
The chart below displays the growth of $1 invested in the S&P 500 Index only from TDY #158 through TDY #197 since 1953.
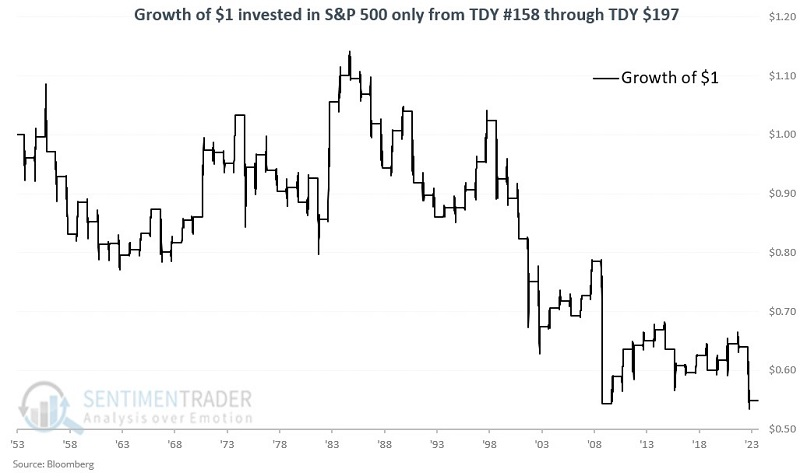
The index managed to show a gain during 50% of the years, but its average decline was larger than its average loss. Also, the S&P suffered a loss of more than -9% during six years while enjoying a gain of more than +9% during only two years.
Pre-election years have long shown a tendency to be bullish on the whole (no down pre-election years since the 1930s). Does the unfavorable TDY #158 through TDY #197 period also show better results than average during pre-election years? The correct answer is probably "Yes, but."
The chart below displays the growth of $1 invested in the S&P 500 Index from TDY #158 through TDY #197 only during pre-election years.
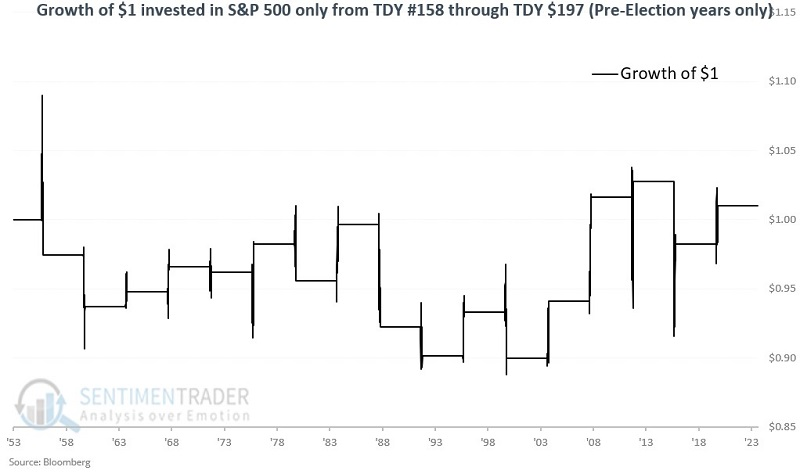
The good news is that pre-election results have tended to be somewhat better than during other years. Nine out of 17 years (53%) have shown a gain, and the net result is a meager cumulative gain of +1% - but a gain nevertheless, rather than a loss. Also, the worst SPX performance within a pre-election year during this unfavorable seasonal period was -7.4%. Not something an investor would hope for, but a far cry better than several other years.
A bullish increase in new lows
Dean noted that over 47% of S&P 500 stocks closed at a 1-month low, with less than 3.5% of stocks hitting a 12-month low. After similar conditions, results going forward, even in the seasonally weak months between August and October, were excellent.
Last Friday, 1-month lows for stocks in the S&P 500 surged to 47%, the highest level since March. However, long-duration lows were minimal, with fewer than 3.5% of stocks closing at a 12-month low.
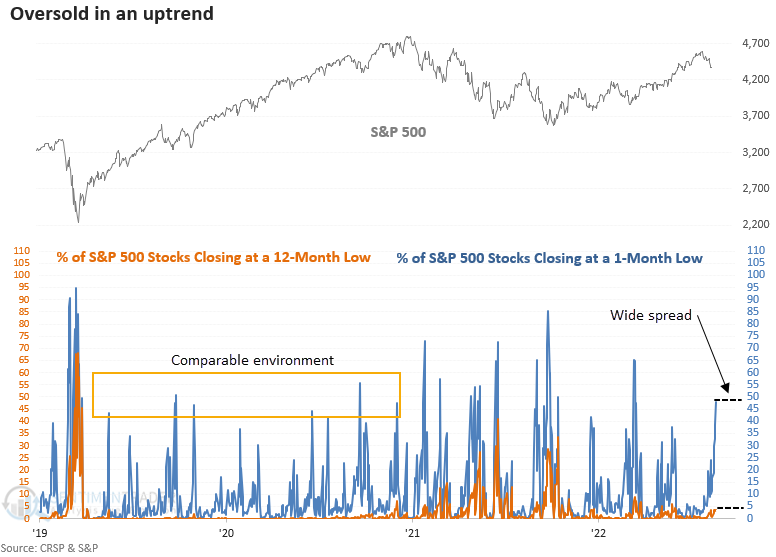
In precedents where 1-month lows climb to 47%, while fewer than 3.5% of these stocks register a 12-month low, the spread tends to mark an oversold condition in an uptrend. Three weeks later, the S&P 500 was higher 74% of the time, with a median return of 2.2%. Results since 1950 were really impressive, with an 85% win rate over the next three weeks.
The case for an oversold condition that refreshes a bullish uptrend looks compelling over longer duration time frames, with excellent results ranging from one to twelve months later. Once again, results since 1950 were fantastic, with the large-cap index rising 93% of the time over the next month.
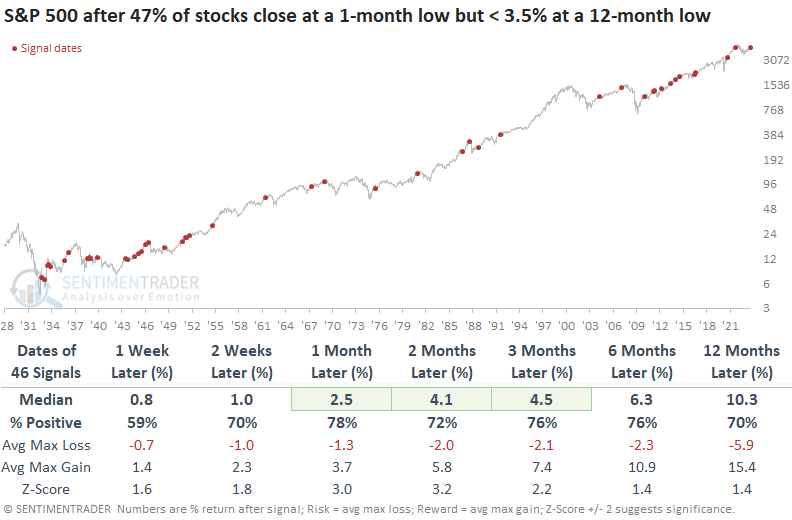
Jay published a note on S&P 500 seasonality, shown above. Suppose we isolate instances that occurred during the seasonally weak period for stocks. In that case, the S&P 500 was higher 86% of the time over the subsequent one and six months. It's worth mentioning that most signals occurred when the seasonal window was nearing its conclusion rather than at the initial stages.
More oversold indicators
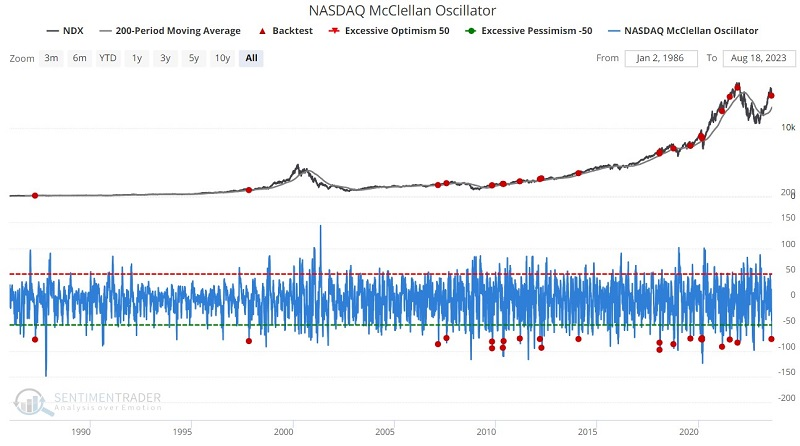
Jay showed that a variety of indicators are suggesting that the recent decline in the market is a typical pullback within a more significant uptrend, including the Nasdaq McClellan Oscillator and the percentage of oversold members in the S&P 1500 index.
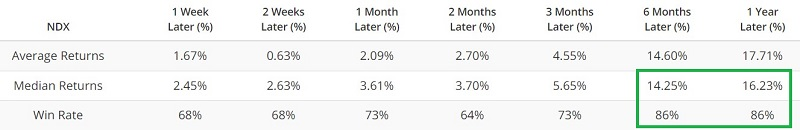
The chart below highlights all dates when the Nasdaq McClellan Oscillator dropped below -75 while the Nasdaq 100 Index was above its 200-day moving average. The latest signal occurred on 2023-08-17. Over the next six months, the NDX rose 86% of the time averaging +14.3%.
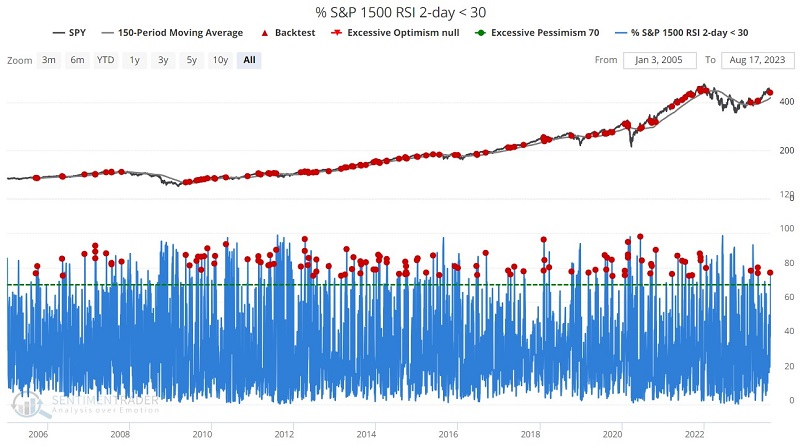
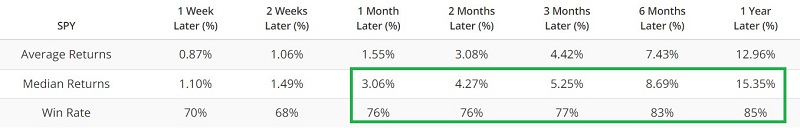
As the name implies, the % S&P 1500 RSI 2-day < 30 indicator measures the % of stocks in the S&P 1500 index showing a 2-day RSI of 30% or less. Like the indicators above, this one is best used as part of a weight of the evidence approach and not as a standalone indicator.
The chart below highlights all dates when this indicator was above 75 while the S&P 500 Index was above its 150-day moving average. The latest signal occurred on 2023-08-16. Again, it showed a consistent tendency to precede medium- to long-term gains, over and above a random return during the study period because it avoids most bear-market signals.
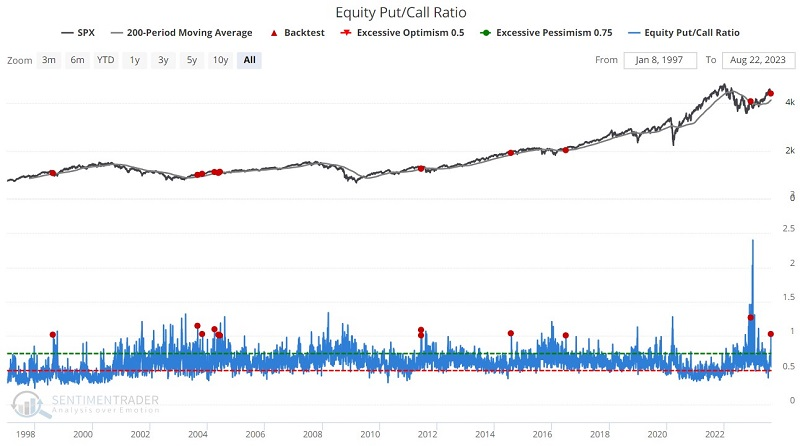
Jay followed up with a couple more indicators showing positive average returns after triggering readings like they did this week. It included the Equity Only Put/Call Ratio, which is the volume of puts divided by the volume of calls traded on individual equities on the CBOE (Chicago Board Options Exchange) on a given day. All index and ETF options (which are often used in hedging strategies) are ignored.
The chart below highlights all dates when the Equity Put/Call Ratio crossed above 1% while the S&P 500 Index was above its 200-day moving average.
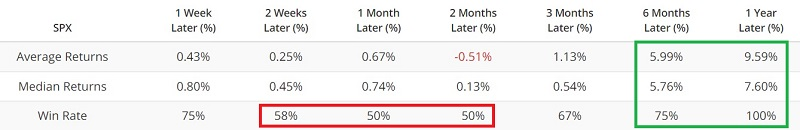
The results do not exactly "knock your socks off." Win Rates from 2 weeks to 2 months are essentially a coin flip. And while 6-month and 12-month Win Rates are 75% and 100%, respectively, the Median Returns are modest at +5.76% and +7.60%, respectively.
So, the results from this particular signal do not necessarily scream "buy signal." On the other hand, none of the previous signals were followed by a significant bear market.
If the oversold conditions don't work...
Jay showed that in case the market refused to bounce in the face of oversold conditions, options offer a relatively inexpensive way to protect some part of a larger portfolio during a major market decline.
A concerned investor who is hoping not to sell significant portions of their stock portfolio may be able to avail themselves of other opportunities. It must be emphasized that the examples that follow are just that - examples - and NOT recommended trades.
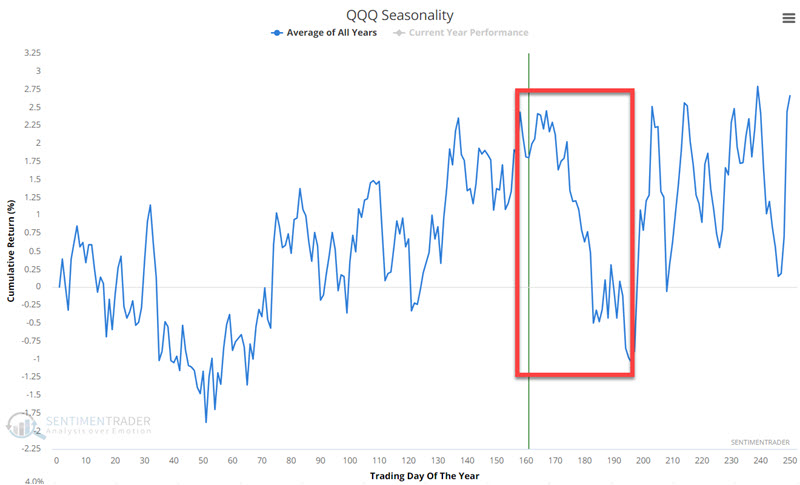
For our examples, we will focus on the Invesco QQQ Trust ETF (ticker QQQ), which is designed to track the performance of the Nasdaq 100 Index. The chart below displays the annual seasonal trend for QQQ, which shows the potential for seasonal weakness between now and roughly October 20th.
Let's consider some possible hedge examples. Before proceeding, note that our objective is to spend a relatively small amount to hedge against a significant market decline. This is different than trying to hedge the next 3% to 5% decline.
The most straightforward approach would be to buy a put option on QQQ. There are October options, which expire on October 20th - the end of the unfavorable seasonal window. While it seems logical to use October options, the concern is time decay - which means that every option will lose all of its time premium by expiration - which accelerates in the last 30 days prior to expiration. This can be very detrimental for traders who buy options. As a result, our examples will use November 2023 options that expire on November 17th.
Our first example involves buying the QQQ Nov17 2023 345 put @ $8.39. The risk curves for this position appear below (courtesy of Optionsanalysis.com).
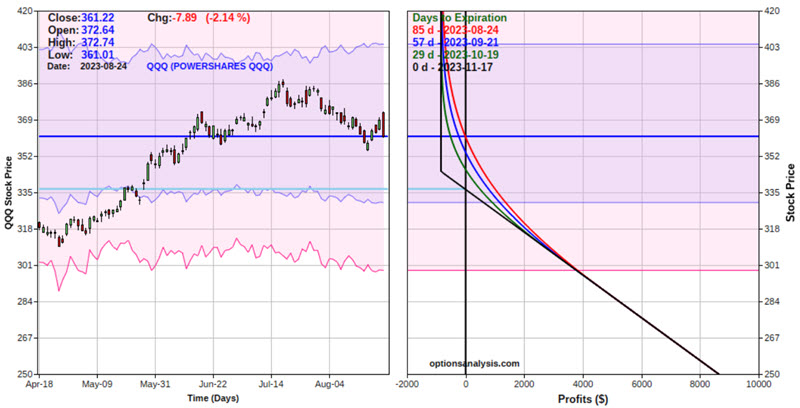
The cost to enter this trade is $839 for a 1-lot, and the breakeven price at November expiration (but remember we are only planning to hedge through October 20) is $366.61 basis QQQ shares.
Note that if the market collapsed and QQQ plummeted to $250 a share (again, NOT a prediction or even an inference), this position would show a gain of roughly $8,600. The bottom line: For a cost of $839, an investor could conceivably offset $8,600 worth of portfolio losses in the event of a market crash.
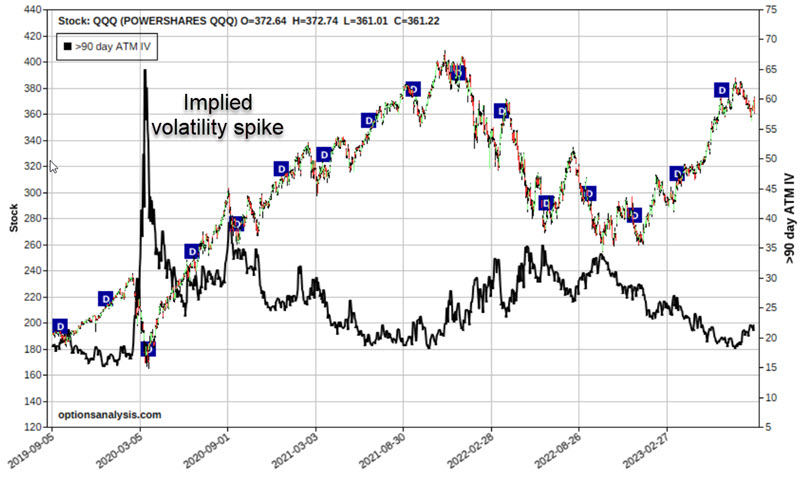
When the stock market declines - particularly when it declines swiftly - volatility almost invariably increases. In fact, the more swift the decline, typically the greater the spike in volatility. The chart below displays price action for ticker QQQ along with the implied volatility for QQQ options (black line). Note the huge spike in IV during the Covid crash of 2020.
Jay further outlined a more complicated hedging strategy, a butterfly spread, and went through the particulars of how that would compare to the put purchase in the event of QQQ falling and implied volatility rising.
A major breakout in the most important interest rate
Long-term interest rates have quickly risen again, which has had a ripple effect across markets from stocks to real estate, both foreign and domestic. Investors tend to be most concerned about potential impacts on the stock market.
Because we were mired in a multi-generational bear market in interest rates, it has been a long time since the yield on 10-year Treasuries reached a 10-year high for the first time in more than 200 sessions. It happened in June 2022, but before that, we'd have to go back to 1981.
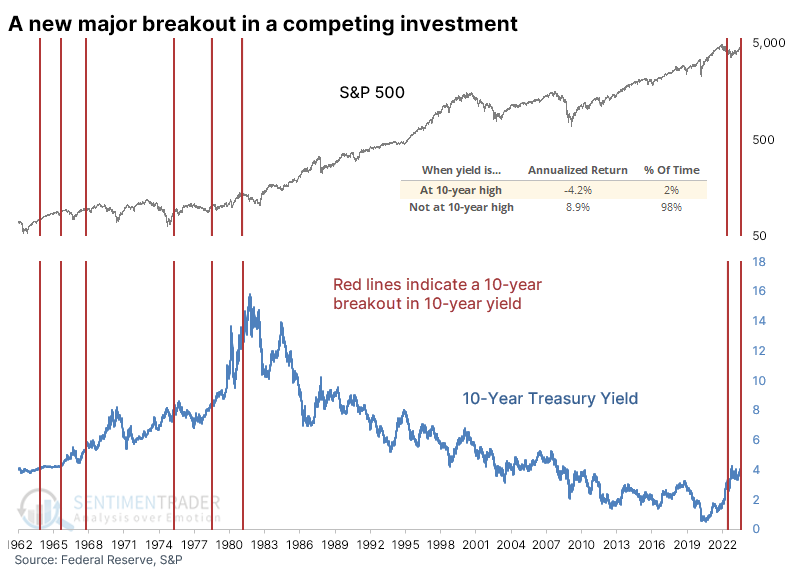
Over the past 60 years, when the 10-year yield was at a 10-year high, the S&P 500's annualized return was -4.2%, compared to +8.9% when the yield was not at a 10-year high. That's a distressing data point for stock investors, but almost all the days were concentrated among only a handful of distinct instances.
The table below shows returns in the S&P after the first decade-long breakout in 10-year yields in at least 200 sessions. The S&P rose consistently across all time frames and was higher every time six months later.
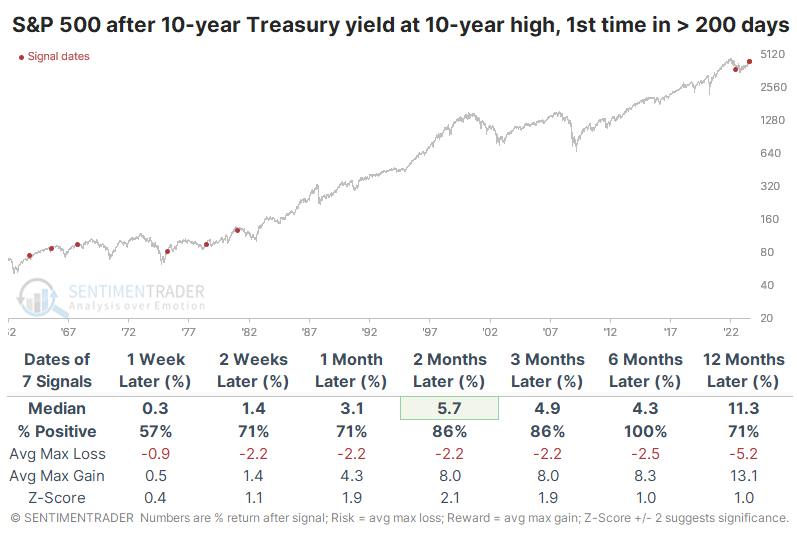
The table of maximum gains and losses across time frames shows that over the next six months, there was only one drawdown of more than -6.5% within the next six months, while all but one signal gained more than +6.5% over that time frame. Among sectors and factors, Small-caps enjoyed the best average returns over the next 3-6 months, with Value stocks, REITs, Financials, Industrials, and Discretionary stocks also putting in strong performances. Energy stocks showed the most robust 12-month returns.
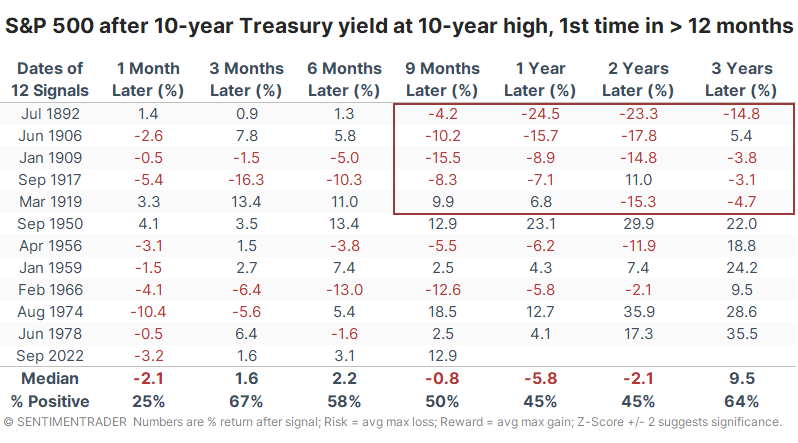
Using monthly closing data from Robert Shiller, we can go back to the 1870s and roughly approximate these conditions to generate a larger sample size. The table below shows long-term returns in the S&P after 10-year yields reached a 10-year high for the first time in at least 12 months.
Before the last six decades, stocks had a hard time showing gains following a big rate breakout. There were only a couple of rallies, while the rest mostly showed double-digit declines over the next year or two. Granted, during about half of these signals, the primary method of transportation was the horse, and more than half the country lacked indoor plumbing, so there's that.
Retail woes
Dean noted that the Optimism Indexes for several retail stocks plunged to some of the lowest levels in history. Similar sentiment extremes suggest further downside over the next few months.
Each night, Dean sorts the website's S&P 1500 Optimism Index table to research potential trade ideas. On Tuesday evening, the lowest three values for the Optimism Index pointed toward retail stocks: Dicks, Macy's, and Nordstrom's. Designed with a point-and-click interface that requires no programming skills, the Backtest Engine allows users to quickly and efficiently test trading ideas with our expansive library of indicators and models.
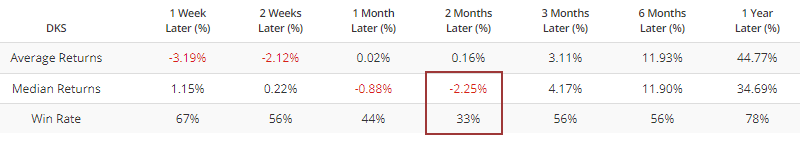
The Optimism Index for Dick's Sporting Goods (DKS) plunged to 0.75%, the lowest level since March 2020.
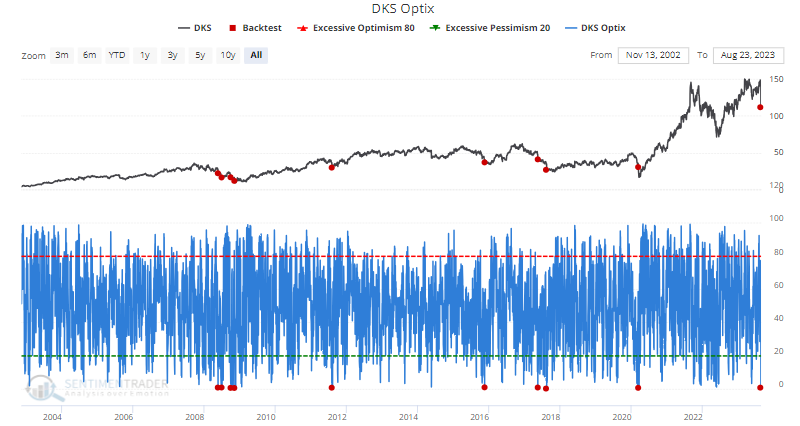
In the Backtest Engine parameters section, Dean applied an Optimism Index reading of 1% to give the signal some breathing room and use a holding period of 15 trading sessions. The plunge in the Optimism Index below 1% suggests Dick's (DKS) could mean revert higher in the first week. However, two months later, the stock was lower 67% of the time, with a median return of -2.25%.
 He also showed that Macy's (M) witnessed its Optimism Index drop to less than 1% for only the 11th time since 2000, and for only the 20th time since 1986, the Optimism Index for Nordstrom (JWN) plunged below 1.5%, the lowest level since August 2022.
Dean also pointed out that Dollar Tree, a discount retail store chain, plunged more than 12% after issuing a weaker-than-expected profit forecast. The downdraft in the stock sent the Optimism Index to the 20th lowest level in history.
Let's run a backtest engine study to assess the outlook for DLTR when the Optimism Index crosses below 1.5%.
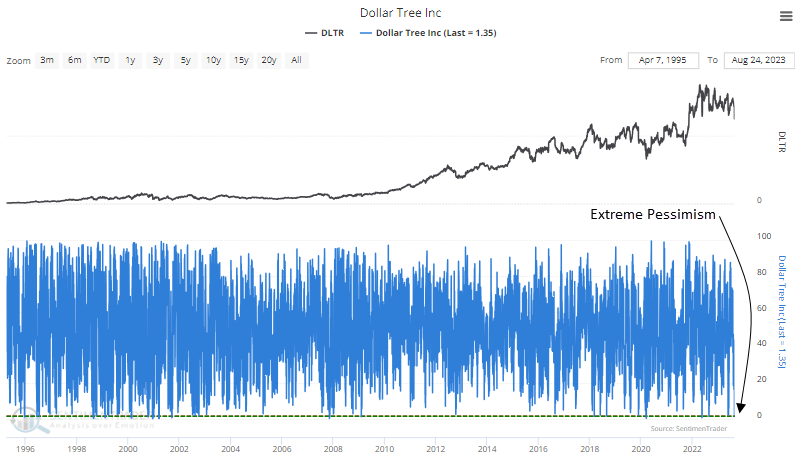
Designed with a user-friendly interface that requires no programming skills, backtest engine parameters can be quickly adjusted with a mouse click or stroke of a key. In the case of Dollar Tree, Dean applied an Optimism Index cross below 1.5% and a holding period of 15 trading sessions. We can see that the stock rallied after 11 out of 12 instances.
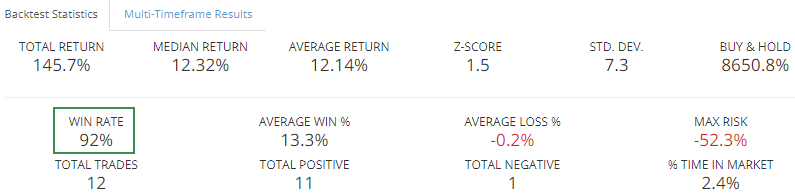
Multi-timeframe results suggest the stock could remain soft over the next week. However, from two to eight weeks later, Dollar Tree shows a solid tendency to bounce back, similar to our pre-defined holding period.
About TradingEdge Weekly...
The goal of TradingEdge Weekly is to summarize some of the research published to SentimenTrader over the past week. Sometimes there is a lot to digest, and this summary highlights the highest conviction or most compelling ideas we discussed. This is NOT the published research; rather, it pulls out some of the most relevant parts. It includes links to the published research for convenience, and if you don't subscribe to those products, it will present the options for access.