
TradingEdge Weekly for Aug 18 - Receding risk appetite among weaker trends, energy soars, dollar seasonals

Key points:
- The S&P 500 lost its 50-day average after a prolonged stretch above it
- Risk appetite is receding quickly
- Stocks soared even though leading economic indicators contracted sharply
- Energy stocks regained their long-term mojo
- Short-term trends in energy stocks have recovered as well, which has preceded even higher returns
- Chinese stocks reversed their overbought conditions in a historically quick manner
- Tech stocks in China have also quickly reversed their medium-term uptrends
- The U.S. dollar is facing a couple of tough seasonal cycles
- If the dollar does struggle, gold should benefit, and options even more
Losing a medium-term uptrend
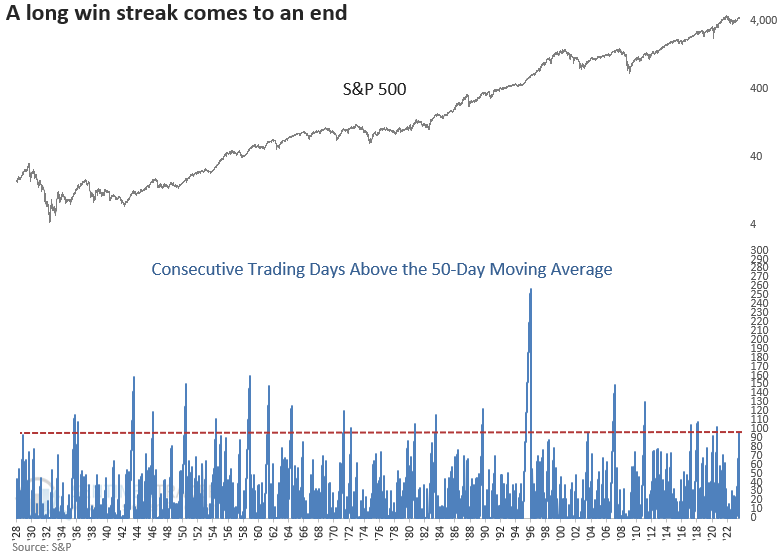
The most benchmarked index in the world lost its medium-term uptrend. Dean noted that the S&P 500 closed below its 50-day moving average after an extended period above the average.
The S&P 500 has crossed below its 50-day moving average 742 times since 1928. However, as we constantly emphasize in nearly every research note, context is critical when assessing historical patterns. This cross below its average occurred after registering at least 95 consecutive trading days above for only the 22nd time since 1928. The ability of a stock or index to sustain itself above a moving average for a prolonged period is indicative of bull markets, not bear markets.
In instances where the S&P 500 closed below its 50-day average after achieving at least 95 consecutive trading days above the average, the world's most benchmarked index tends to struggle in the very near term. However, three months later, the S&P 500 was higher 86% of the time.
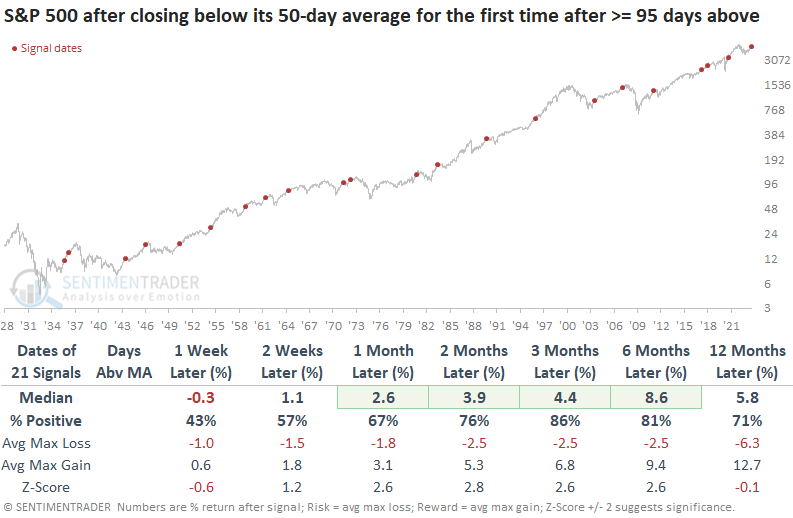
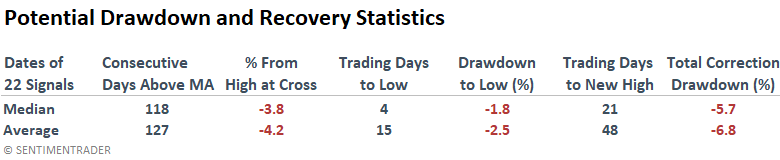
Corrections associated with a close below the 50-day average, similar to the present situation, show a median loss of -5.7% and an average loss of -6.8%. So, if history rhymes, a drawdown of a little over -6% could see the S&P 500 fall to roughly 4300, a reasonably typical bull market correction. The S&P 500's recovery to a new high after slipping beneath the 50-day average typically spans from one to two months later.
Risk appetite is waning, and fast
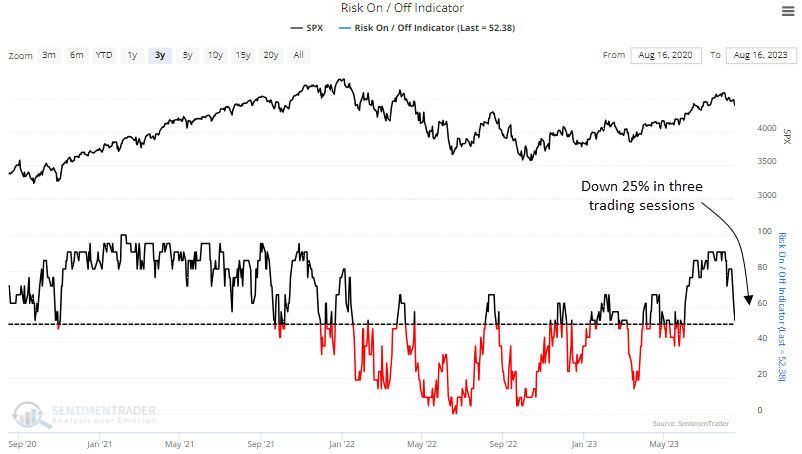
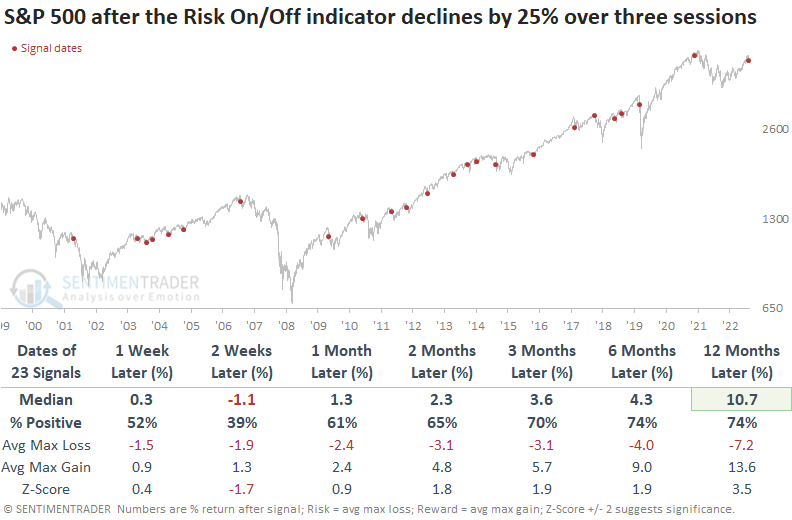
Dean showed that the SentimenTrader Risk On/Off Indicator declined by 25% over three trading sessions. Similar shifts in the composite led to weak returns for the S&P 500 over the next three weeks.
The model, a composite that measures the percentage of indicators considered to be risk-on, declined by more than a quarter in only a few sessions this past week, the quickest reversal in almost two years.
For context, Dean required the indicator to surpass the 90% threshold before a new alert could trigger again. Additionally, the composite must be under 55%, ensuring similar conditions to the current signal.
Whenever these conditions triggered, the S&P 500 typically faced challenges in the immediate future. The weakness was especially pronounced three days later, with the world's most benchmarked index declining 70% of the time. The ideal number of days to hold a short position in the S&P 500 turned out to be a holding period of 14 trading days, emphasizing the short-term nature of the alert.
It's important to remember that the signal required a reset above 90%, a level associated with uptrends in stocks. Because of this condition, the alert typically occurs within the context of a bull market correction. From two to twelve months later, S&P 500 returns were above the average return over the study period.
Not surprisingly, defensive sectors like Consumer Staples and Utilities outperform other sectors over the next few weeks, in line with their historical behavior in drawdowns.
Investors may have gotten ahead of themselves
Over the past six months, we've looked at various indicators that were getting a lot of attention. Because of the devastation of financial assets in 2022, investors were looking for any excuse to bail out of the rally off the lows.
One indication that investors have gotten ahead of the economy comes from the Conference Board's Leading Economic Index. It has stayed persistently weak even as stocks have rallied, which is unusual. Over the past 63 years, a strong positive correlation exists between the year-over-year change in LEI versus the S&P 500.
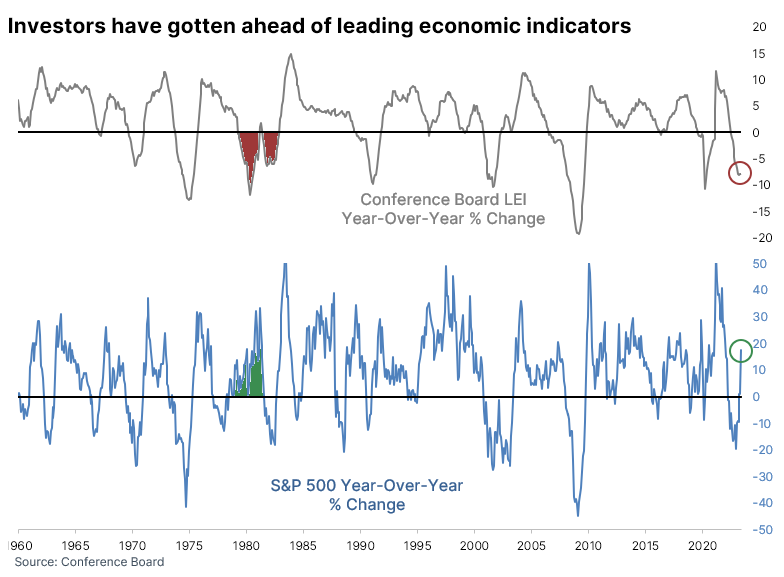
The only time since 1960 when the LEI declined by more than 5% over the past year, while the S&P 500 rallied more than 15%, was in 1980, extending into 1981. That did precede a rocky market, though multi-year returns were significantly better than average.
Let's broaden the parameters. When the LEI dropped by more than -5% while the S&P rallied by more than +5%, over the following nine months, the S&P sported a positive return after 22 of the 23 signals. If we focus only on the first instance in at least a year, returns still held up well. Every single one occurred as stocks were thrusting out of a significant decline or period of flat returns, and every single one led to gains over the next 9-24 months.
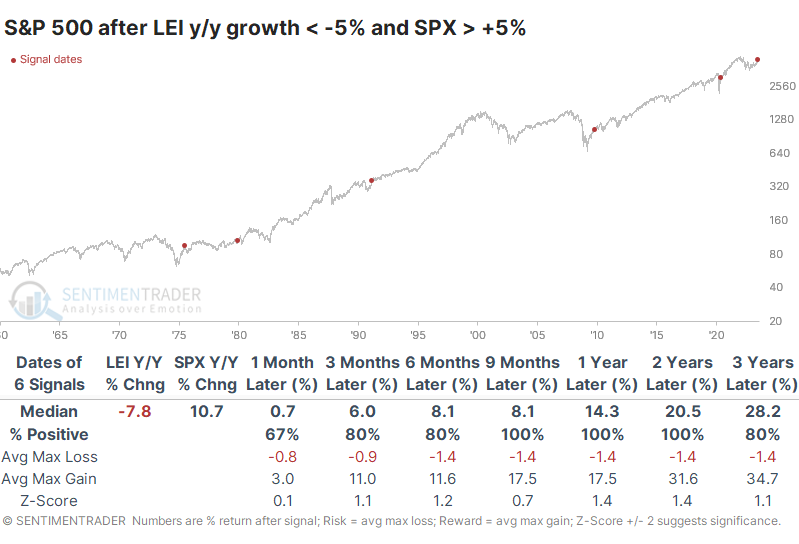
A table of maximum gains and losses across time frames shows that the former were substantial while the latter were limited. Up to three years later, the only one that showed more than a -10% pullback was in 1975.
Energy stocks have made a massive u-turn
Dean showed that the percentage of S&P 500 Energy stocks above their 200-day average cycled from < 15% to > 90% and similar reversals led to an 84% win rate over the subsequent six months, and the energy sector tended to outperform the broad market.
The percentage of S&P 500 Energy sector stocks above their 200-day moving average cycled from less than 15% to greater than 90% for the 26th time since 1954 and the second time since the energy bull market began in 2020.
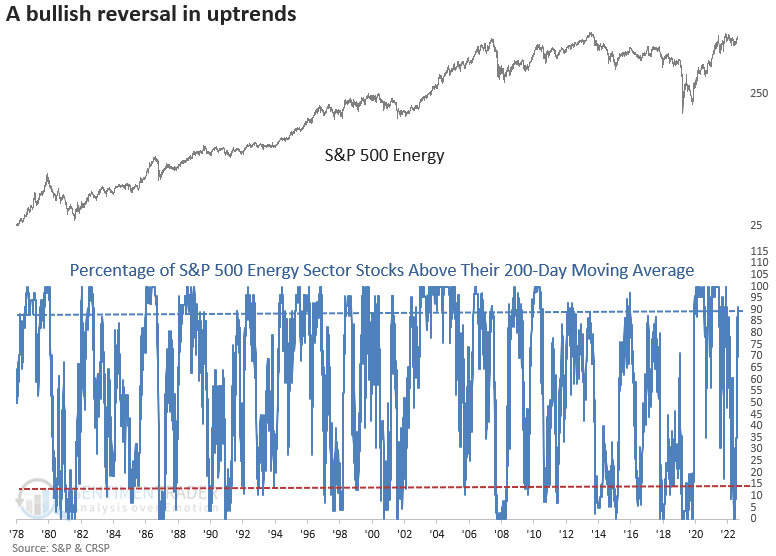
When the percentage of energy sector stocks above their 200-day average cycled from less than 15% to greater than 90%, the S&P 500 energy sector rallied over the next six months 84% of the time, though 14 out of the most recent 17 precedents registered a decline at some point within the first two weeks.
Over the next three months, the signal experienced only one max loss more significant than -10%. A year later, the max gain exceeded the max loss in 20 out of 25 cases.
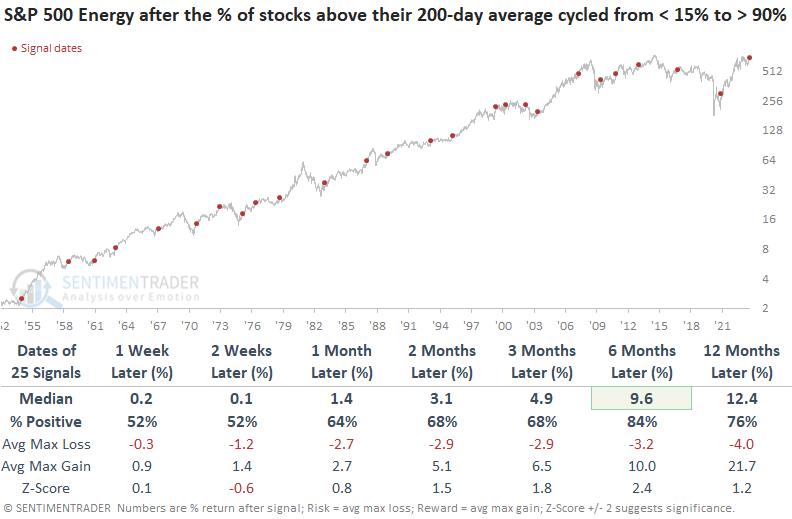
When comparing the S&P 500 energy sector returns to the S&P 500, energy outperformed the world's most benchmarked index across all time frames, although it wasn't overwhelming.
More energy stocks in medium-term uptrends, too
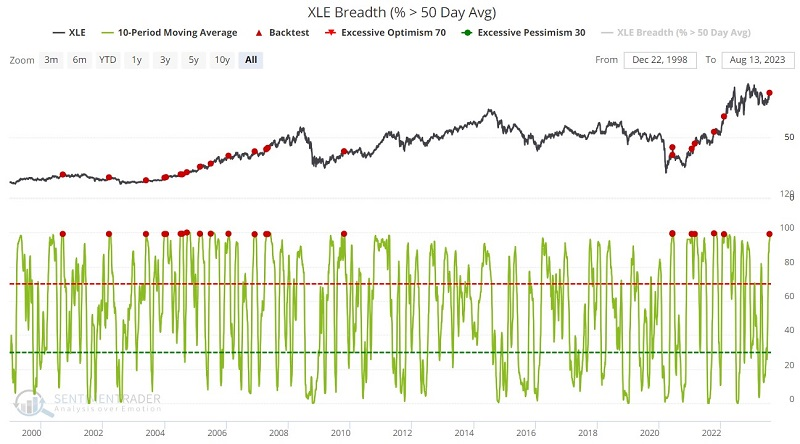
Jay also noted that the energy sector is showing strength, triggering favorable signals for 6 to 12 months out from several useful breadth indicators, though seasonality remains a potential concern through late October.
Several breadth indicators have given favorable signals. The chart below displays those times when the 10-day moving average of energy stocks above their 50-day moving averages crossed above 99%. The most recent signal occurred on 2023-08-03.
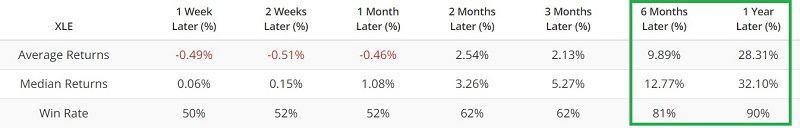
In the table above, we can note that twelve-month returns have been very robust. We can also note, however, that 1-week to 6-month returns have varied widely. Lastly, note that the 2000 and 2002 signals were followed by 12-month declines of over -20%, so significant twelve-month returns are never assured.
Jay looked at a couple of other indicators, both showing strength but in the case of the McClellan Summation Index, perhaps too much strength.
As always, seasonality is a summary of historical tendencies and not a roadmap. The chart below displays the annual seasonal trend for ticker XLE.
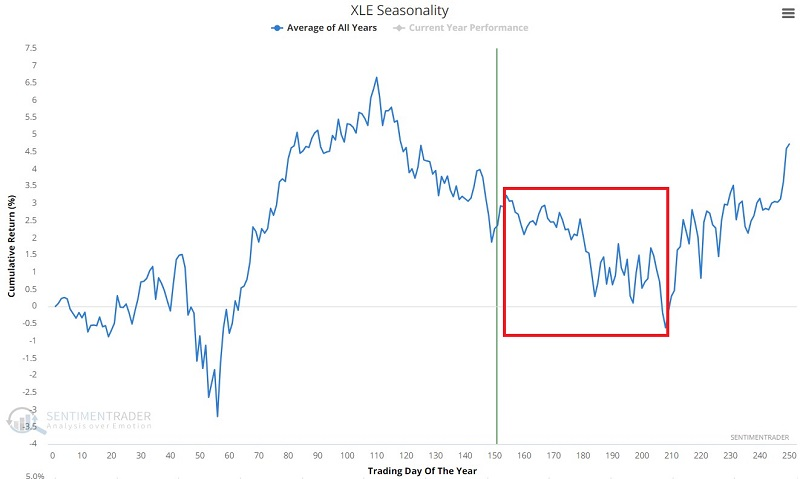
Note the upcoming unfavorable period that extends from the close on Trading Day of the Year (TDY) #154 through TDY #208. For 2023, this period extends from 2023-08-14 through 2023-10-30. Historical XLE performance during this seasonal period has been decidedly mixed but the cumulative result is a loss of -28.3%.
Selling China
A few markets continually disappoint investors. One of those is China.
Fundamental worries about that market are well-worn and not worth repeating. Most indicators we track for Chinese stocks are either neutral or modestly oversold, with nothing of particular interest. What is interesting, however, is how quickly the stocks in the Shanghai Composite reversed from their bout of optimism. The percentage of stocks in that index that were overbought briefly exceeded 15%, enough to be considered extreme. However, that plunged to fewer than 1% of stocks in under two weeks.
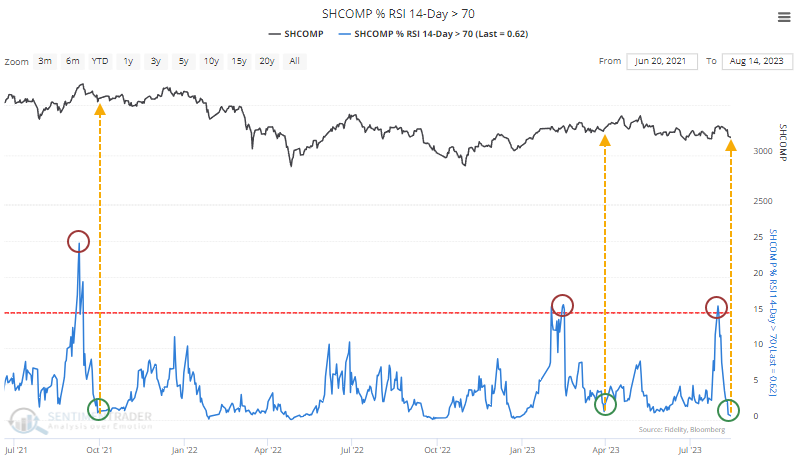
What makes the current situation unique is how quickly the overbought conditions reversed. Almost no members are currently overbought, while it wasn't even two weeks ago when more than 15% of them were. The last time the condition reversed this quickly was in 2018.
Again, this is a market that has a history of disappointing investors. It doesn't play by the same rules as most other global markets. After rapid reversals of overbought conditions - those that cycled within a couple of weeks - forward returns were poor. A month later, more than half the signals showed a positive return, but only three preceded double-digit gains. 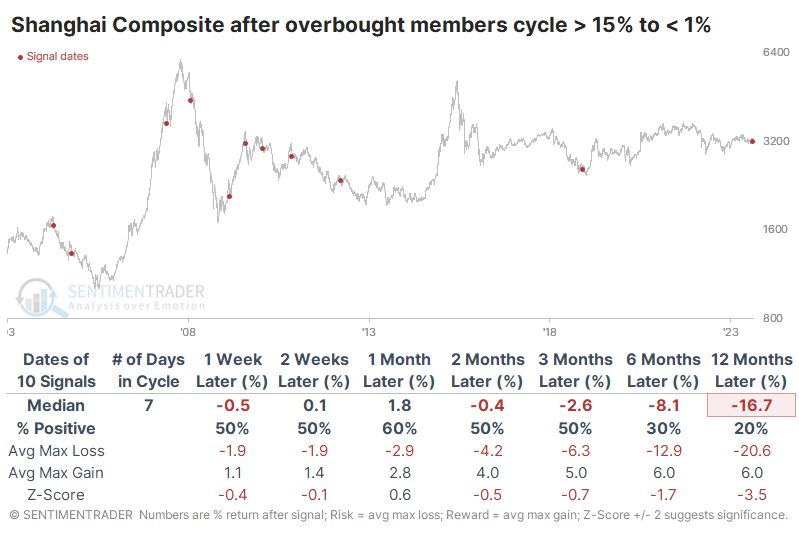
It's nearly impossible, maybe even literally impossible, to find a positive story about China in the media at the moment, especially in the U.S. Searching for "China" in The Wall Street Journal, here are keywords from the results: spillover, deflation, syndrome, problem, fraying, hurt, warning, uninsurable, weaken, struggles, worsening. And Bloomberg: fall, gloom, tough, alarm, contagion, losses, slumping, negative.
Similar bouts of "China is uninvestable" over the past two years have usually been good for intermediate bottoms in those stocks, but we're not seeing comparable levels of a washed-out market now that we saw then.
Chinese tech stocks are also suffering
Chinese technology companies are arguably even more of a focus for investors outside of that country due to their scale, market penetration, and historically cheap valuations. But it has been difficult for them to gain traction among investors domestic and foreign due to all the issues we hear about ad nauseam.
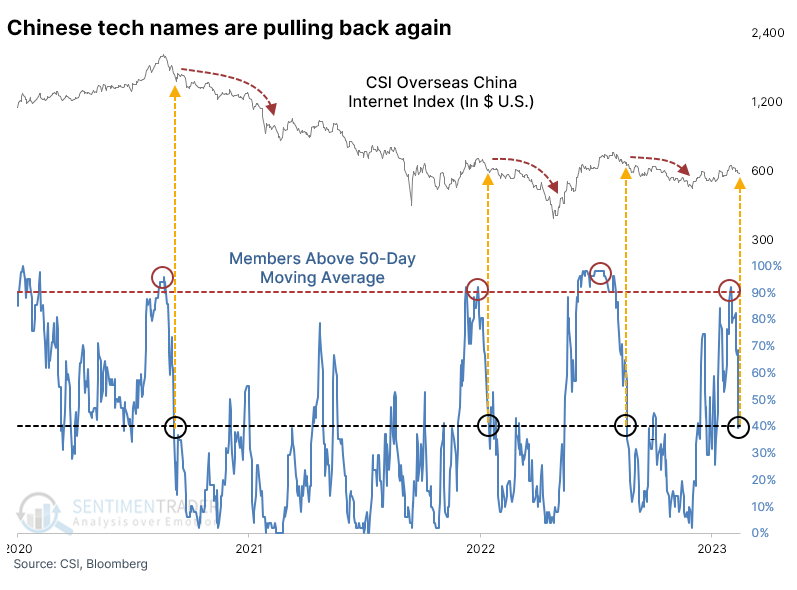
Among stocks in the CSI Overseas China Internet Index, upon which the KWEB fund is based, medium-term trends are quickly flipping from up to down. As recently as July 31, more than 90% of stocks in the index were above their 50-day moving average. That has since plunged to fewer than 40%. Since the sector peaked in 2020, there have been three similar cycles, and all preceded months more of pain.
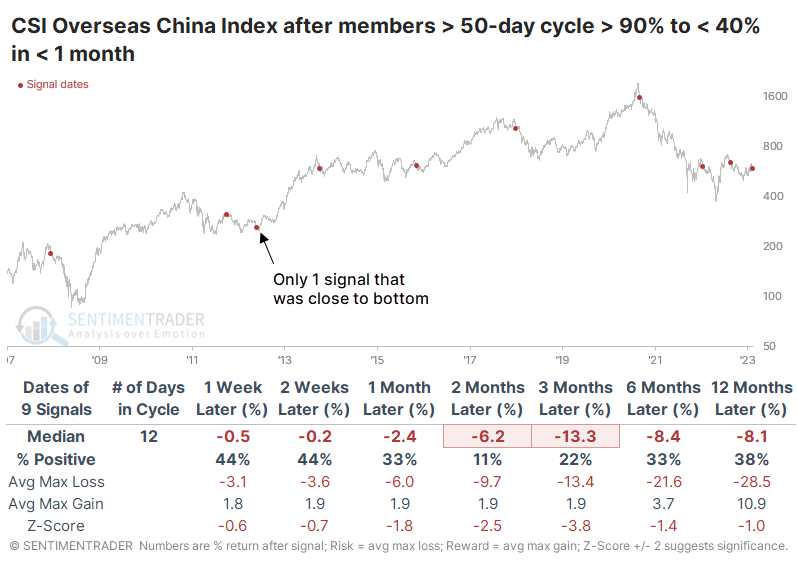
When sentiment on these names turns sour, it tends to persist. Over the next two months, the index rebounded only 41% of the time. Median returns and risk/reward ratios were poor across all time frames.
As we did earlier, let's focus on the quicker cycles, as often that provides a better clue as to how investors are reacting to the stocks' outlooks. And it's not good. This was the 2nd-fastest cycle from more than 90% of stocks above their averages to fewer than 40% - investors have abandoned ship at a historically rapid pace.
Unlike most other markets, quick shifts in sentiment have not consistently preceded rebounds. Out of the nine other times when investors behaved similarly, only one enjoyed a positive return either two or three months later.
It's hard to be positive about Chinese investments at the moment. Well, it's always hard, because there is a definite skew to the media thanks to geopolitical considerations, but this is harder than usual. They have been mired in a tough environment can rallies have not proved to be sustainable. When we've seen deterioration like we're seeing now, it has not been a good sign.
Potential dollar doldrums
Jay noted that the U.S. dollar has been advancing steadily since mid-July but the buck is entering a seasonally weak period and a longer-term cycle for the dollar remains unfavorable.
The chart below shows that USD is about to enter an unfavorable seasonal period. This period will last from the close on 2023-08-14 through 2023-10-23. The chart below displays the cumulative hypothetical $ gain/loss achieved by holding a long position in USD futures only from the close on Trading Day of the Year (TDY) #159 through the close on TDY #203.
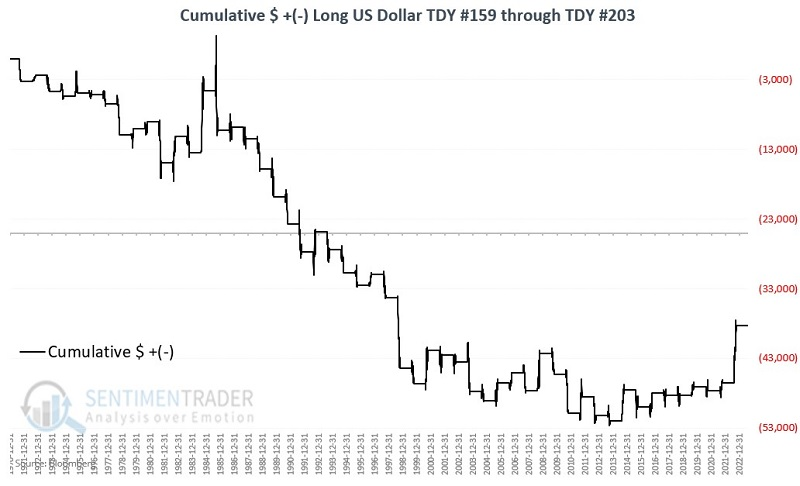
These seasonal windows sported a gain only 38% of the time, with a larger average loss than average gain. The dollar contract gained more than +$3,000 six times while losing more than -$3,000 thirteen times.
Many years ago, Jay discovered a 16-year cycle in the USD. Since March 1969, the U.S. dollar has alternated between eight unfavorable years and eight favorable years. The chart below displays cumulative $ +(-) for U.S. Dollar futures during favorable 8-year periods (black line) versus unfavorable 8-year periods (blue line)
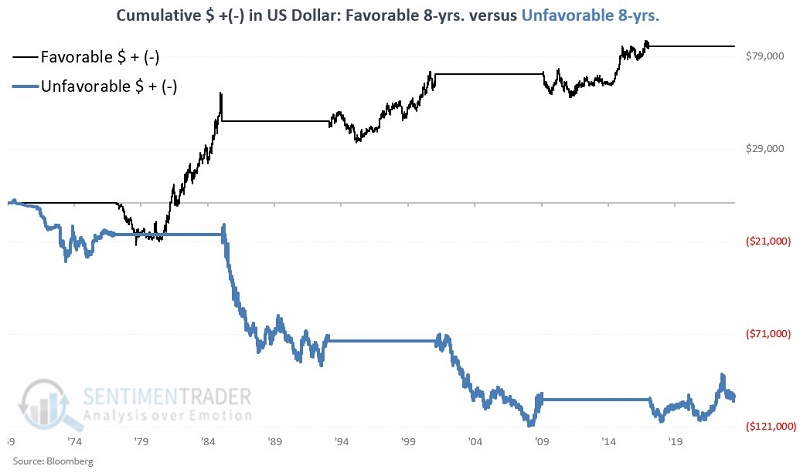
The critical thing to note is that the latest phase of this 16-year cycle is bearish on the USD from 2017-03-31 through 2025-03-31. The other key thing to note is that June through December of unfavorable 16-year cycle years has shown a strong tendency for weakness.
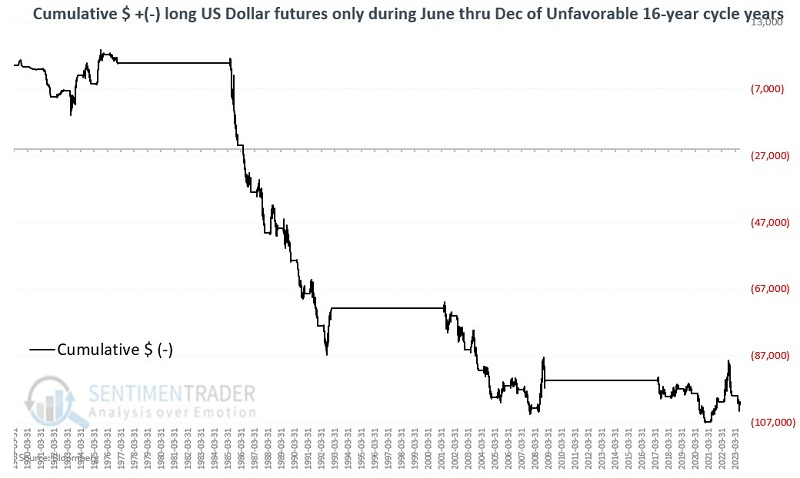
The chart below displays the hypothetical cumulative $ +(-) from holding a long position in U.S. Dollar futures only from June 1st through December 31st during unfavorable years. The cumulative hypothetical result so far is a loss of just over -$100,000. While this guarantees nothing, it strongly suggests an eye out for an opportunity to play the short side in the dollar between now and the end of the year.
If the dollar does fall, gold should benefit
Jay further showed that there is more than one way for gold bulls to participate in the gold market if the dollar should fall and gold should benefit. Buying shares of ticker GLD is one alternative - however, it can require a significant of cash. Options are an alternative.
The most straightforward approach for a bullish trader would be to buy gold futures. However, this entails unlimited risk and a great deal of leverage. So let's stick to an ETF alternative. The most straightforward approach there for a trader bullish on gold would be to buy 100 shares of the SPDR Gold Shares ETF (ticker GLD). As this is written, the cost to buy 100 shares would be $17,703.
The sticking point for a trader who thinks gold might rally is the outlay of $17K+ and the fact that that capital is tied up as long as the position is held. So let's consider a simple alternative.
As you can see in the chart below, gold is presently in a favorable seasonal period.
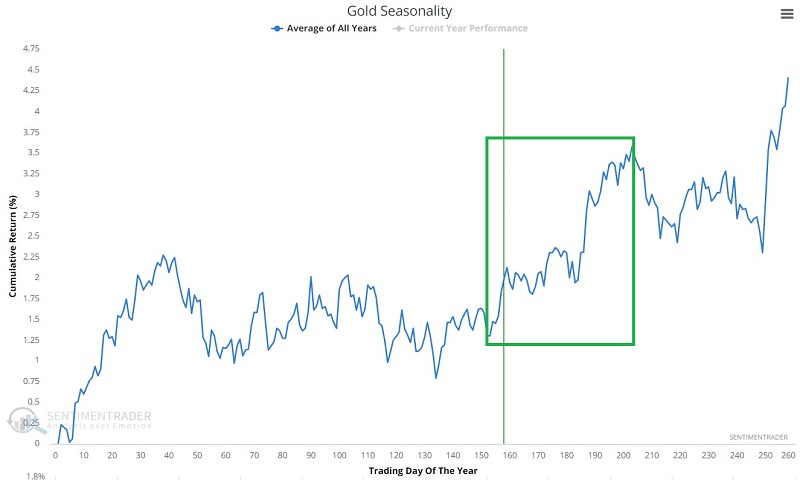
This does not in any way guarantee that gold is about to rally. But it does suggest a potential upward bias between now and mid-October. For a trader who wants exposure to the long side of gold but who also does not want to trade gold futures nor lay out almost $18K to buy 100 shares of GLD, one alternative is to buy a call option on ticker GLD as follows:
- Buy 2 GLD Oct20 2023 180 calls @ $3.00
The particulars for this trade and the risk curves (the expected $ gain or loss as of a given price for GLD as of a given date) appear below (courtesy of Optionsanalysis.com).
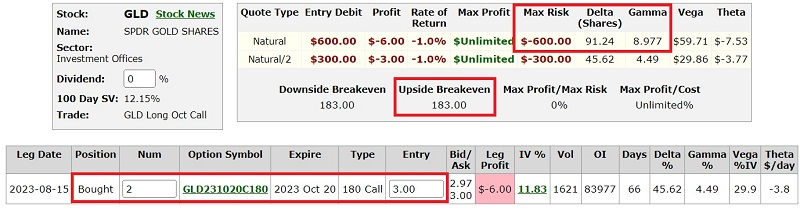
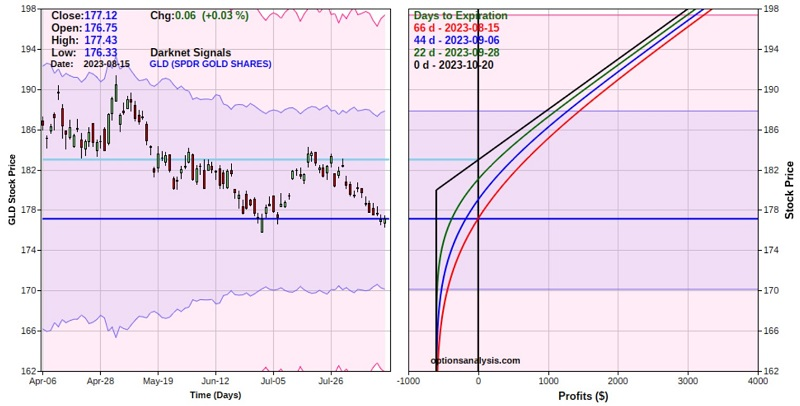
The cost to enter the trade - and the maximum risk - is $600 but it has unlimited profit potential between now and the October option expiration. The breakeven price is $183, so if held until October expiration, GLD must be above this price in order for this option position to show a profit. The position implies that it is roughly equivalent to holding long 91 shares of GLD.
The good news is that a trader buying this call option the trader has 91% as much upside potential as someone who bought 100 shares of GLD at 3.3% of the cost. The option trader also enjoys unlimited profit potential and limited risk but time is an issue.
Jay further outlined another options strategy, the 231 Butterfly Spread, and looked at its benefits versus the other strategies discussed.
About TradingEdge Weekly...
The goal of TradingEdge Weekly is to summarize some of the research published to SentimenTrader over the past week. Sometimes there is a lot to digest, and this summary highlights the highest conviction or most compelling ideas we discussed. This is NOT the published research; rather, it pulls out some of the most relevant parts. It includes links to the published research for convenience, and if you don't subscribe to those products, it will present the options for access.