
TradingEdge Weekly for Aug 12 - A bevy of breadth thrusts, returning confidence, not so precious metals

Key points:
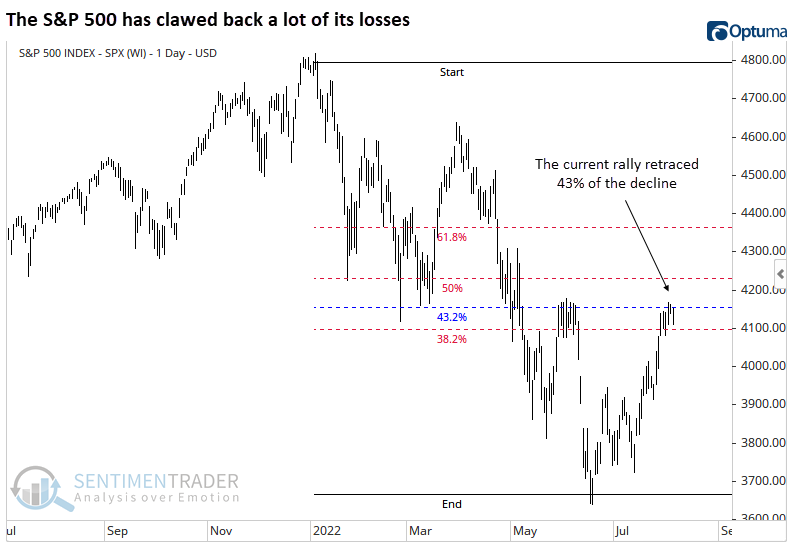
- The S&P 500 has enjoyed a retracement larger than most bear market rallies
- Even with the rally, corporate insiders are still buying
- Small-cap stocks have surged to the fore, a good sign for the broader market
- Financial stocks have surged, too
- A delayed breadth buy signal is now in effect
- Small options traders are betting on a rally again
- The Fear & Greed model has cycled from maximum fear to extreme Greed
- Using the ratio between copper and gold as a market signal
- Even Brazilian stocks have now joined the breadth thrust party
Probably not a "bear market rally"
It's hard to avoid the implication that the current rally in risky assets is bound to fail. From Wall Street strategists to financial media to the chattering masses on Twitter, there is very little conviction that stocks can hold onto their gains. According to a Bloomberg database of world media, the number of news articles mentioning a "bear market rally" hit a record in June.
The rally has been slower than the one in 2020 to unfold. As of Friday, the rally has gone 34 trading days, but it's still been impressive. Measuring from the S&P 500's last 52-week high to 52-week low, the index retraced more than 43% of its decline and stood more than 13% above its low.
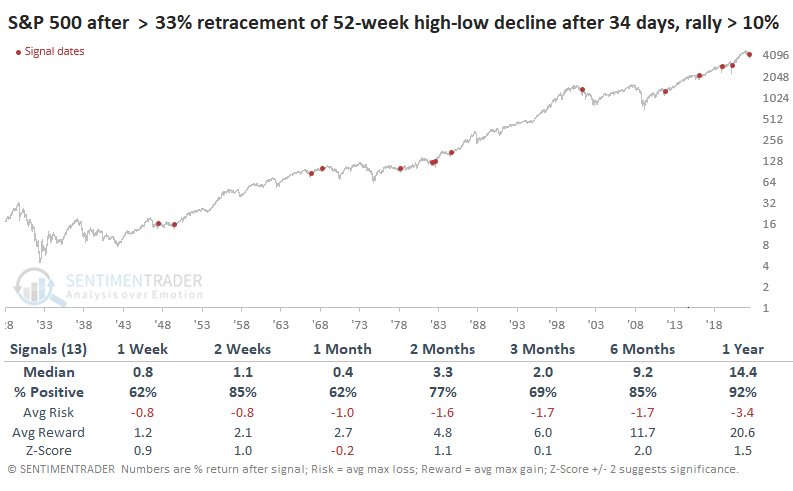
The table below shows every rally from a 52-week low when the S&P 500 retraced at least a third of its decline over 34 days. The index had to be at least 10% higher than its low. There was a failure in 2001, which is a concern; it was also the only one.
If we look at lesser rallies when the S&P retraced at least a third of its decline, but the rally was less than 10%, returns were much less impressive. The same goes for rallies when the index retraced less than a third of its decline after 34 days and rallied less than 10%. Again, a few of these coincided with long-term lows, but the S&P saw weakness over the next 3-6 months most of the time.
Insiders are still buying
Corporate insiders have been relatively optimistic for a while now, especially in technology shares. Jay noted that they haven't pulled back.
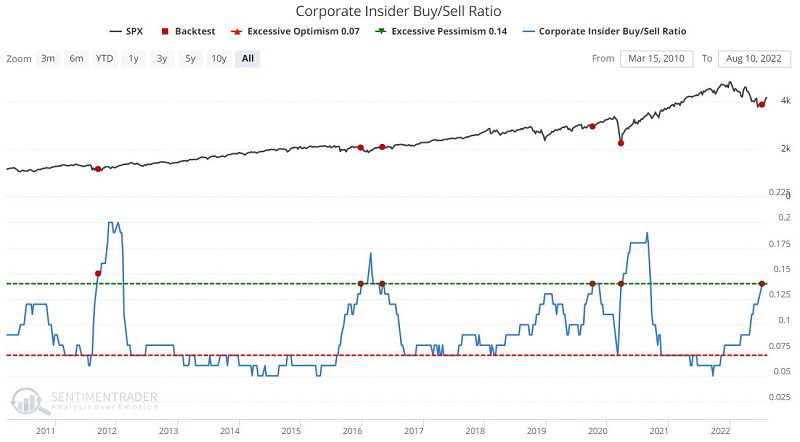
Buying picked up substantially as the market declined in 2022. The most favorable insider action is massive buying. However, it is also favorable when insider selling plummets to a relatively low level.
The chart and table below display those weeks when the Corporate Insider Buy/Sell Ratio crossed above 0.13 for the first time in four months. While the study period is dominated by a rising market, medium- to long-term returns were excellent and well above random.
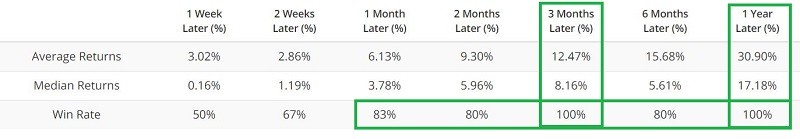
Corporate insider buying and selling should not be considered a precision market timing tool. Insiders tend to have a one-to-two-year timeframe. However, when you see a period of insider accumulation, as shown in the charts above, it tells you two things, 1) that insiders are anticipating improved fundamentals (higher sales and earnings), and 2) history suggests following their lead.
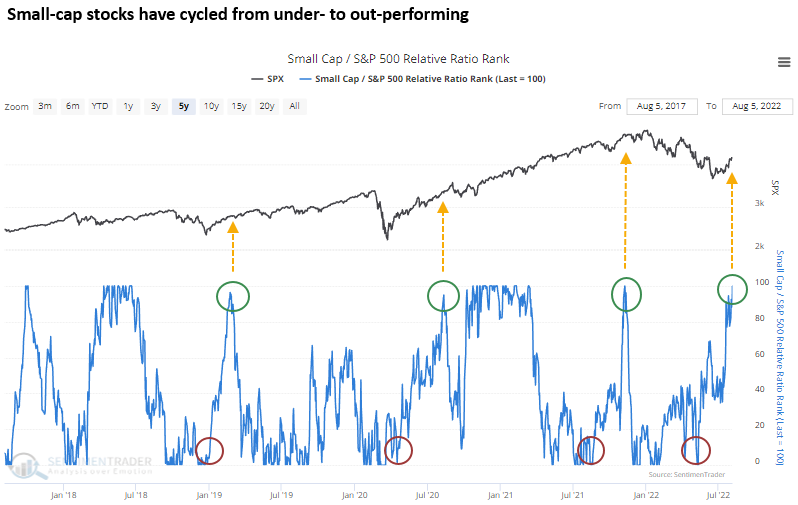
Small-caps surge to the fore
Since the June low, the Russell 2000 is up 16%, while the S&P 500 has managed to gain 13%. The outperformance by small-cap stocks is a welcome development.
Dean showed that a trading model that measures when small-cap stocks reverse from underperforming to outperforming relative to large-cap stocks issued a buy signal at the close of trading last Friday. The Small Cap/S&P 500 Relative Ratio Rank signal triggers when the 4-month range rank for the ratio between small and large stocks reverses from less than 1% to greater than 97%.
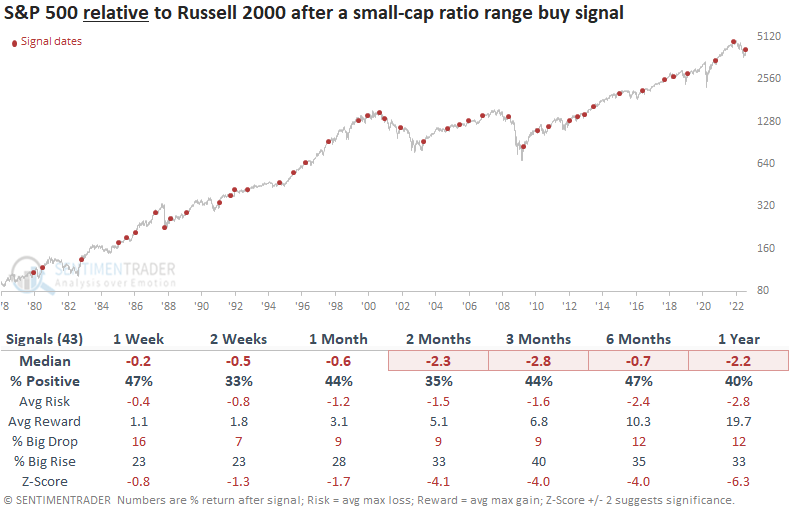
This model triggered a signal 43 other times over the past 43 years. After the others, large-cap stocks performed well across all time frames. Small-cap stocks also enjoyed robust results, with solid risk/reward profiles and z-scores across all time frames.
Looking at the net difference between S&P 500 and Russell 2000 returns, the outlook table suggests a more favorable environment for small-cap stocks.
Financials are surging, too
Dean showed why we now have additional evidence to suggest that the bear market could be transitioning to a cyclical uptrend as S&P 500 financial sector members at a 21-day high surged above 69% on Wednesday. 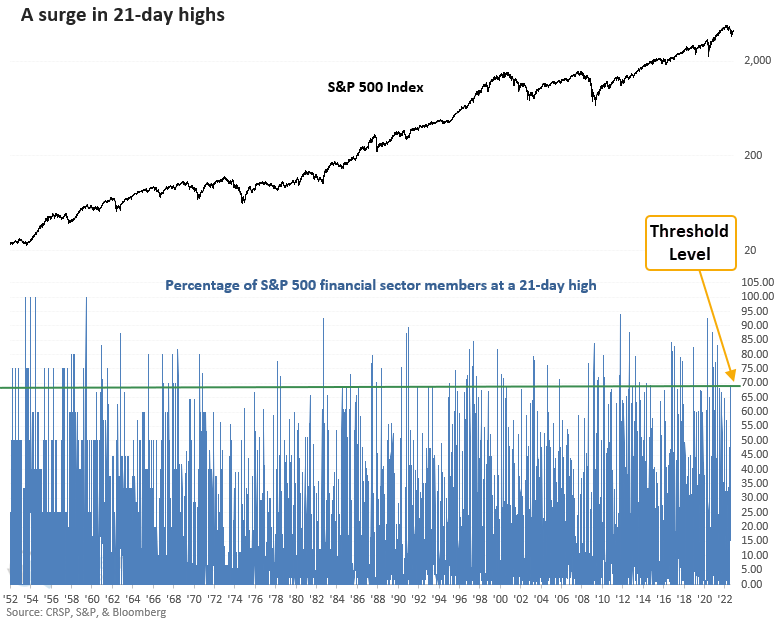
The study generated a signal 68 other times over the past 71 years. S&P 500 financial sector returns, win rates, and z-scores were excellent across all time frames, especially on a long-term basis.
Applying the signals to the S&P 500, the results look excellent across all time frames. So, what's good for financials is good for the broad market. Besides one untimely signal in 2008, the alert did an excellent job of avoiding whipsaw situations during bear markets.
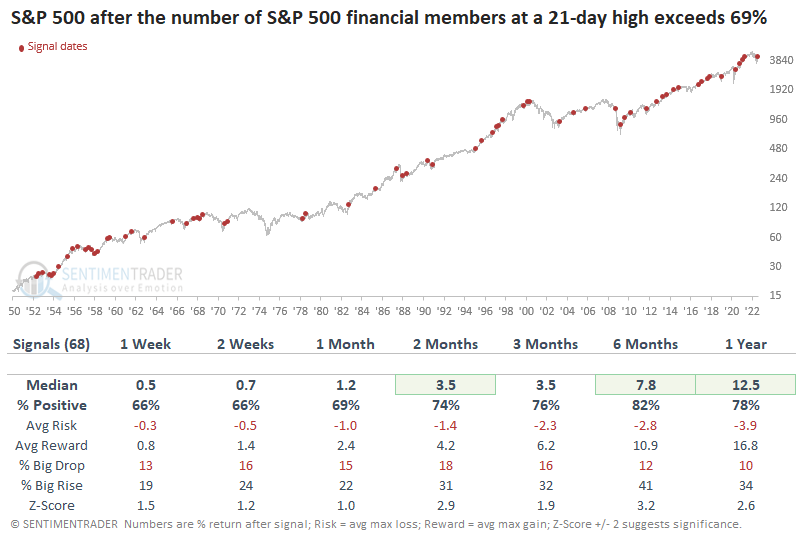
It was an even better sign when the percentage of financials at a 21-day high far outpaced 21-day highs across the broader S&P 500 index. Returns after those signals were even higher than in the original study.
A delayed breadth buy signal
Jay noted that stocks reached an oversold level in June, with fewer than 6% of S&P 500 stocks holding above their 50-day moving averages. Historically, the first two months after such a signal has witnessed a lot of volatility and some significant drawdowns.
But after the two-month mark, overall performance was decidedly favorable and that's where we are now. The chart and table below display historical results following all such signals - regardless of how close together they occur - using ticker SPY.
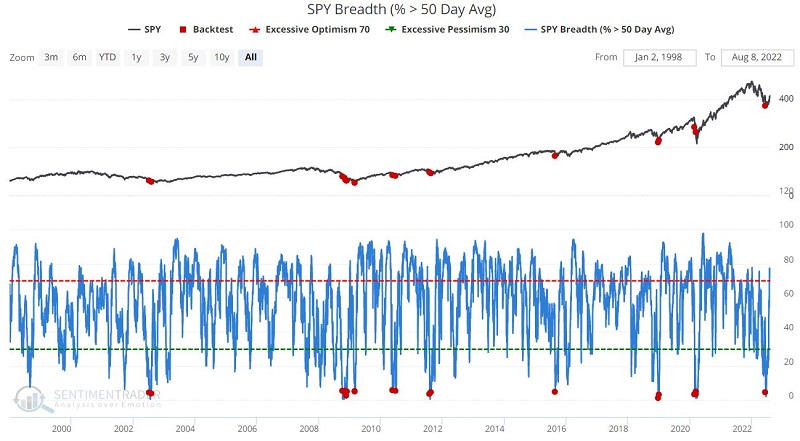
For our purposes:
- An initial signal occurs when SPY Breath (50-day avg) drops below 6 for the first time in twelve months
- For the 1st two months after an initial signal no position is held
- For months 3 through 12, hold ticker SPY
- Following any new signal that occurs within twelve months of an initial signal, the holding period is extended for another twelve months
Our Favorable Period extends from two months after the initial signal through twelve months after the initial signal - unless another signal occurred within that period, in which case the favorable period begins two months after the initial signal and ends twelve months after the last overlapping signal.
The chart below displays the cumulative % + (-) for SPY if held only during favorable periods.
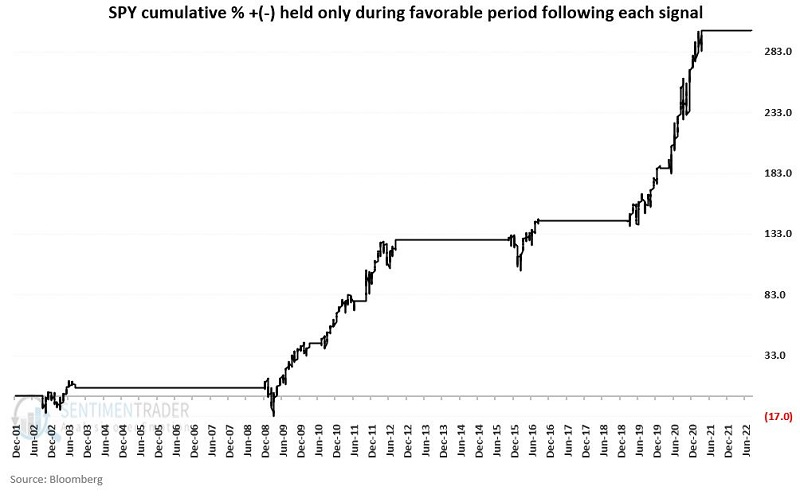
The most recent initial signal occurred on June 13. A new Favorable Period will begin at the close on August 12 and extend through at least June 13, 2023. If the indicator drops below 6% before that date, the Favorable Period will be extended another twelve months from that date.
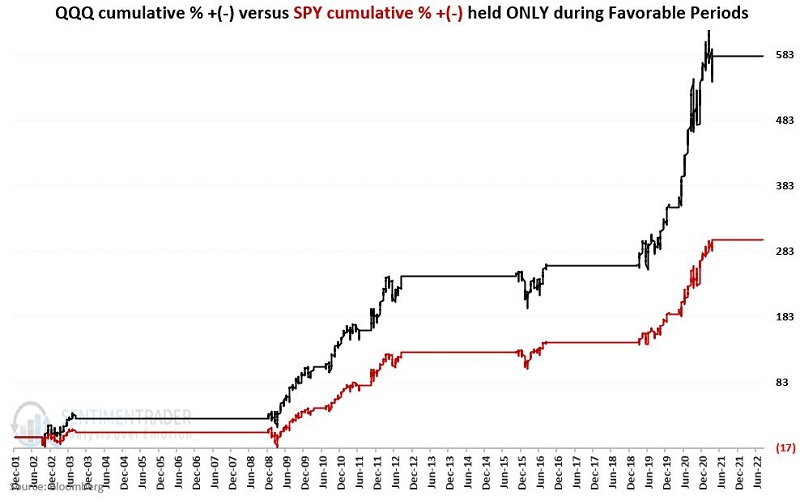
Jay followed up with more research showing that even though the signal is for the S&P 500, the Nasdaq 100 fund (QQQ), experienced better returns. It also suffered a larger drawdown during six favorable periods, but in six of seven Favorable Periods, QQQ experienced a significantly larger gain than SPY.
How big is the difference? The chart below displays the cumulative % gain for SPY and QQQ held only during Favorable Periods. The cumulative hypothetical return for QQQ was +580% versus +300% for SPY.
Small options traders come back
In June, small options traders placed near record-breaking bets against a stock rally. Apparently, last week was just too much. Small traders decided that they'd had enough, and they focused the most on call options since April.
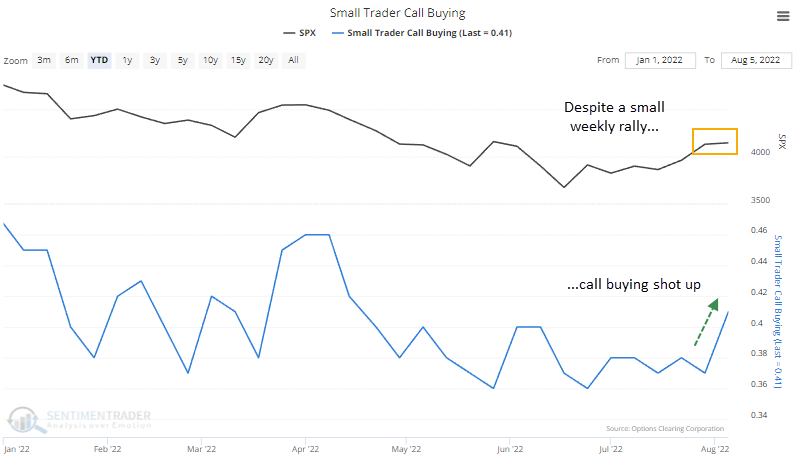
If we look at modest weekly rallies in the S&P 500, a gain of less than 1%, then last week marked one of the largest jumps in net speculative volume in 22 years.
A jump in speculative volume during only a small rally led to modestly negative returns for the S&P 500. Since 2006, it preceded a negative 3-6 month return every time but once. So, this is a bit of a concern.
Context is essential, though. As noted in June, small traders were panicking and spent the most on bearish bets relative to bullish ones since the financial crisis. Each time they spent more to hedge against a crash than bet on a rally, it coincided with the end games of bear markets.
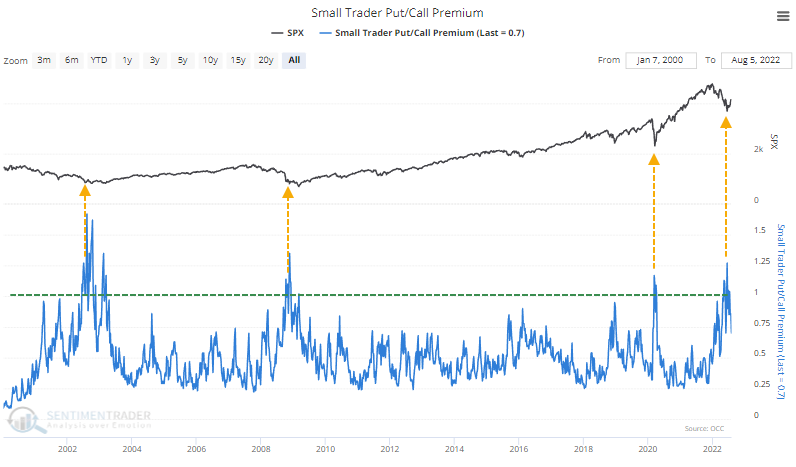
Those bets have since melted off. When that happened in 2020, stocks continued to shoot higher. In 2002, a similar cycle marked the peak of the initial thrust off the low. The S&P then spent the next couple of months testing the low as traders renewed their bets against stocks. In 2008, something similar occurred. By the time bearish bets rolled off, stocks had peaked and then headed back down to test (and violate) the prior low before the ultimate bottom occurred.
A return to Greed
One of our models has recovered enough to suggest that investors have become greedy.
The Fear & Greed Model, based on the inputs published by CNN, has entered excessive optimism territory. Over the past 24 years, the S&P 500 has returned an annualized -0.3% when the model is above 80%.
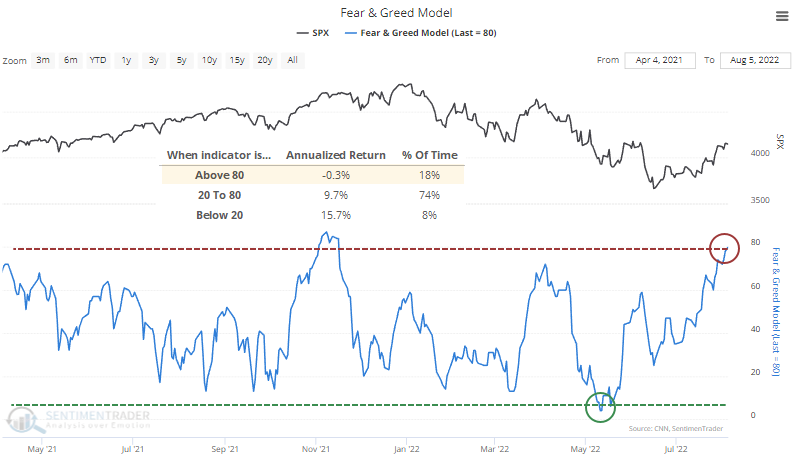
Note that our figures will differ from the one published on CNN. We use different inputs for the put/call ratio and, more importantly, junk bond spreads. But the general inputs and model calculations are essentially the same.
The current level of optimism comes after what was, for all intents and purposes, maximum pessimism in May when the model fell below 5%. It has cycled from near-maximum pessimism to optimism seven other times when the S&P 500 was below its 200-day average.
During the failed bear market rallies, the index saw weakness almost immediately. During the bull markets ones, it didn't. The Risk/Reward Table highlights this further. After all the failed signals, the S&P never gained more than 3.5% at any point in the month following the first 80% reading. After all the successful signals, it rallied at least 3.5% each time.
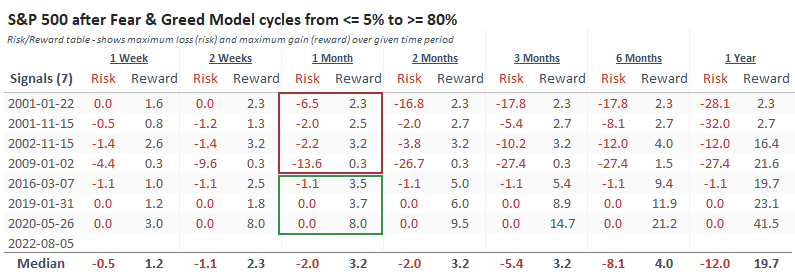
So, that's a good test here. If stocks can gain more than a few percent in the coming weeks, it will suggest a bull market.
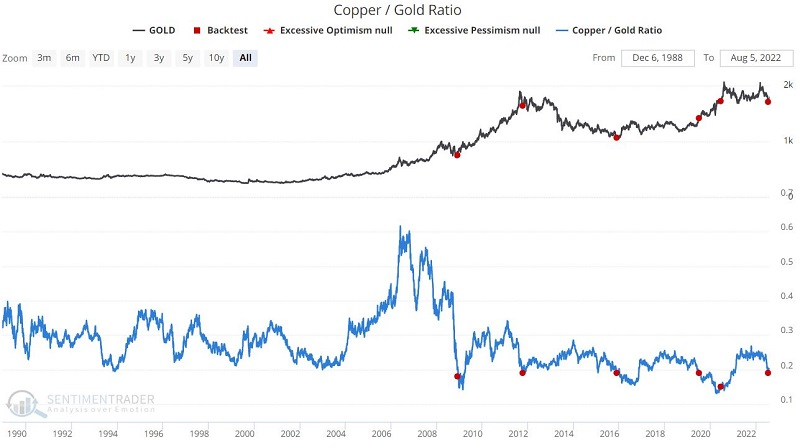
Using copper versus gold as a market proxy
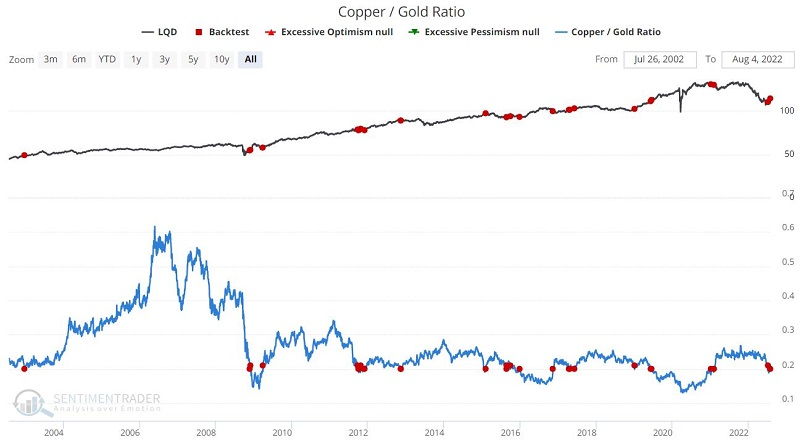
The Copper/Gold Ratio (CGR) measures the relationship between industrial metals and precious metals. Jay showed that certain actions by this ratio have often presaged significant turning points in a variety of markets.
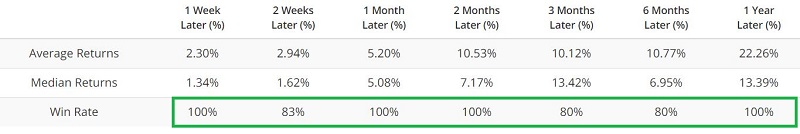
The chart and table below display the performance of gold when the Copper/Gold Ratio dropped below 0.19 for the first time in a year. It rallied each time.
Typically, investment grade bond performance is more closely correlated to interest rate movements, and high-yield bond performance is more closely correlated to stock market performance. However, when it comes to the Copper/Gold Ratio, the same signal similarly affects high-grade and low-grade corporate bonds.
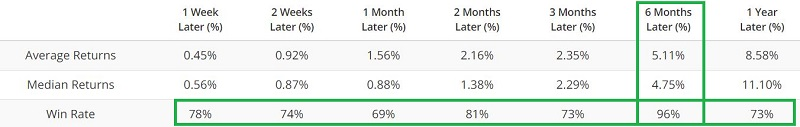
The chart and table below display the performance for ticker LQD (iShares iBoxx $ Investment Grade Corporate Bond ETF) when the Copper/Gold Ratio crossed above 0.20. Again, very positive results.
Even Brazilian stocks are surging
In the last week, some bullish signals have started to pop up for a few emerging market countries. Dean noted that now Brazil has joined the party with several breadth-based thrust alerts.
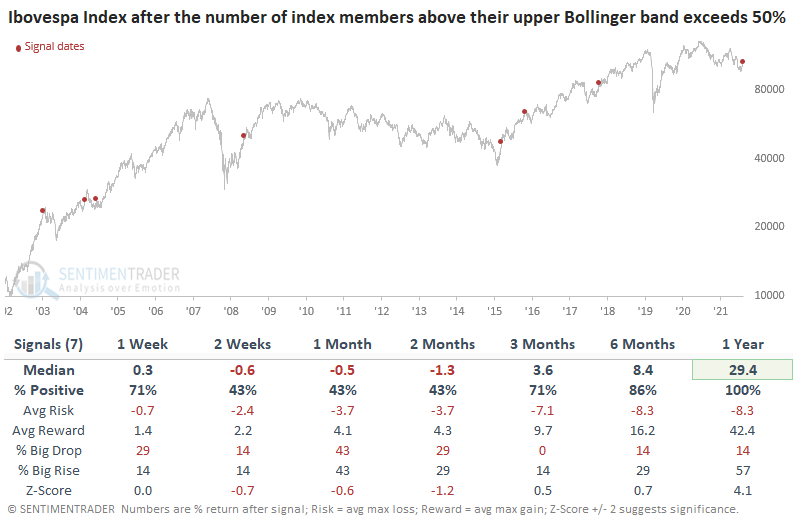
Ibovespa Index members trading above their upper Bollinger band surged to the third highest level in history last week. Historically, an increase of this magnitude only occurs in uptrends.
This indicator generated a signal seven other times over the past 18 years. The near-term picture looks unfavorable as the Ibovespa tends to work off the overbought condition. A year later, the signal shows a perfect record. The odds of a potential trend change look compelling.
Also, Ibovespa Index members registering a 4-week high surged above 64% last week. Typically, an increase above 60% only occurs in uptrends or at the outset of a multi-month countertrend move. This one generated a signal 19 other times over the past 19 years. Forward returns, win rates, and z-scores look favorable, especially in the six and 12-month periods.
About TradingEdge Weekly...
The goal of TradingEdge Weekly is to summarize the research published to SentimenTrader over the past week. Sometimes there is a lot to digest and this summary is meant to highlight the highest conviction or most compelling ideas we discussed. This is NOT the full research that's published, rather it pulls out some of the most relevant parts. It includes links to the published research for convenience; if you don't subscribe to those products it will present the options for access.