
TradingEdge Weekly for Apr 3 - Nasdaq correction, VIX breakout, breadth exhaustion, financial sector washout, Q1 performance implications

Key points:
- Nasdaq 100 enters correction territory with VXN double-spike signaling potential capitulation bottom
- VIX crosses 30 after 232-day streak below threshold, historically favoring buyers but with structural caveats
- S&P 500 breadth collapses below 20% with 7-month low pattern suggesting exhaustion over initiation
- XLF breadth hits zero with historically strong forward returns for broader market and select sectors
- Technology triggers Optix buy signal with 87% win rate when combined with Composite Washout Model
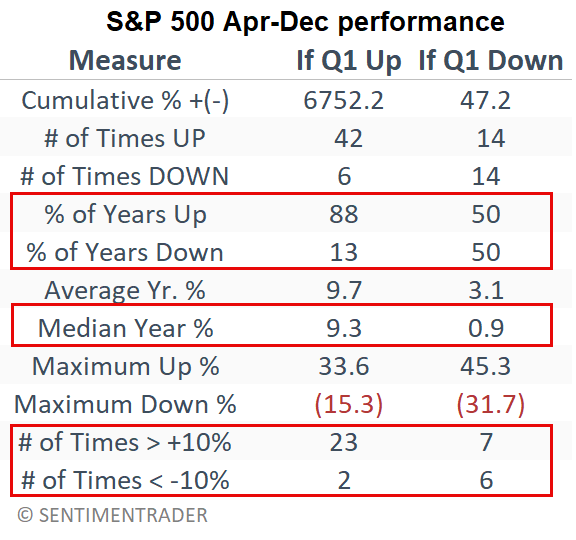
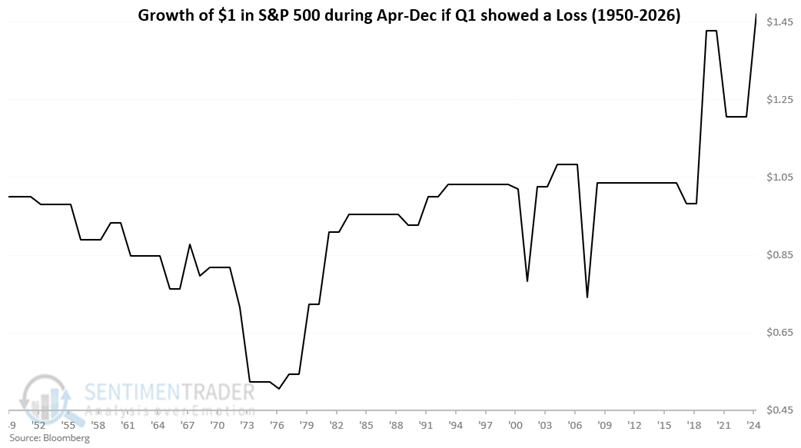
- Negative Q1 2026 shifts historical odds for remainder of year from 88% to 50% win rate
- S&P 500 five straight down weeks moderates expectations with subpar forward returns
House view:
- Stocks:
- Short-term: Bearish. The core conflict lies in the sharp clash between geopolitical signals and technical support. Early this week, simultaneous signals of a ceasefire from both the U.S. and Iran, coupled with a rebound in oversold technical indicators, drove a rally in the three major indices. However, U.S. equities remain in a state of deep technical breakdown, with all three major indices confirming a bearish trend amid renewed Middle East geopolitical panic. The S&P 500 closes at 6,582.69, holding firmly below its 200-day moving average (6,644.60) and 50-day moving average (6,783.63), with only 29.82% of constituents trading above their 50-day MA signaling extremely poor market breadth. Furthermore, the highly anticipated March U.S. Nonfarm Payrolls (NFP) report is scheduled for release on April 3 (Good Friday), during a market holiday. Any data that deviates from expectations-whether positive or negative-is likely to trigger sharp volatility in the futures market amid extremely low liquidity.
- Intermediate-term: Bearish. Market momentum continues to weaken and is now in a risk-off state. The stagflation trade is in full force, with a toxic "higher oil prices + higher for longer rates" combo creating sustained downside pressure on equity valuations. The Fed has no room for rate cuts amid resurgent inflation from energy cost spikes, removing the key policy backstop for markets. Sector divergence is extreme: energy (XLE) remains the only absolute winner (up ~30% YTD), while tech (XLK), financials (XLF), and healthcare (XLV) remain in deep drawdowns. This time frame covers 1-5 months.
- Long-term: Bearish. The long-term bull market structure has been invalidated by the sustained break below the 200-day moving average, the critical bull-bear lifeline. There is no long-term bullish edge until indices reclaim the 200-day MA with sustained volume, and the geopolitical-driven stagflation risk backdrop abates. This time frame covers 6-12 months.
- Overweight: High levels of U.S. dollar cash, short-duration safe-haven assets
- Energy and inflation-hedge sectors are the only areas with relative outperformance in the stagflation regime
- Underweight: High-valuation tech stocks, interest-sensitive financials, and consumer cyclicals most exposed to energy cost inflation and demand destruction
- Bonds: Long-term cycles remain bearish. A painful "stock-bond dual selloff" regime remains entrenched, with the spread between 10-year and 2-year Treasury yields remaining at +52 basis points. The traditional flight-to-safety dynamic has broken down completely: spiking oil prices have convinced the bond market that entrenched inflation will force the Fed to maintain high interest rates for an extended period, with investors demanding higher inflation risk premiums for long-dated debt.
- Commodities: Extreme divergence defines the complex, with geopolitical risk driving a historic surge in oil while precious metals suffer a counterintuitive collapse. The crude surges 11%-12% to 111.54, breaking decisively above the $100 psychological level. Trump's threat of imminent military action against Iran has reignited fears of a prolonged closure of the Strait of Hormuz, with the geopolitical "war premium" expanding rapidly amid escalating conflict risks. The gold crashes 1.7% to $4,676.76, while silver plummets 2.75% to $73.01, completely failing to act as a safe haven amid geopolitical turmoil. Spiking oil prices have triggered a jump in Treasury yields and the U.S. dollar index, drastically increasing the holding cost of non-yielding precious metals and triggering a stampede of long position liquidations.
- Crypto: We follow several simple systems for U.S.-traded bitcoin, which we consider the equivalent of the S&P 500 for crypto. Amid the market's paradigm shift to real assets and fiat credit doubts, crypto assets face valuation revaluation pressure from tech stock sell-off contagion, but long-term fundamental support from tokenization remains. Market volatility rises with the overall financial market, and short-term price performance is dominated by risk appetite shifts, with structural opportunities tied to institutional adoption and underlying technology innovation.
- Triple 40: Bearish
- RSI Momentum: Bearish
- Trend and Relative Trend: Bearish
- PMI: Bullish
- M2 ROC: Bullish
- Notable Moves in Global Markets:
- Europe: Major European stock indices followed a "rally-then-pullback" pattern, driven primarily by a reversal in signals regarding U.S.-Iran tensions and volatility in energy prices. The region's extreme reliance on Middle Eastern energy imports leaves it acutely vulnerable to oil and gas price spikes, with industrial manufacturing, aviation, and logistics sectors hit hardest by the collapse of ceasefire hopes.
Where we're at
Most investors have the most riding on equities. We feel that the most significant determinants of success for investors are whether to adjust their allocation to that asset class based on factors that have historically had a good record of preceding above- or below-random returns in the months ahead.
Those factors include the probability of a looming recession, sentiment, price action, volatility, breadth, and the bond market. The chart below summarizes the main indicators and composite models we watch for those factors, and they're mostly in bullish regimes. Valuations are not part of these factors since the relationship has been too inconsistent on time frames under one year.
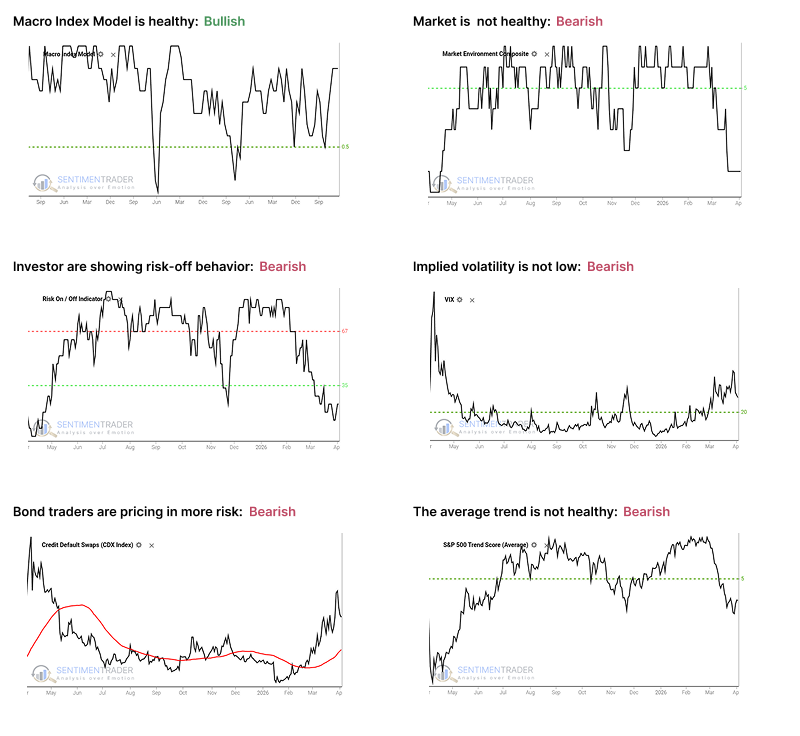
- The Macro Index Model is above the 50% threshold, which has been a vital level as outlined here.
- The Market Environment has been skittish since April, and has slipped into an unhealthy condition. Future returns, especially for higher-beta indices, have historically been notably weaker, with greater risk, when the environment is unhealthy as outlined here.
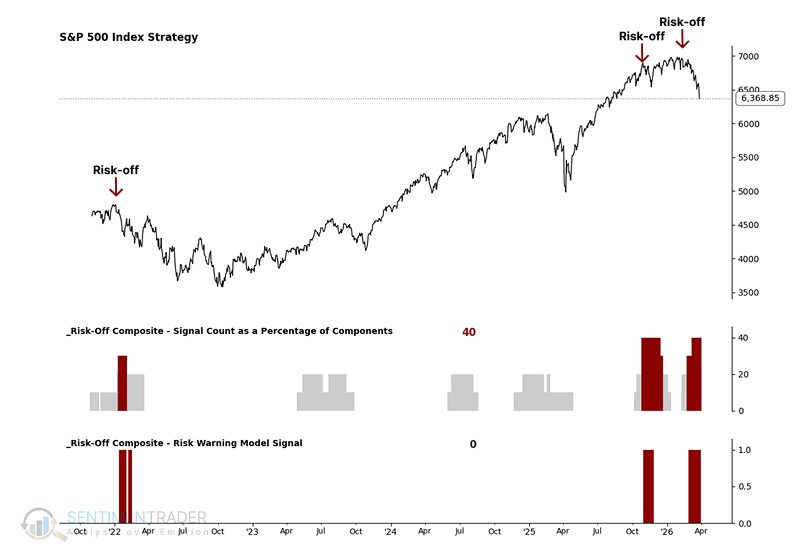
- The Risk On / Off Indicator shows that investors are now in risk-off mode. This has historically been a warning sign for weak future returns as outlined here.
- Implied volatility is at or above 20, signaling a volatile environment. The S&P 500 has historically performed poorly when this is the case, as outlined here.
- Credit default swap spreads are above their 50-day moving average, which is modestly concerning as outlined here.
- A composite of trend measures in the average S&P 500 stock have dropped below 5, which shows weak trend conditions.
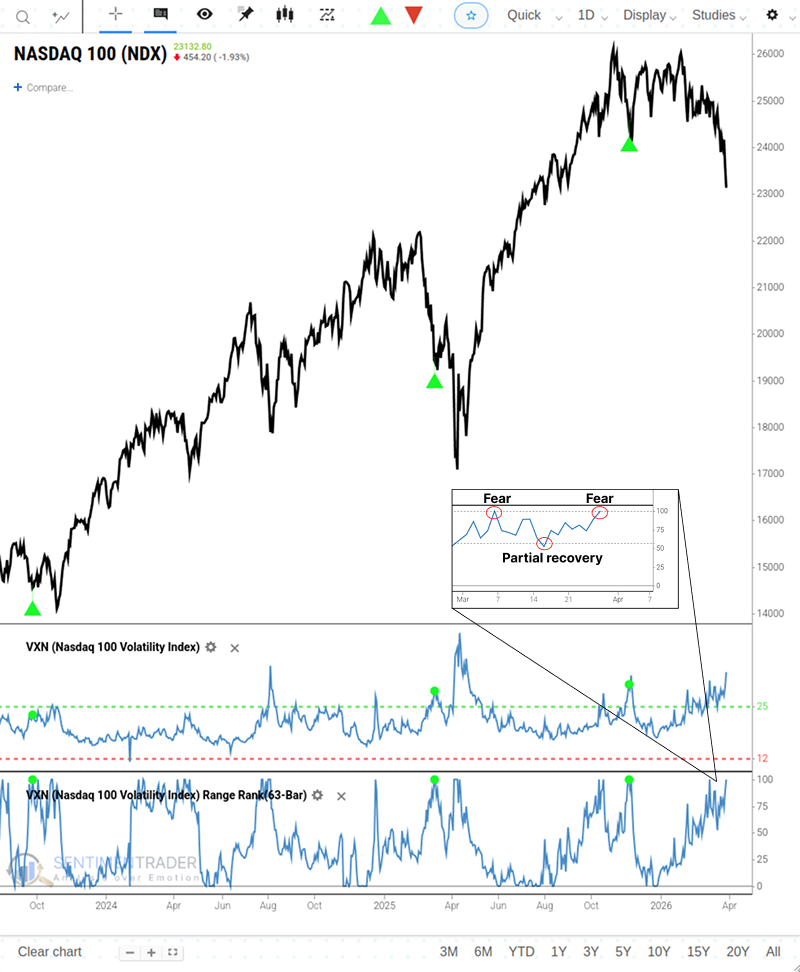
Nasdaq correction with VXN double-spike signals capitulation
The Nasdaq 100 Index officially entered correction territory, declining over 11% from its recent multi-year high to close at 23,132.8. The technology sector buckled under escalating geopolitical tensions and institutional skepticism regarding mega-cap AI capital efficiency.
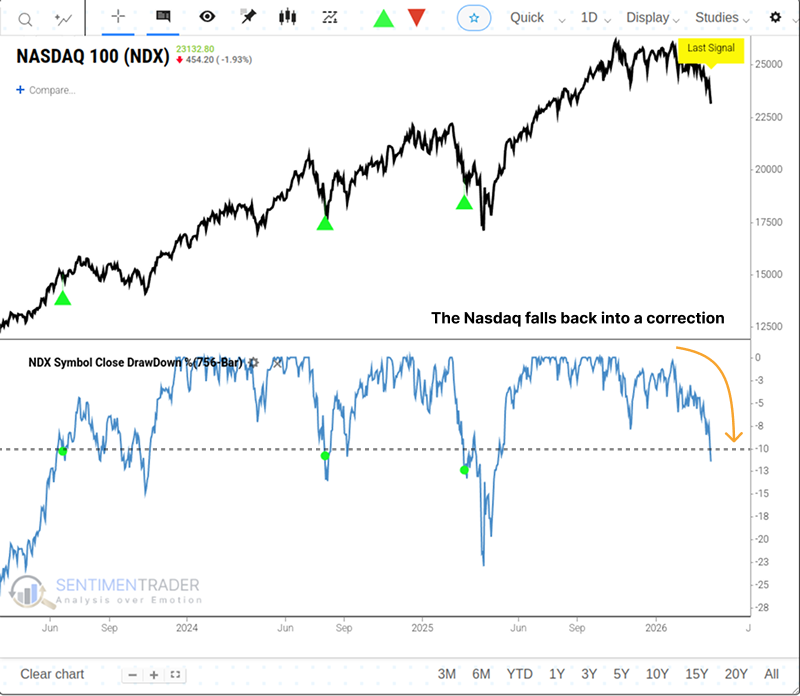
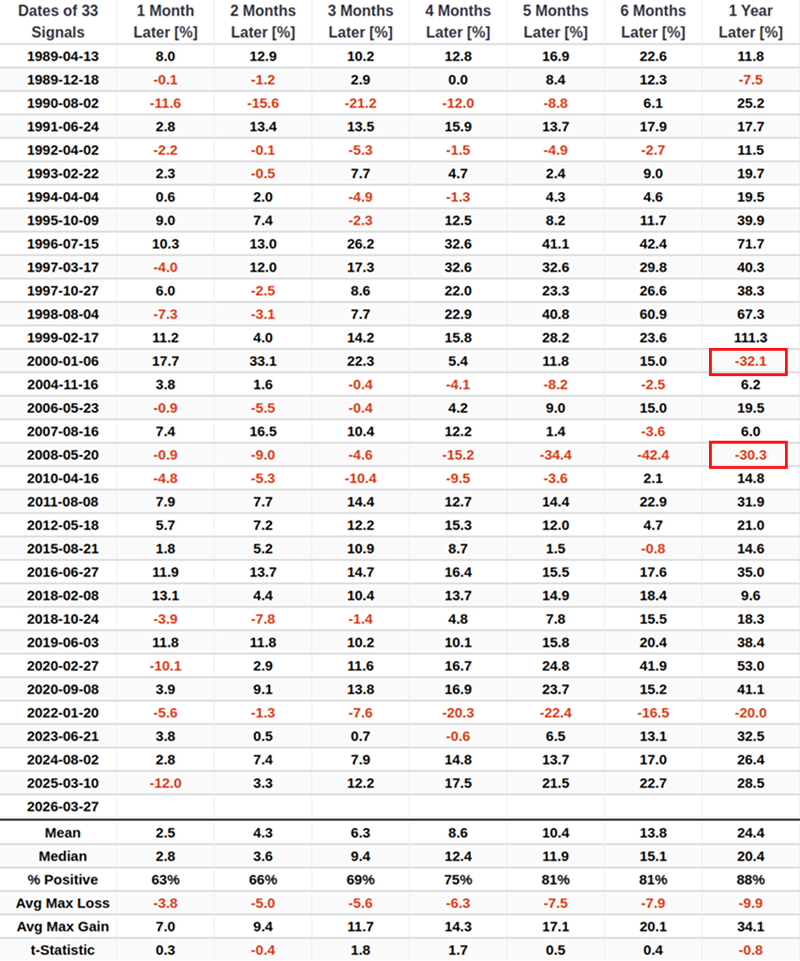
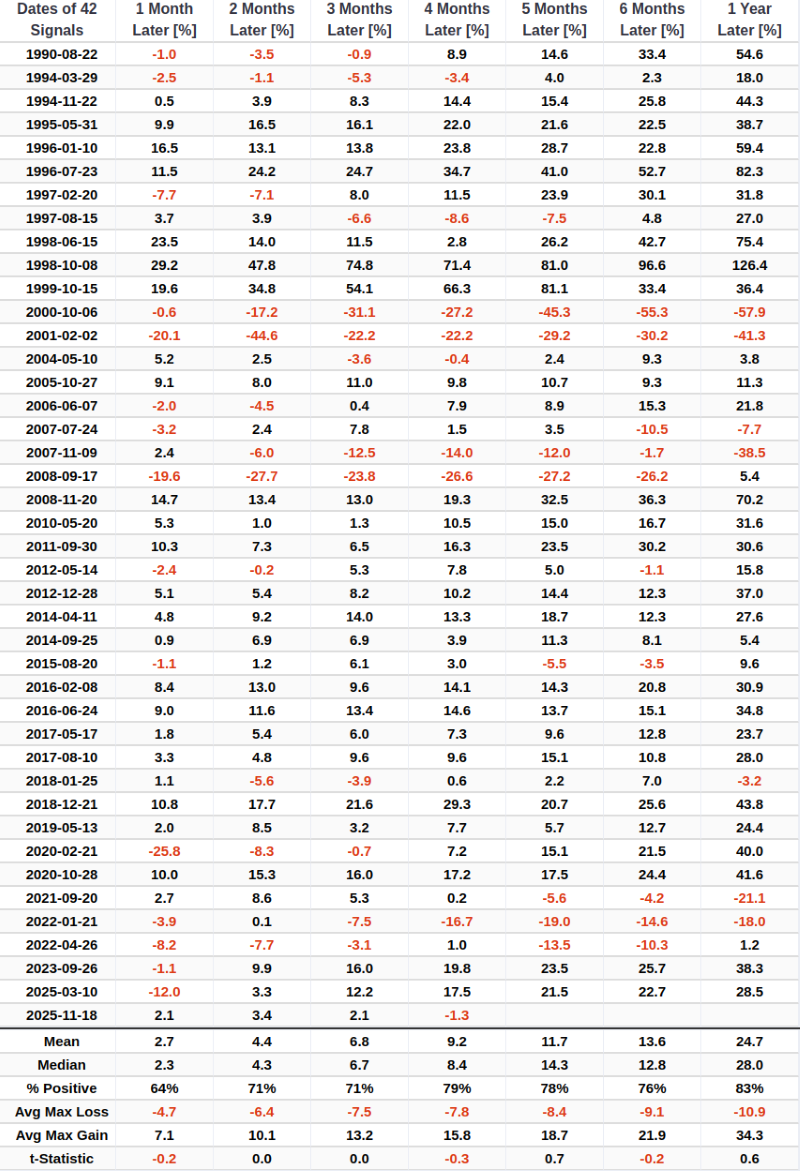
Historically, initial 10% drawdowns from multi-year peaks have presented highly attractive entry points. The forward returns and win rates are exceptional from a medium-to-long-term perspective, though catastrophic drawdowns in 2000 and 2008 were tied to systemic macroeconomic failures.
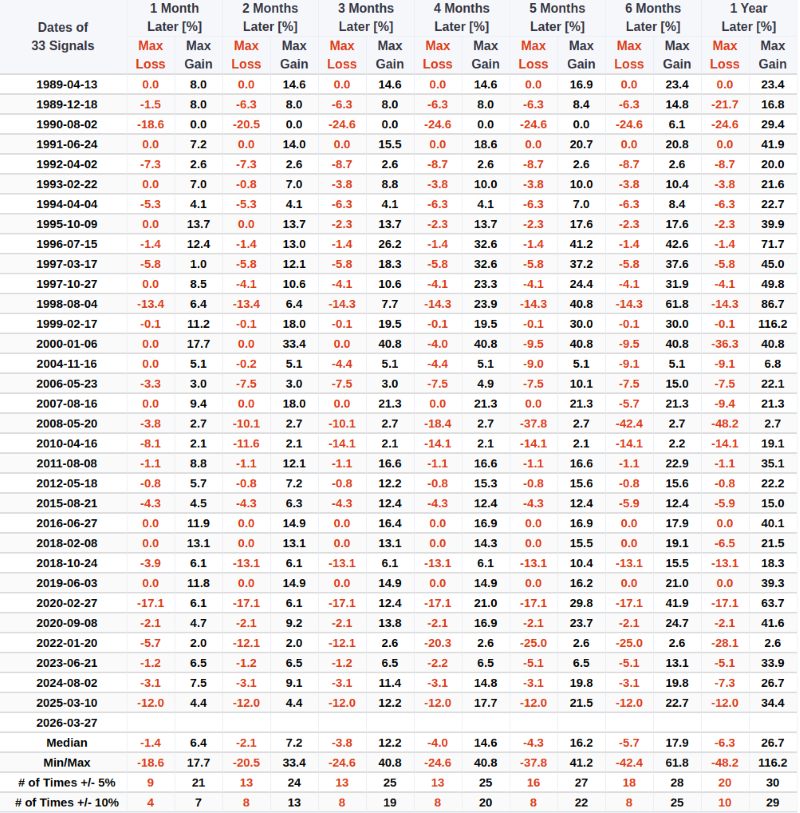
While long-term expectancy is bullish, short-term volatility is notoriously elevated with nine separate occurrences where the index suffered maximum losses exceeding 5% within one month.
The VXN recently spiked to its highest level in 63 sessions, mean-reverted, then violently spiked back to a 63-day high-a classic 'double-pump' of fear. When the 63-day range rank violently oscillates from 100% to below 55% and back to 100%, this shift often serves as a highly reliable leading indicator for durable Nasdaq 100 rallies.
The S-TCTM Risk Warning Model has triggered 14 times this month, indicating internal short-term weakness and excessive optimism that suggests near-term chop may persist before a sustained rally materializes.
VIX breakout above 30 after extended complacency
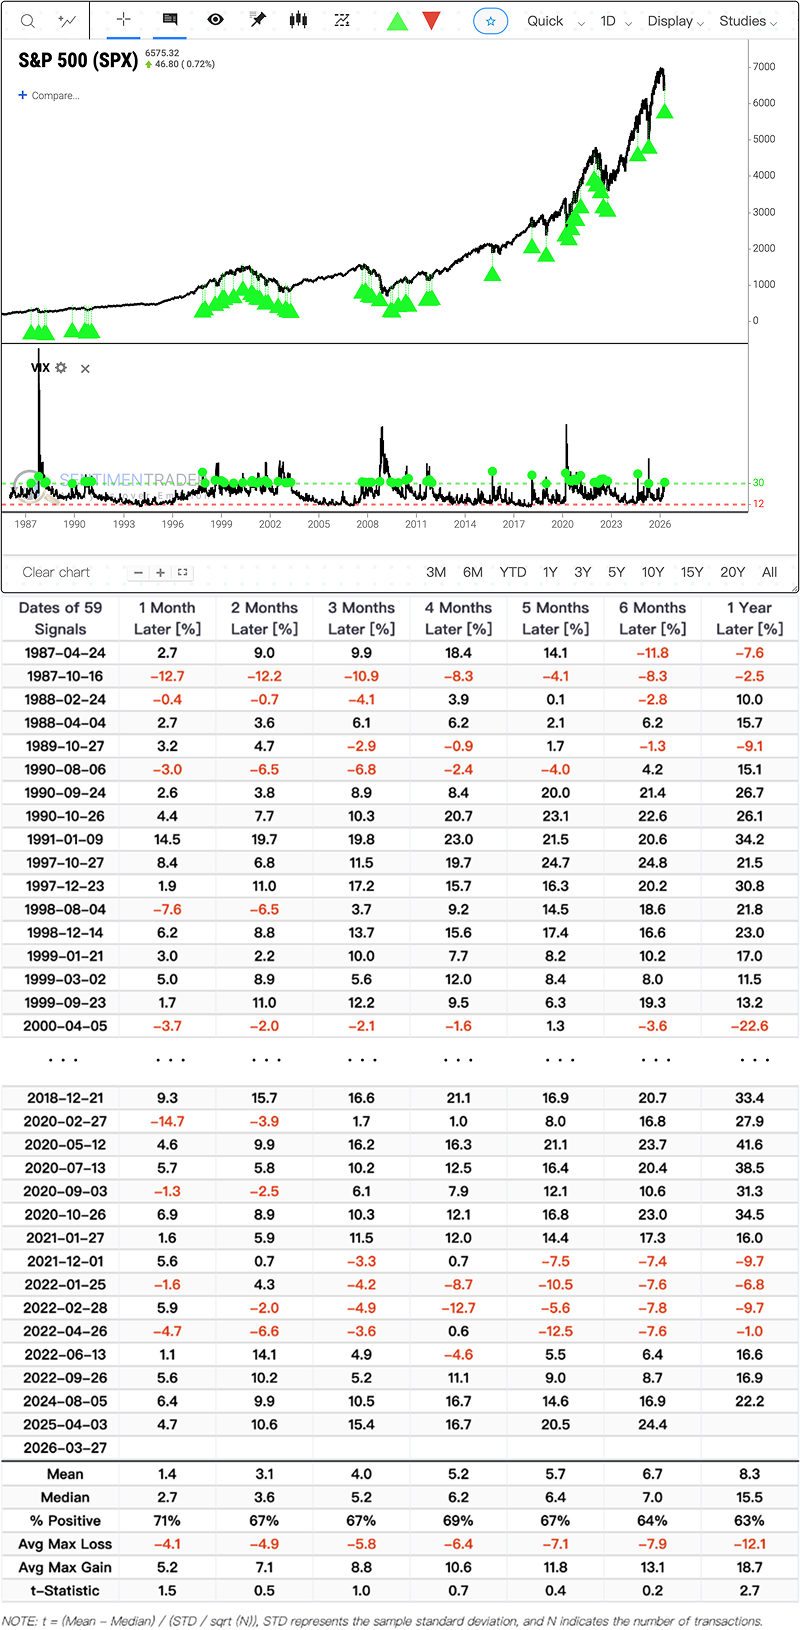
The VIX crossed 30, increasing to the highest level in 11 months and ending a 232-day streak below this threshold. A VIX move above 30 forces systematic hedging programs and dealer gamma desks to react. Historically, such absolute panic favors buyers with 71% one-month win rates.
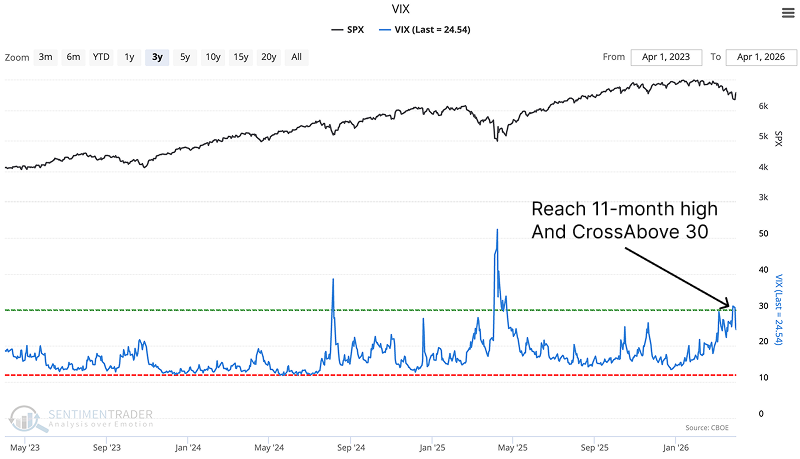
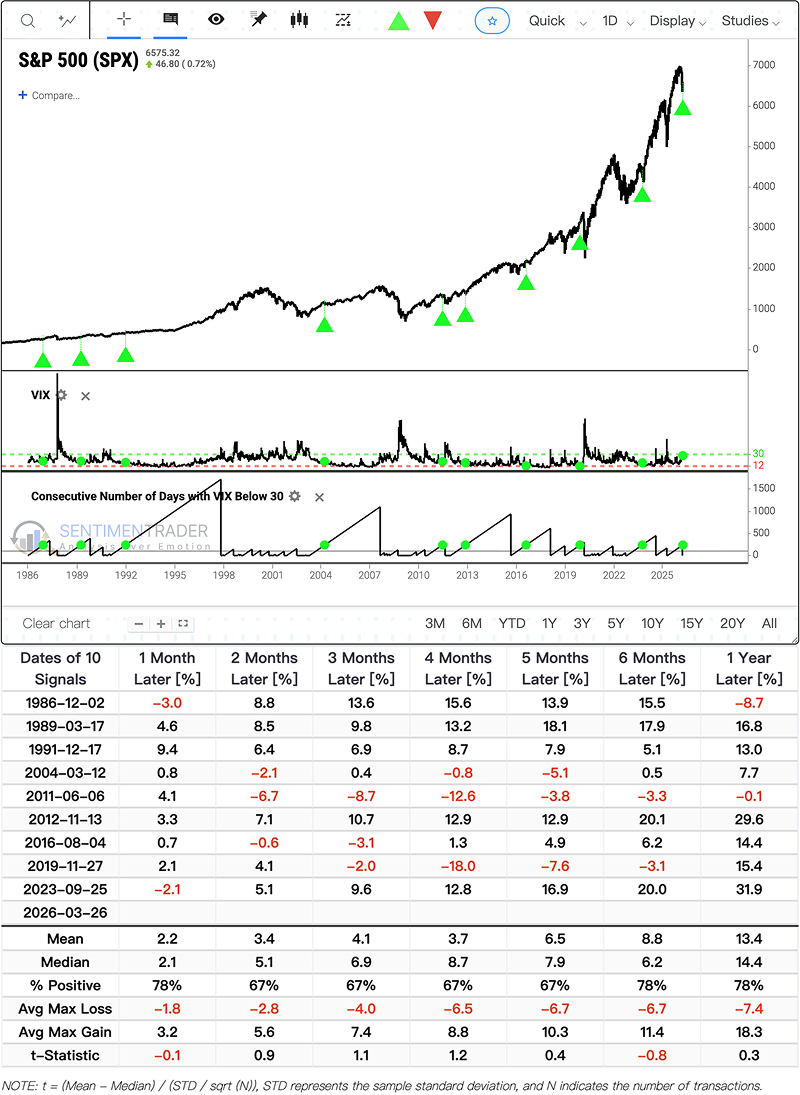
After ending long streaks below 30, the one-month win rate actually improves to 78%.
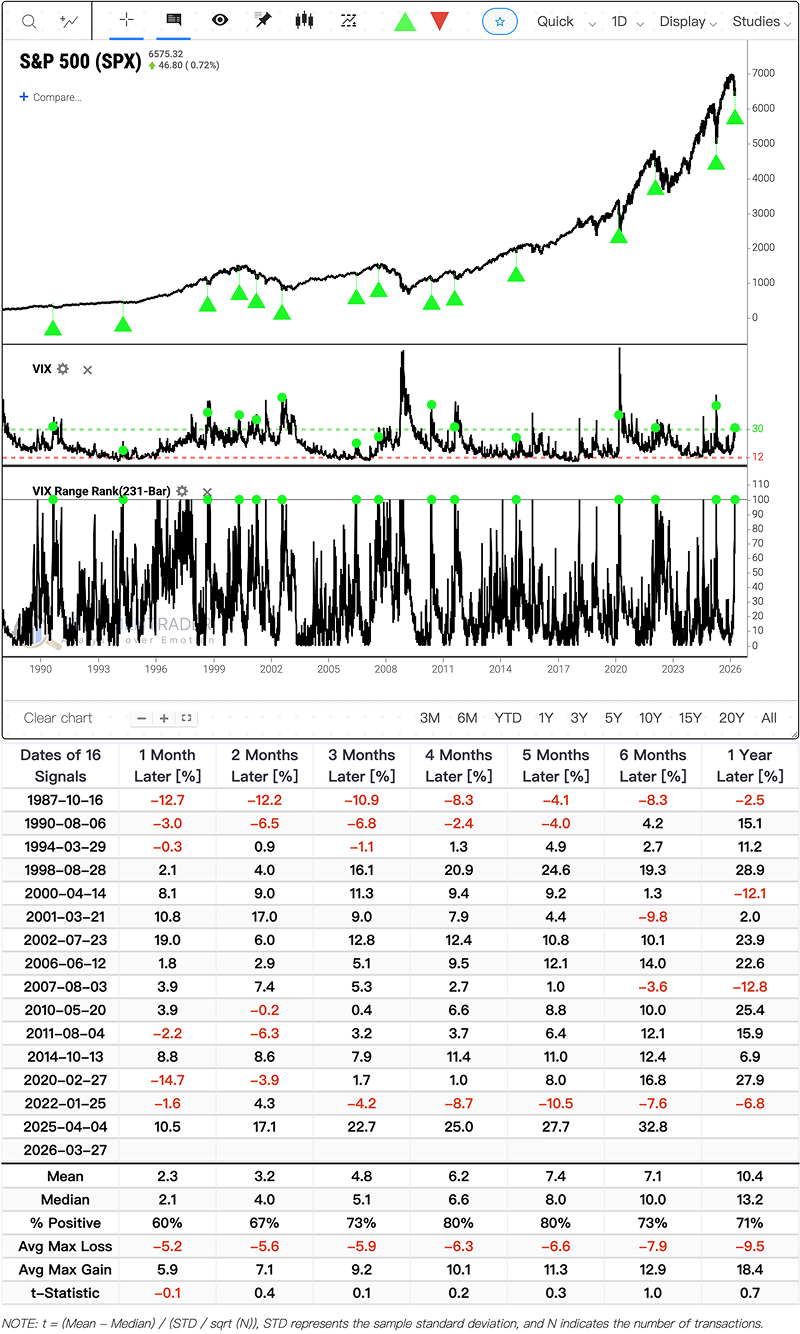
However, filtering for VIX cycles from 11-month low to 11-month high while S&P 500 trades below its 200-day moving average reveals structural risk. In 16 similar instances, short-term win rates declined but 4-5 month forward returns showed higher win rates.
S&P 500 breadth exhaustion with 7-month low pattern
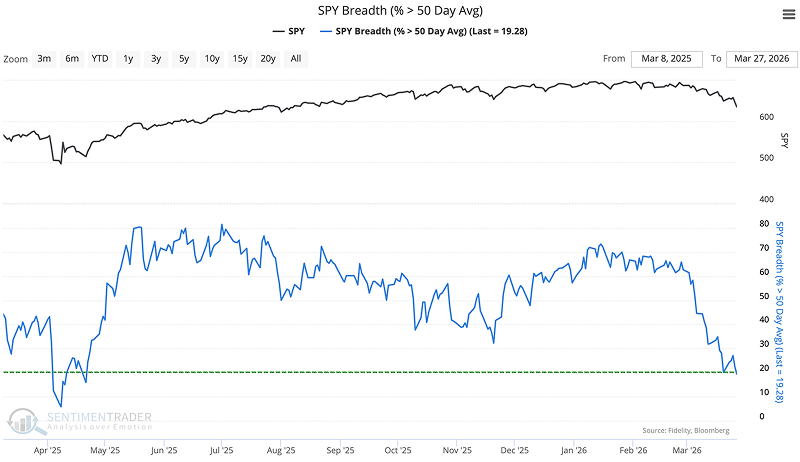
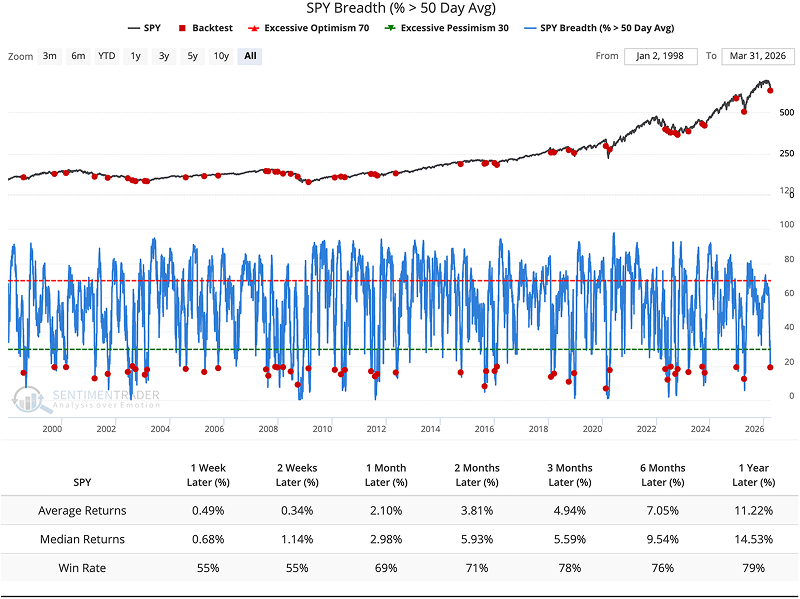
The percentage of S&P 500 stocks above their 50-day moving average collapsed below 20%. Historically, this breadth washout marks exhaustion with 79% one-year win rates and median gains over 14%.
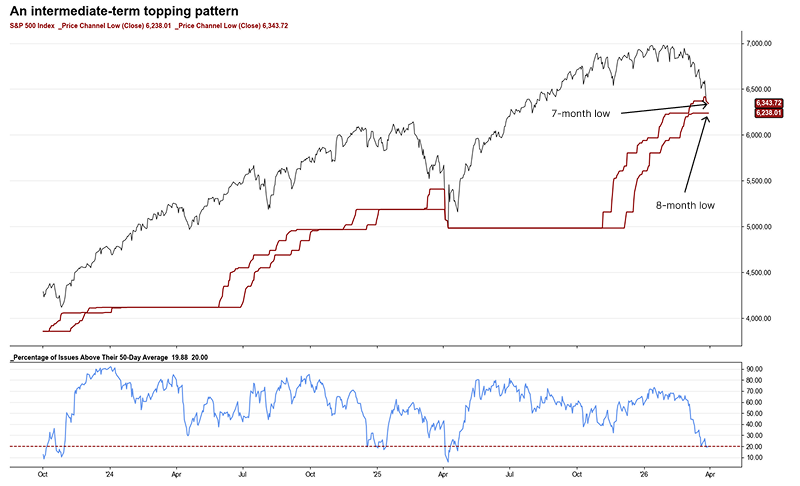
The S&P 500 registered a 7-month low while avoiding an 8-month low, completing a specific short-term topping pattern. While momentum traders view this as cascading decline initiation, medium-to-long-term win rates remain constructive.
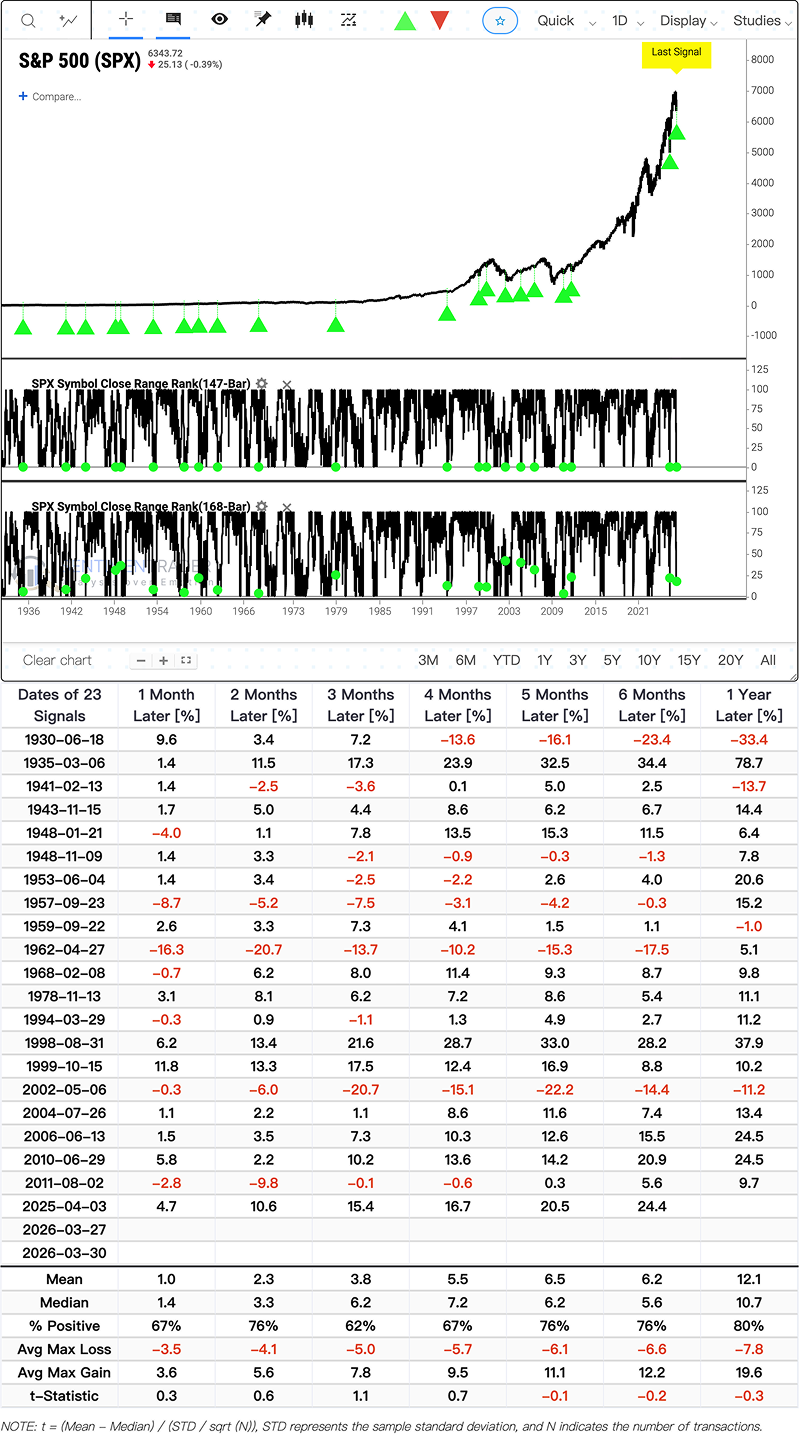
Combining the 7-month low with breadth below 20% isolates highly constructive baselines historically marking selloff endings rather than structural bear market starts.
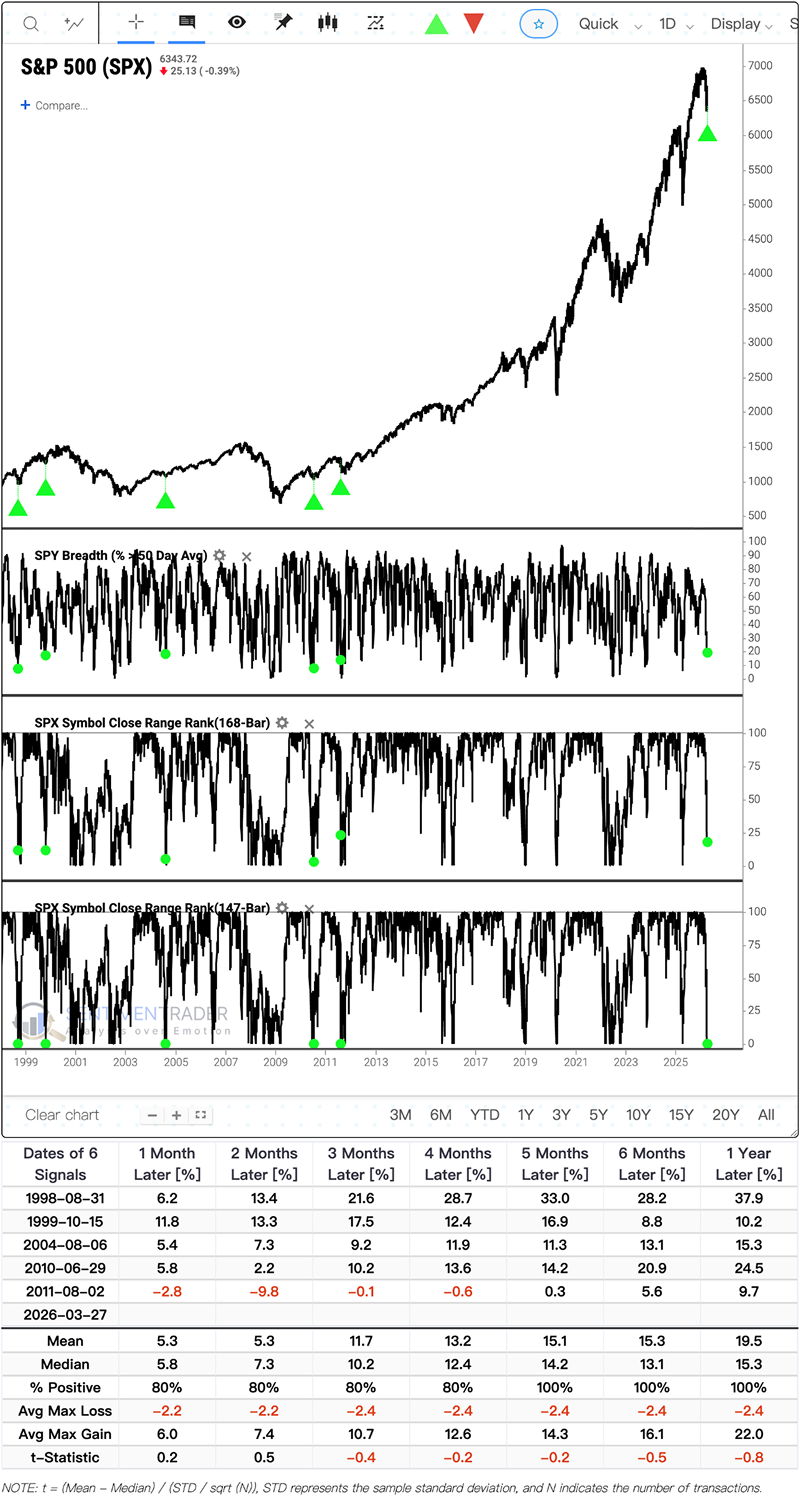
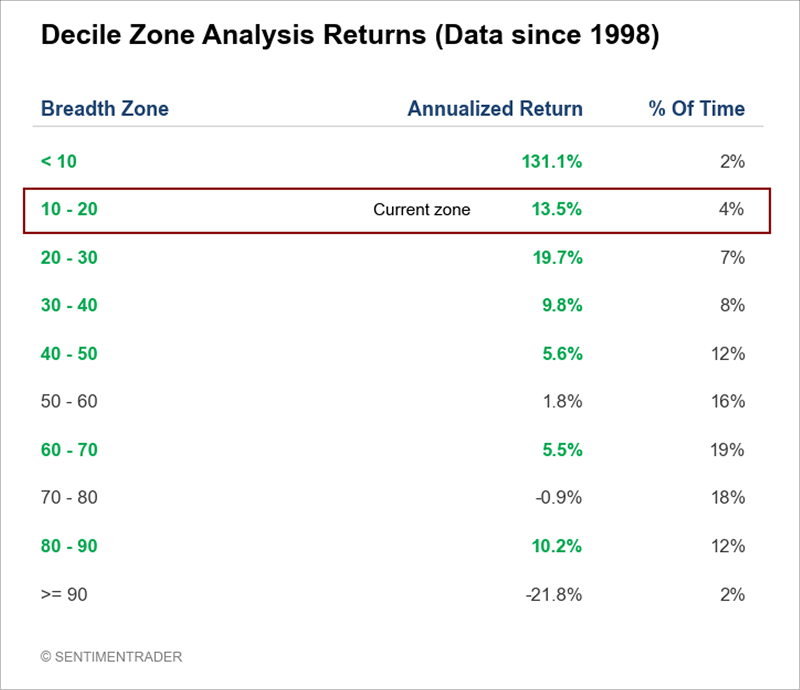
Simply existing in the 10%-20% breadth zone generates 13.5% annualized returns. Should breadth wash below 10%, annualized returns historically jump above 130%.
XLF breadth zero signals broader market opportunity
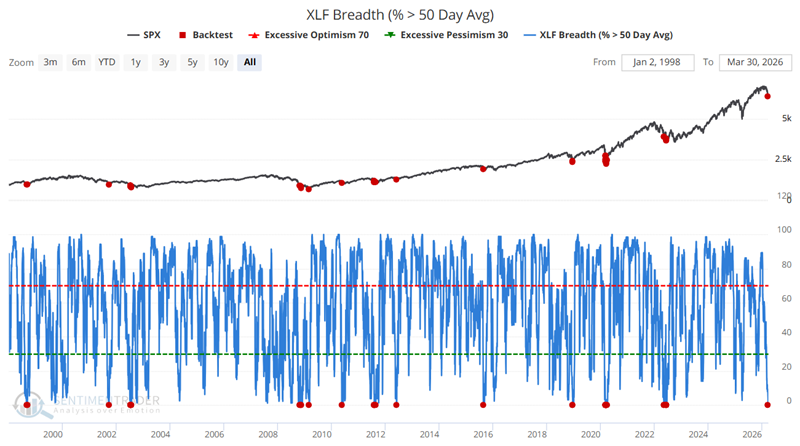
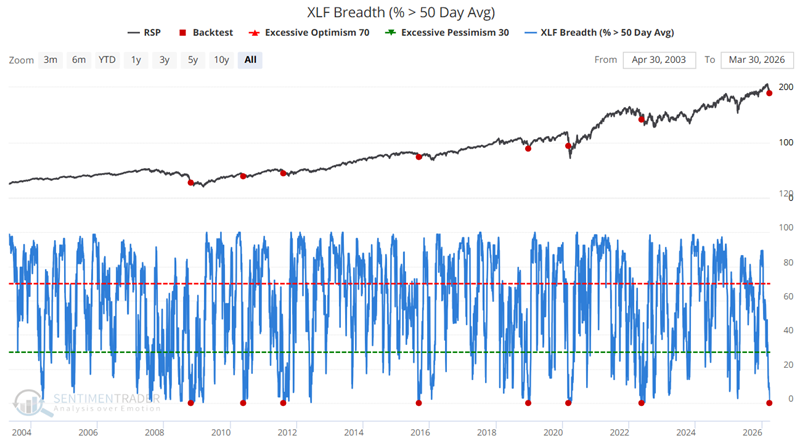
Every S&P 500 Financial Sector stock recently traded below its 50-day moving average-a rare occurrence with significant ripple effects across markets.
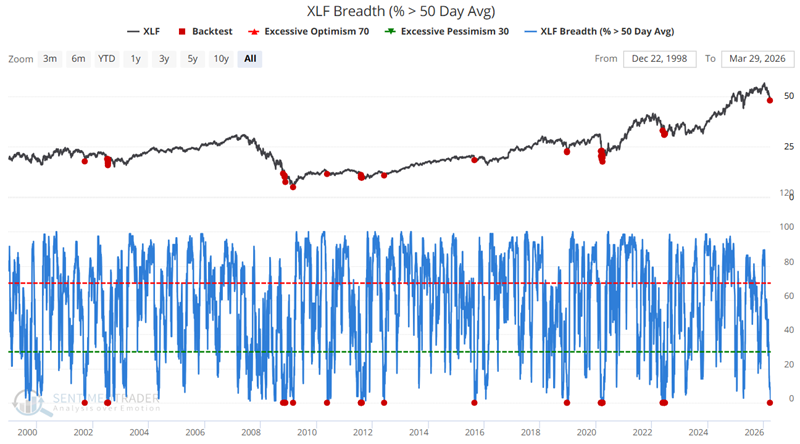
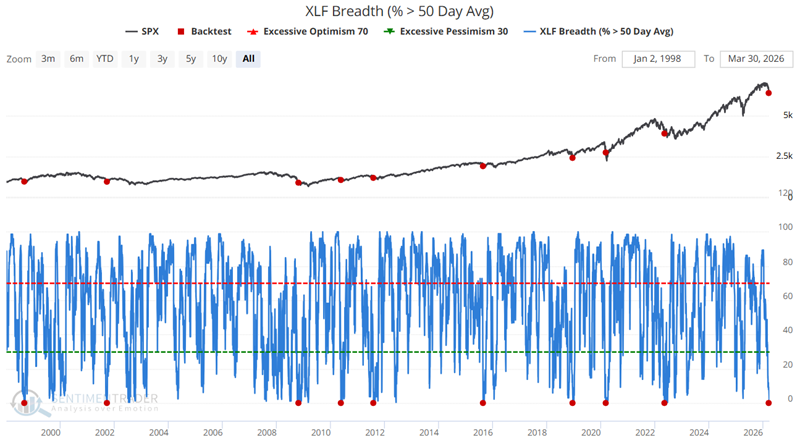
Initial XLF results show 94% one-year win rates with 22.70% median returns, though skewed by clustered signals. Limiting to first signals in 12 months, XLF results become less impressive with negative 1-2 month returns.

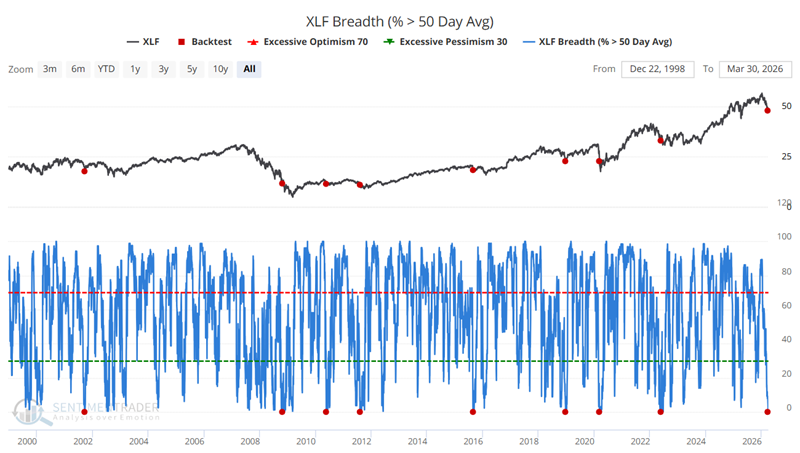
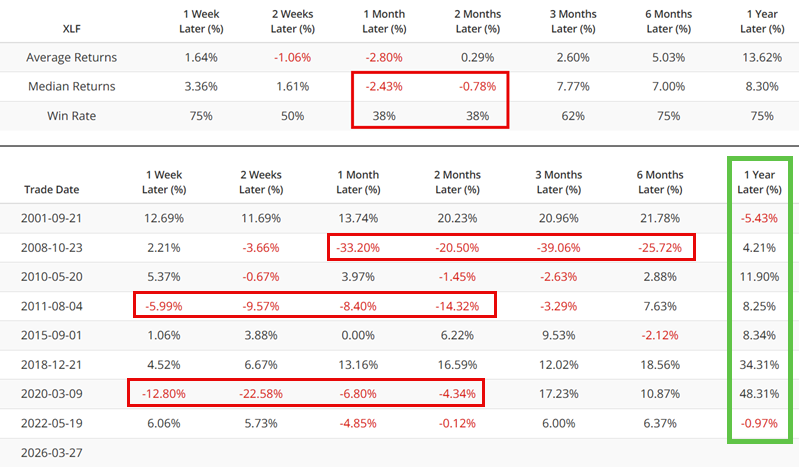
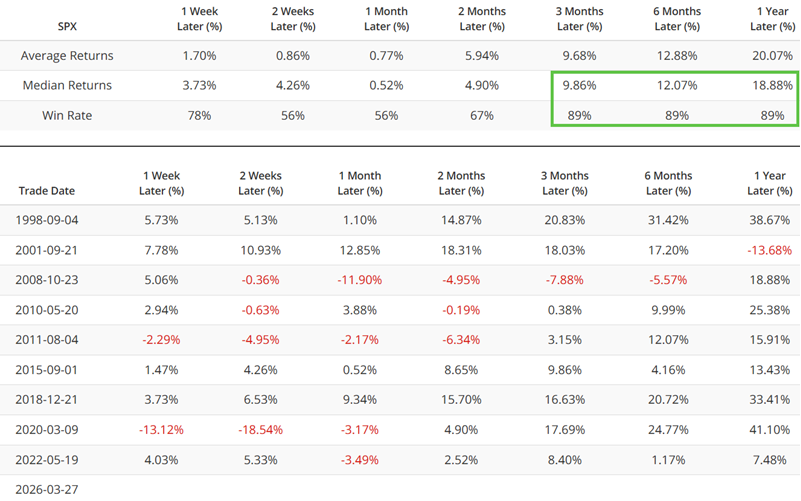
For S&P 500, first-in-year signals maintain 89% win rates across 3-, 6-, and 12-month periods.

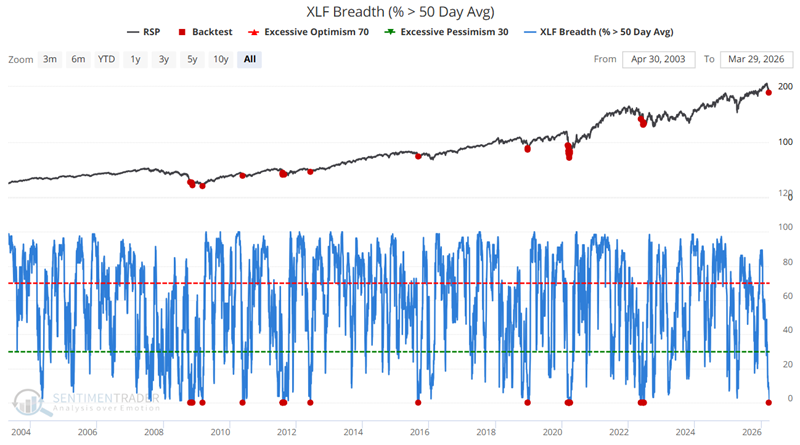
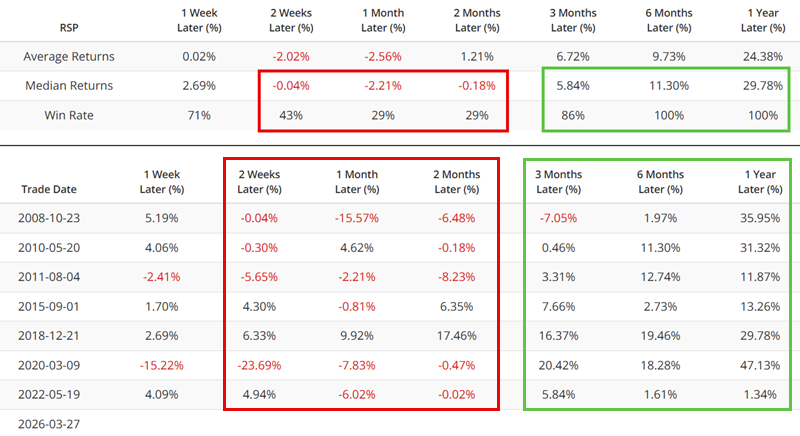
Equal-weight S&P 500 (RSP) shows similar strength with 89% win rates, though first two months remain subpar-arguing for watch-list placement rather than immediate allocation.

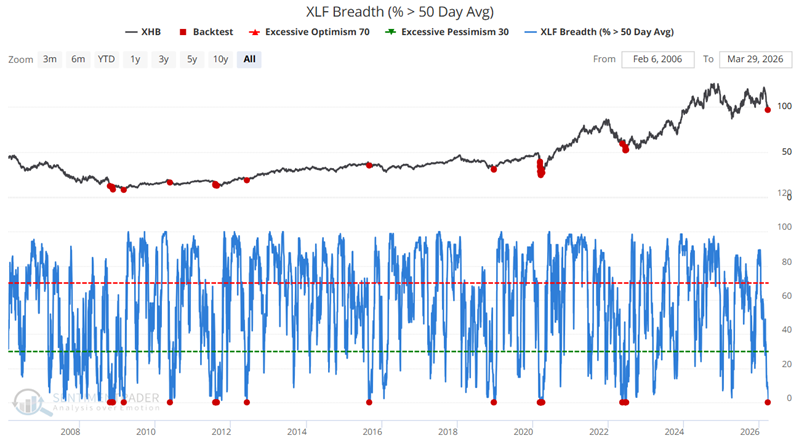
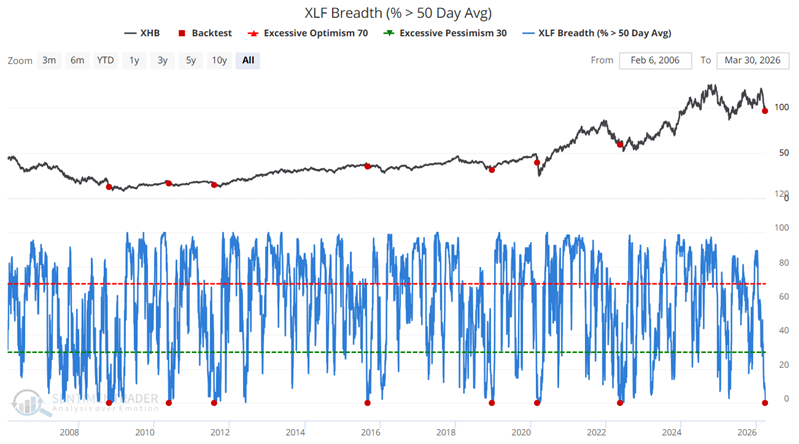
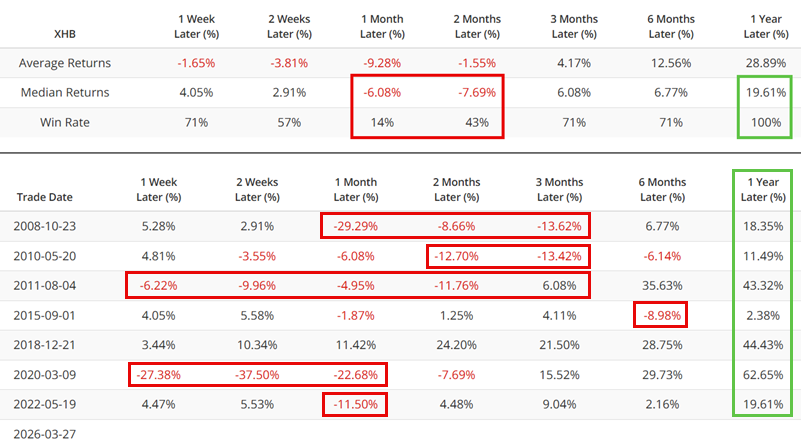
Homebuilders (XHB) show 100% one-year win rates with 62.35% median returns, though 5 of 7 signals saw at least 10% further declines before bottoming.

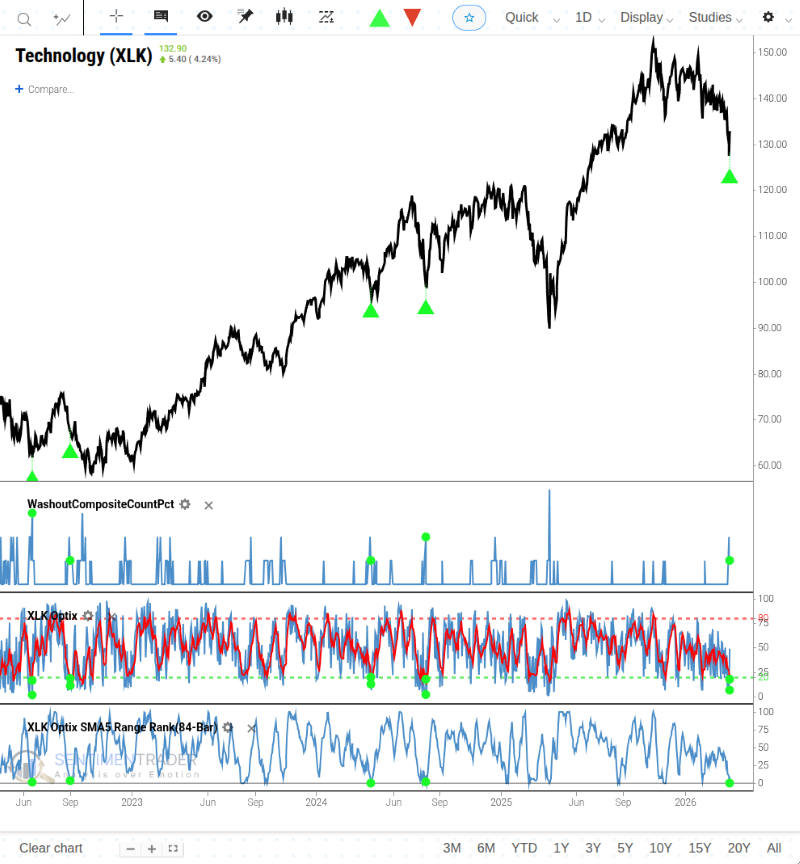
Technology Optix buy signal with breadth risk
Technology triggered an Optix buy signal amid sharp broader market declines. The Optimism Index incorporates put/call activity, volatility expectations, NAV discounts, and price behavior.
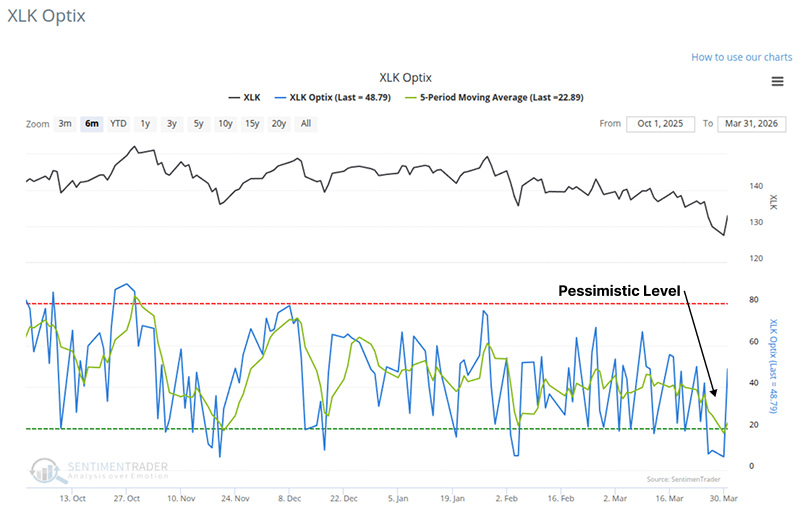
The model applies 84-day range rank to XLK's 5-day Optix moving average, triggering when range rank drops below 5th percentile.
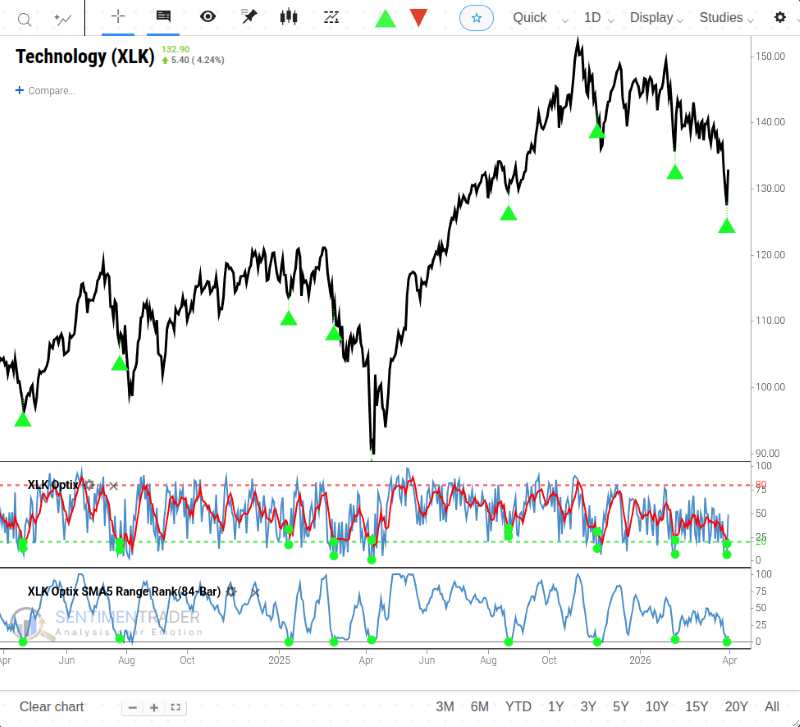
Standalone signals show 61% win rates, but when combined with Composite Washout Model readings of 22% or higher, three-month win rates jump to 87% with 8.9% median returns.
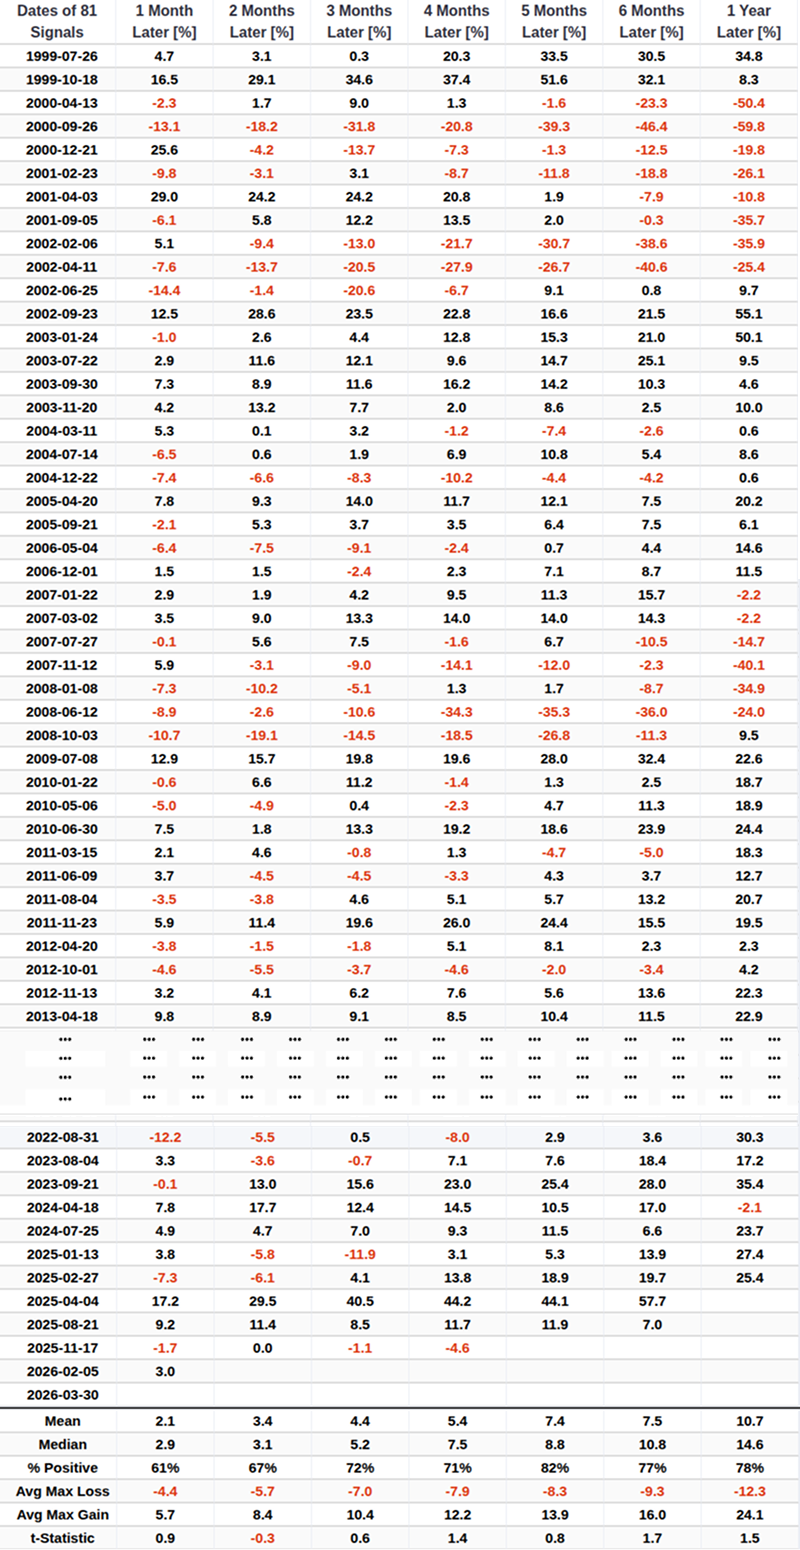
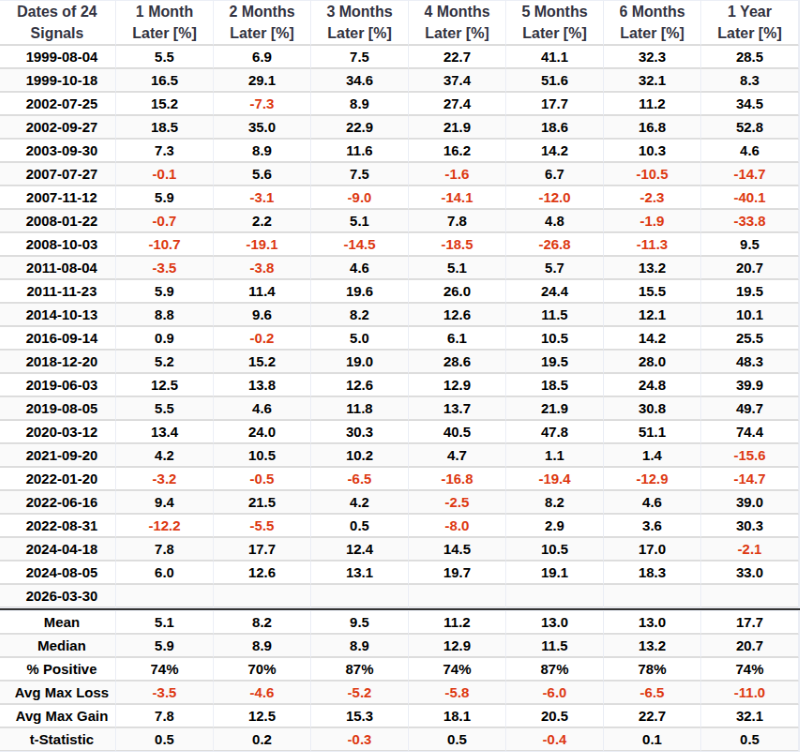
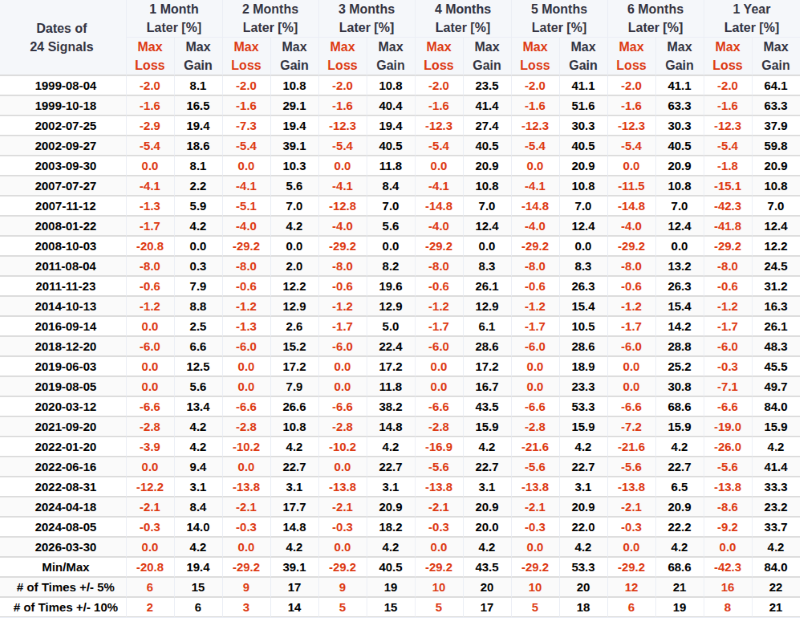
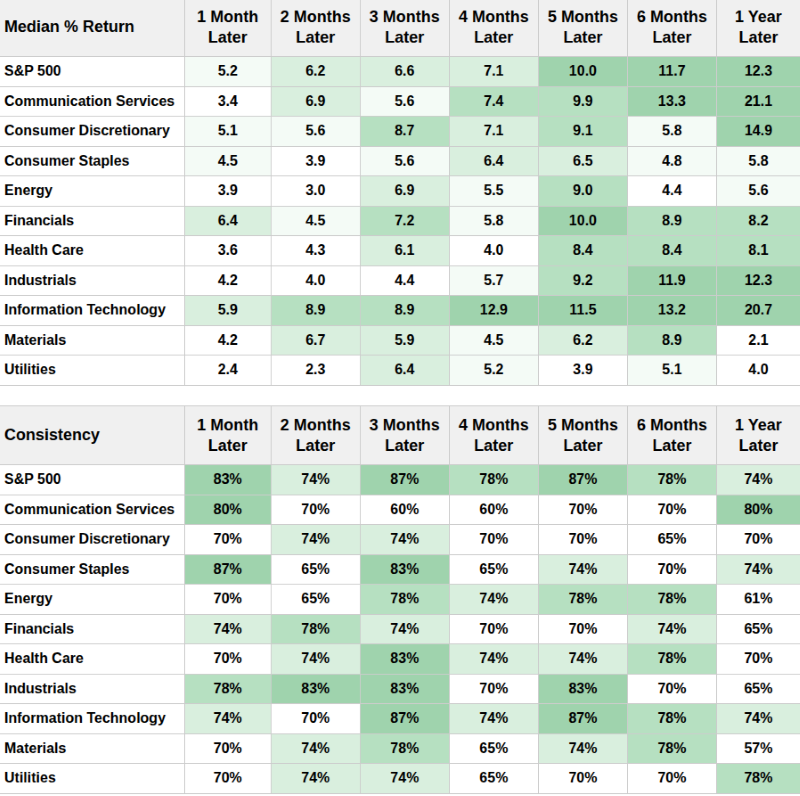
Maximum gains historically eclipse maximum drawdowns across timeframes, with technology outperforming broader market and cyclicals outpacing defensives post-signal.
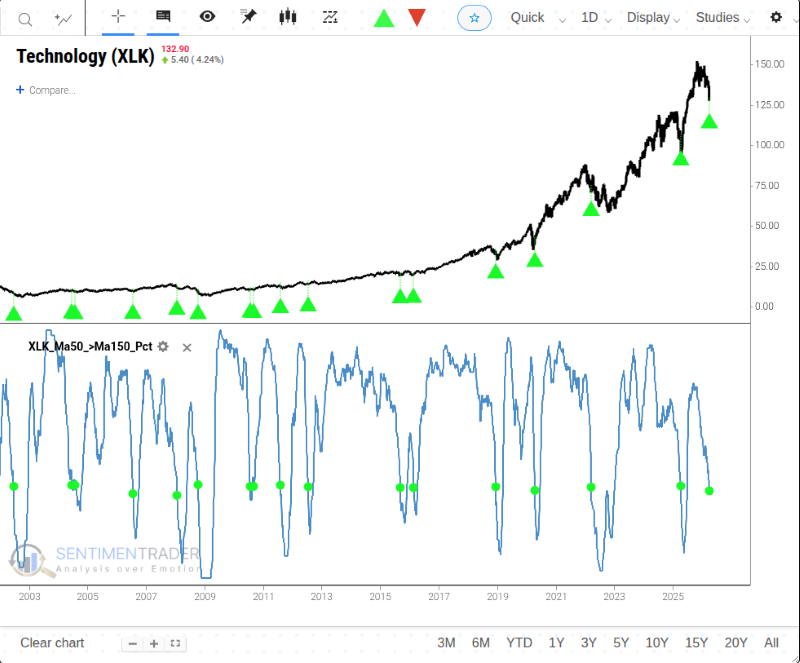
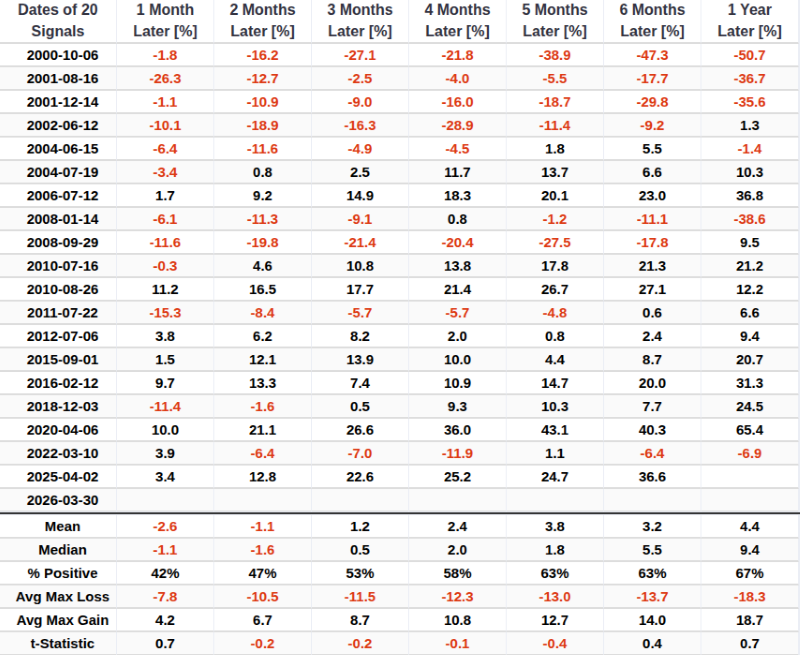
However, S&P 500 tech stocks with 50-day MA above 150-day MA just dropped below 38-a major red flag with sub-50% one-to-two-month win rates despite favorable longer-term outcomes.
Negative Q1 2026 dims outlook for remainder of year
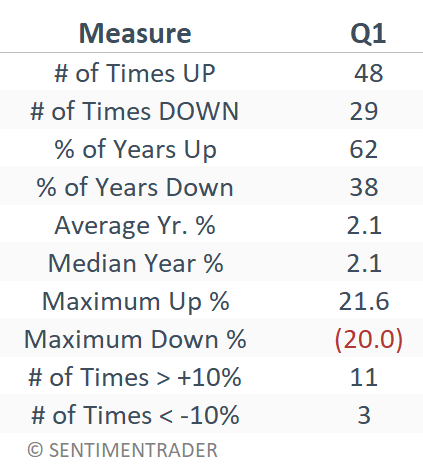
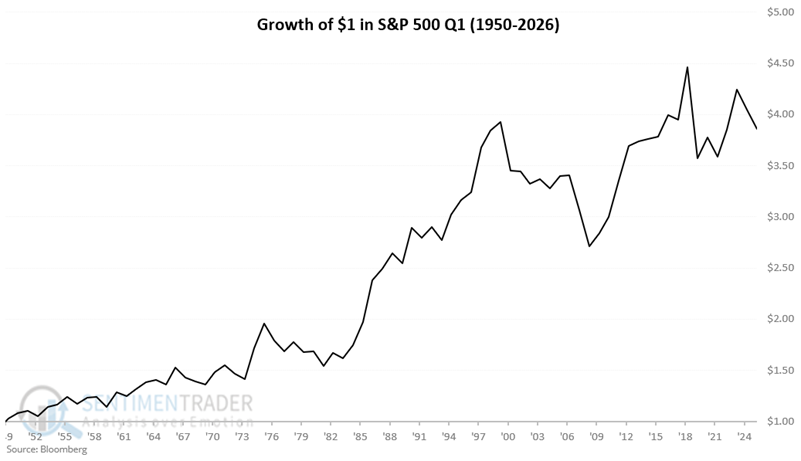
The S&P 500 lost 4.4% in Q1 2026, well below average. Since 1950, Q1 ended higher 62% of the time.
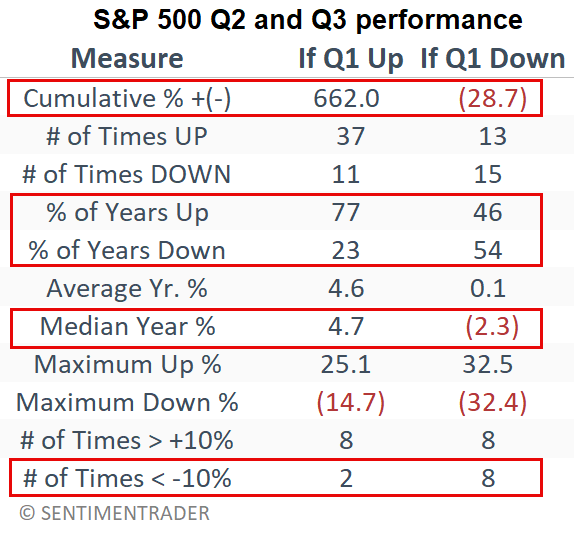
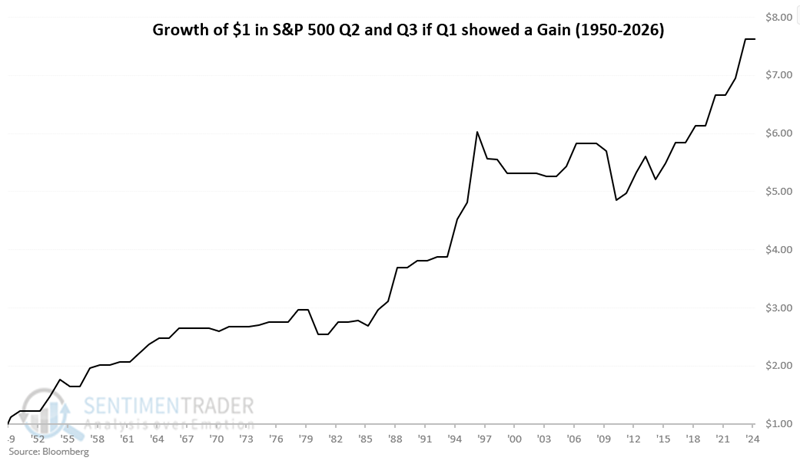
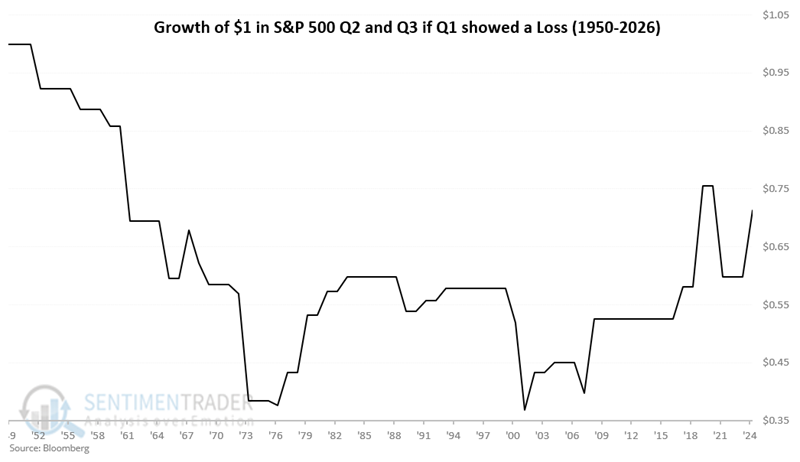
Following positive Q1s, Q2+Q3 showed gains 77% of the time versus 46% after negative Q1s. Median returns were +4.7% versus -2.3%.
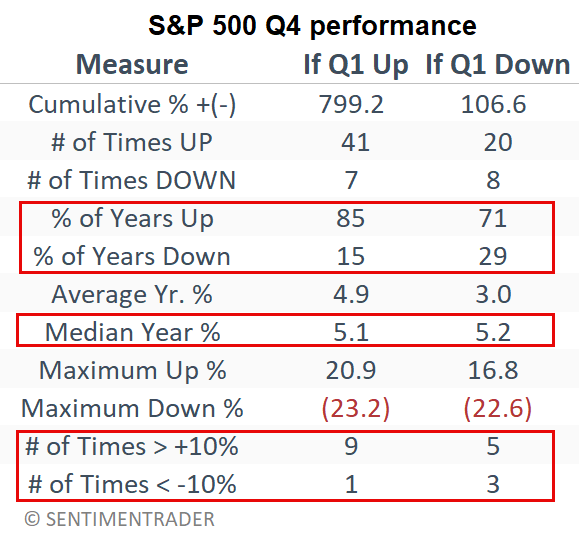
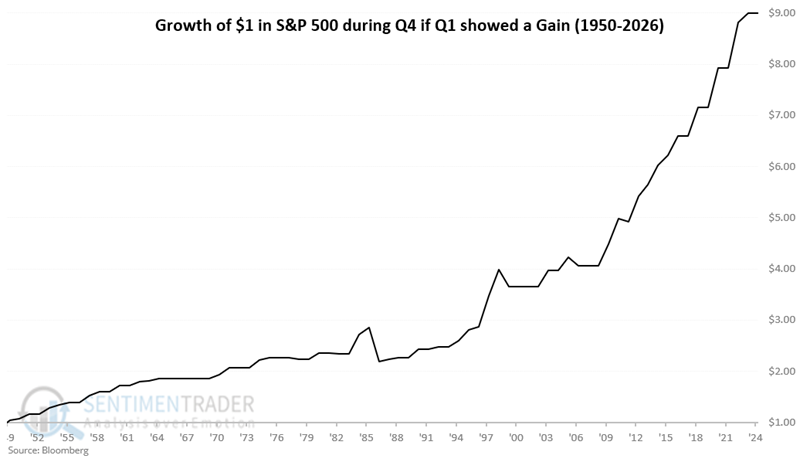
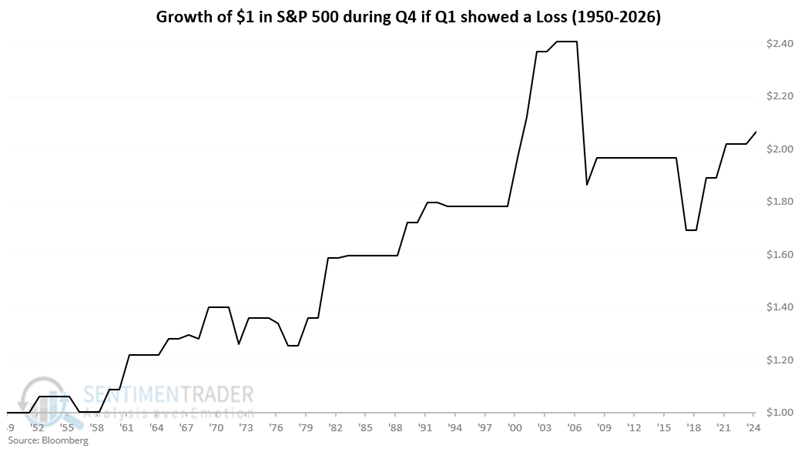
Q4 performance shows 85% win rates after positive Q1s versus 71% after negative Q1s.
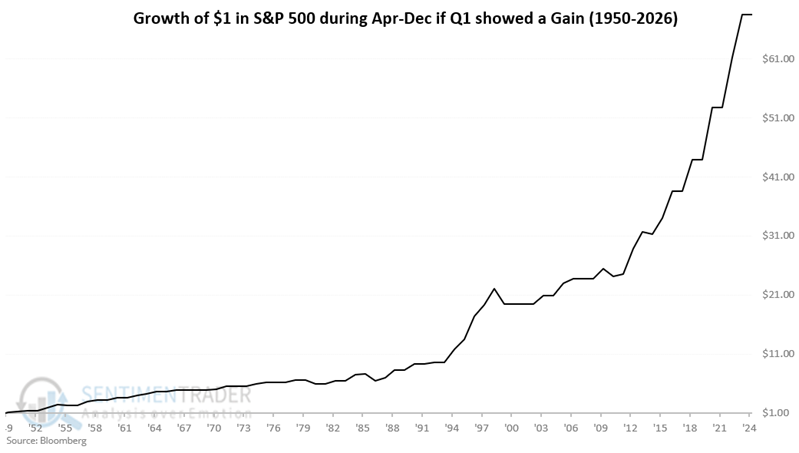
For April-December combined, positive Q1s delivered 88% win rates and +9.3% median returns versus 50% and +0.9% after negative Q1s.
Five straight down weeks moderates forward expectations
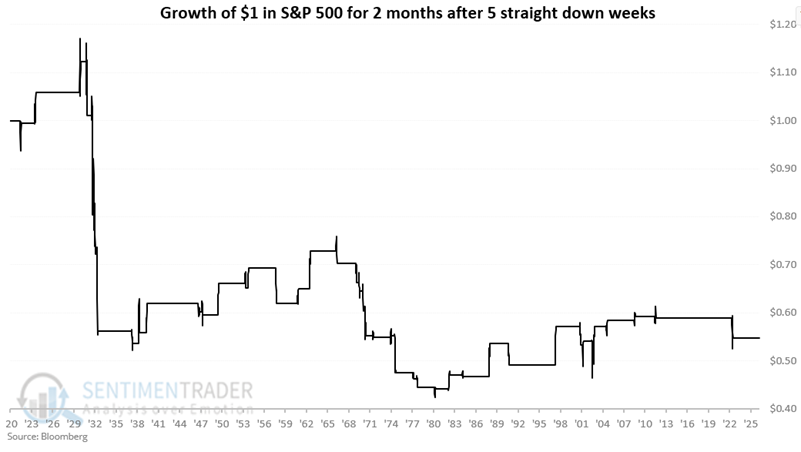
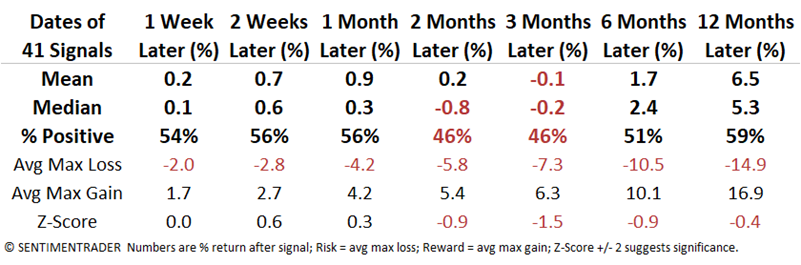
The week ending March 27 marked five consecutive weekly S&P 500 declines. Historical results following such streaks are uninspiring with win rates below 58% across all timeframes and negative two- and three-month median returns.
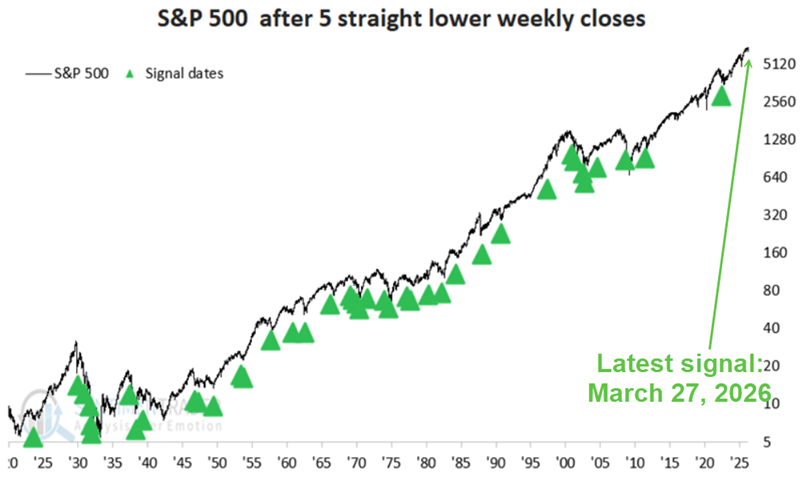
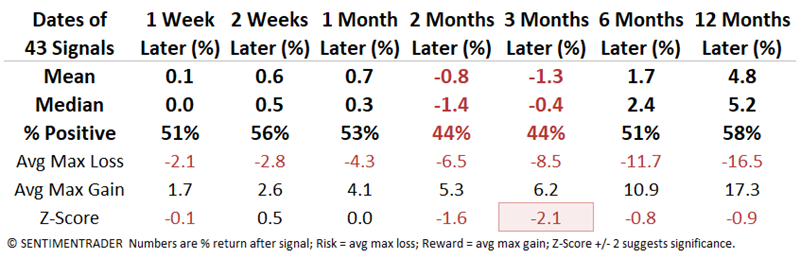
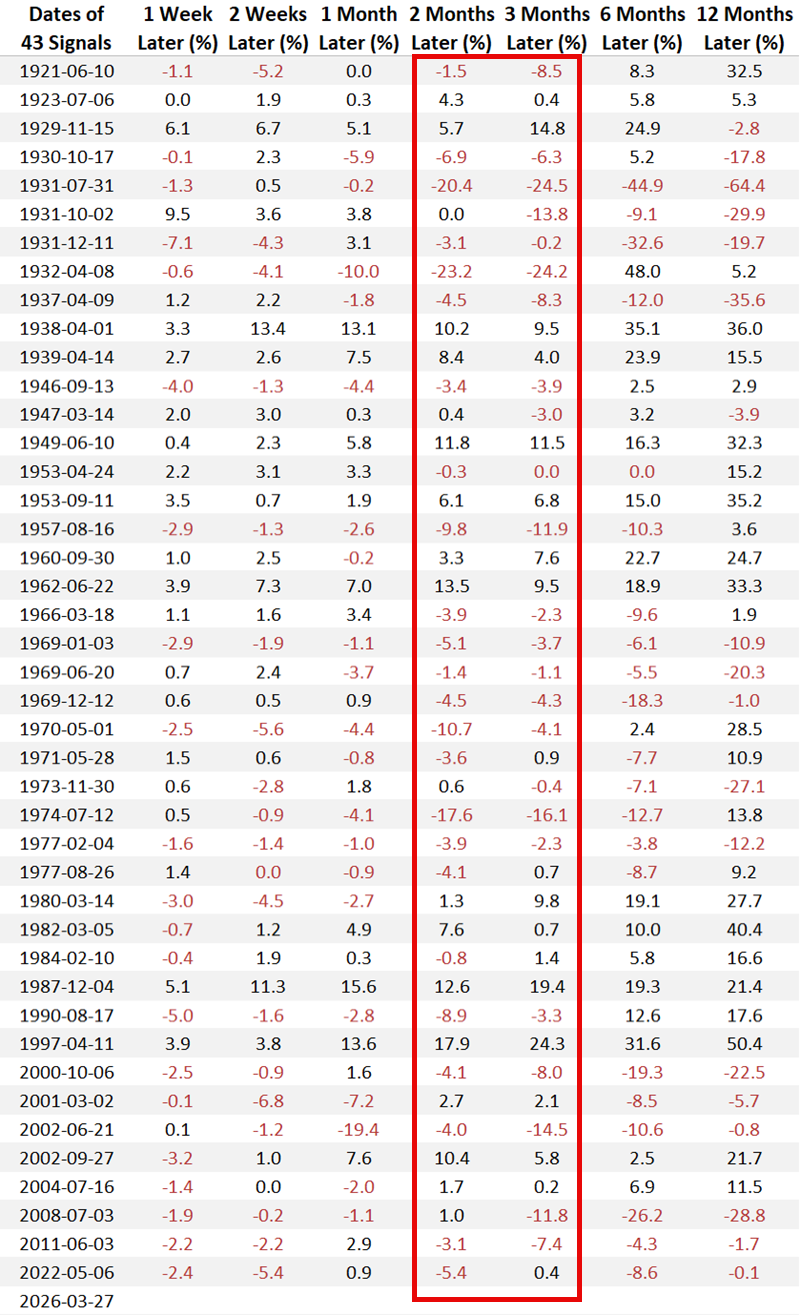
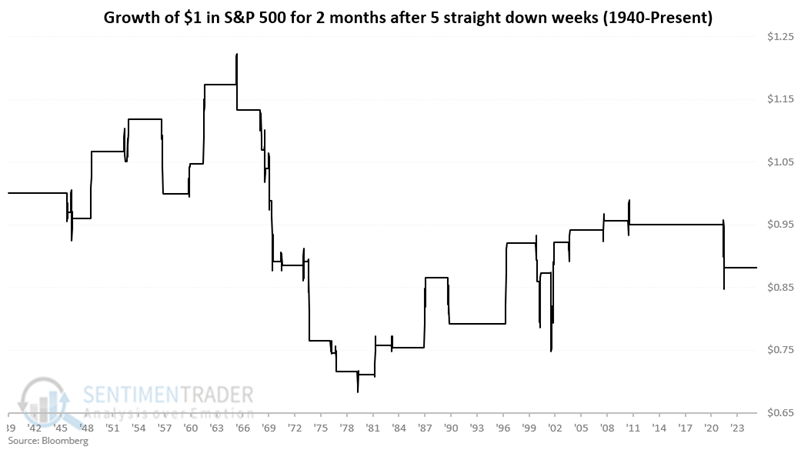
A two-month holding strategy following five down weeks saw $1 decline to $0.44. Even removing 1931-1932 outliers, results remain unremarkable with sub-50% win rates.
Starting in 1940, results remain less than inspiring for this pattern.
About TradingEdge Weekly...
The goal of TradingEdge Weekly is to summarize some of the research published to SentimenTrader over the past week. Sometimes there is a lot to digest, and this summary highlights the highest conviction or most compelling ideas we discussed. This is NOT the published research; rather, it pulls out some of the most relevant parts. It includes links to the published research for convenience, and if you don't subscribe to those products, it will present the options for access.