
Timidity of Optimism

Key Points:
- SPX breaks below its 50-day moving average (50DMA) for the first time after a long stretch above it
- Smart Money perks up as Dumb Money retreats
- Short-term optimism index drops to the 30 level
A Major Shift in Market Sentiment
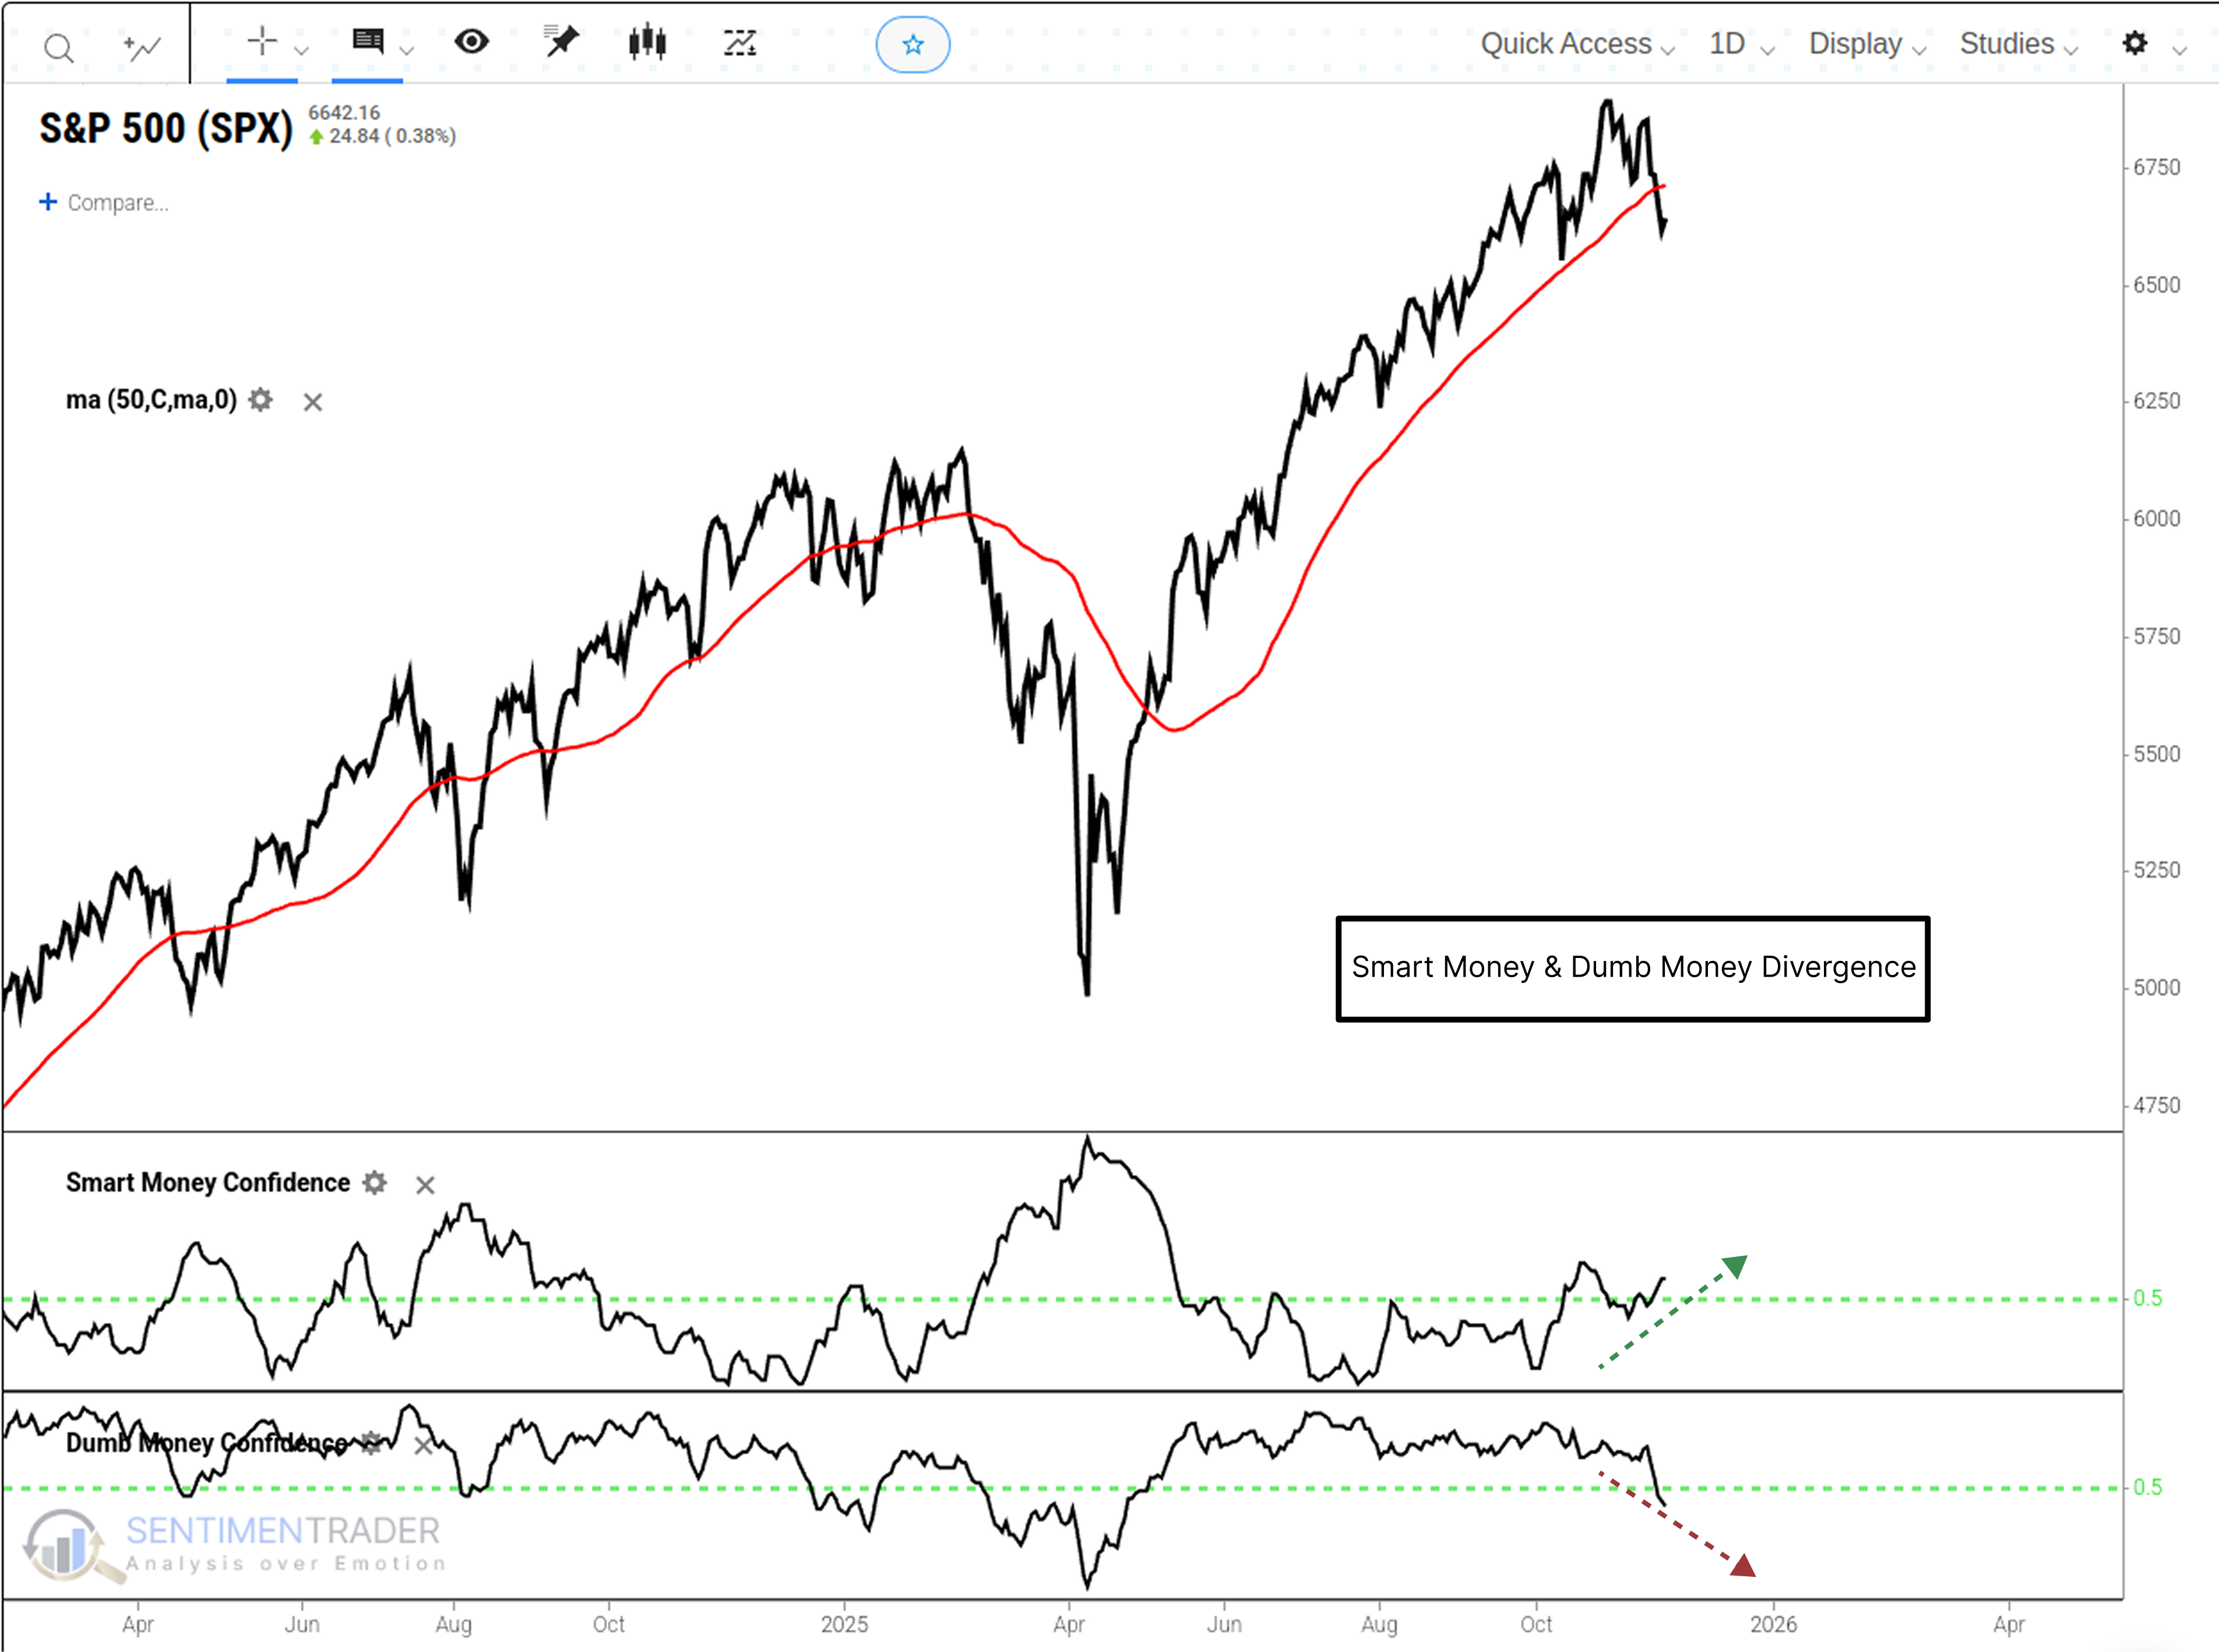
For traders, the 50-day moving average is often a key indicator. The SPX has been trading above its 50DMA for an extended period. However, just a few days ago, it broke below this level for the first time in ages-undoubtedly a blow to market sentiment.
As shown in the chart below, Dumb Money is retreating while Smart Money is perking up, coinciding with the break below the 50DMA.
When Such Moving Average Breaks Occur in History
The chart below illustrates the performance of the SPX after it breaks below its 50DMA for the first time following at least 90 consecutive days above it.Related Backtest Click Here.
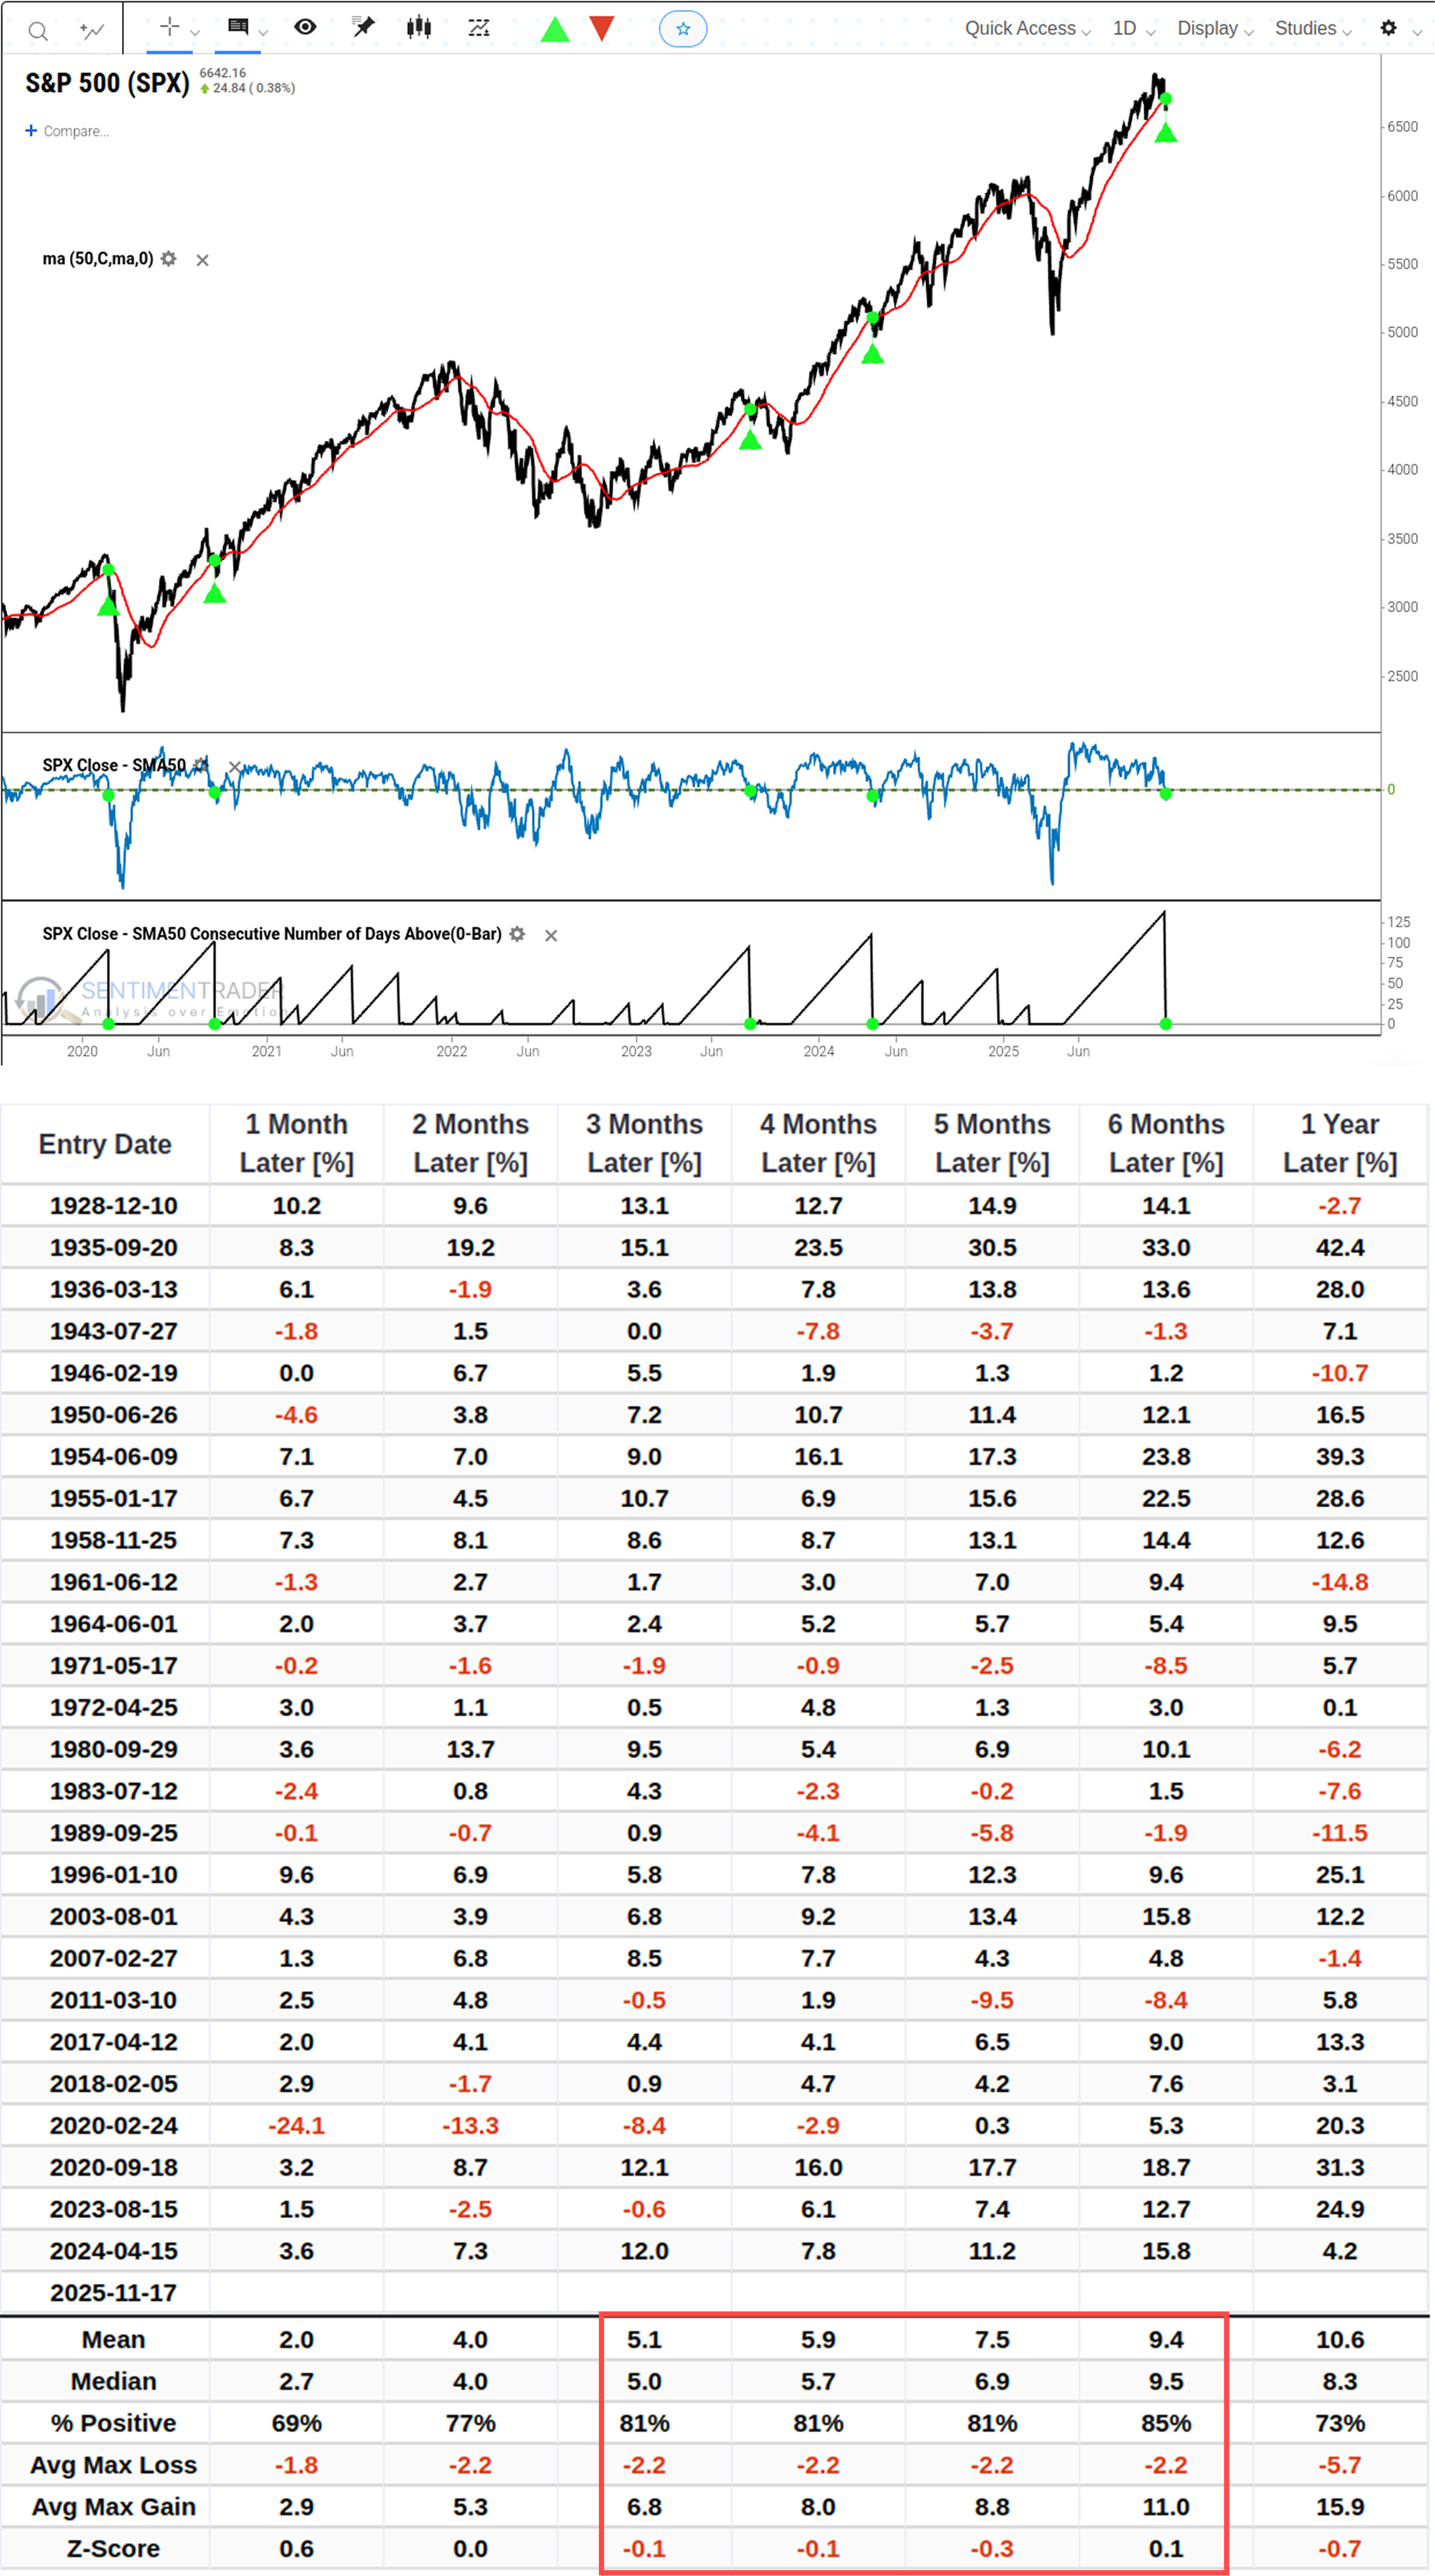
There have been 27 such signals in total. The win rate remains above 80% for the 3-month to 6-month horizons. The momentum from being above the moving average for so long makes this brief breakdown more akin to a pullback.
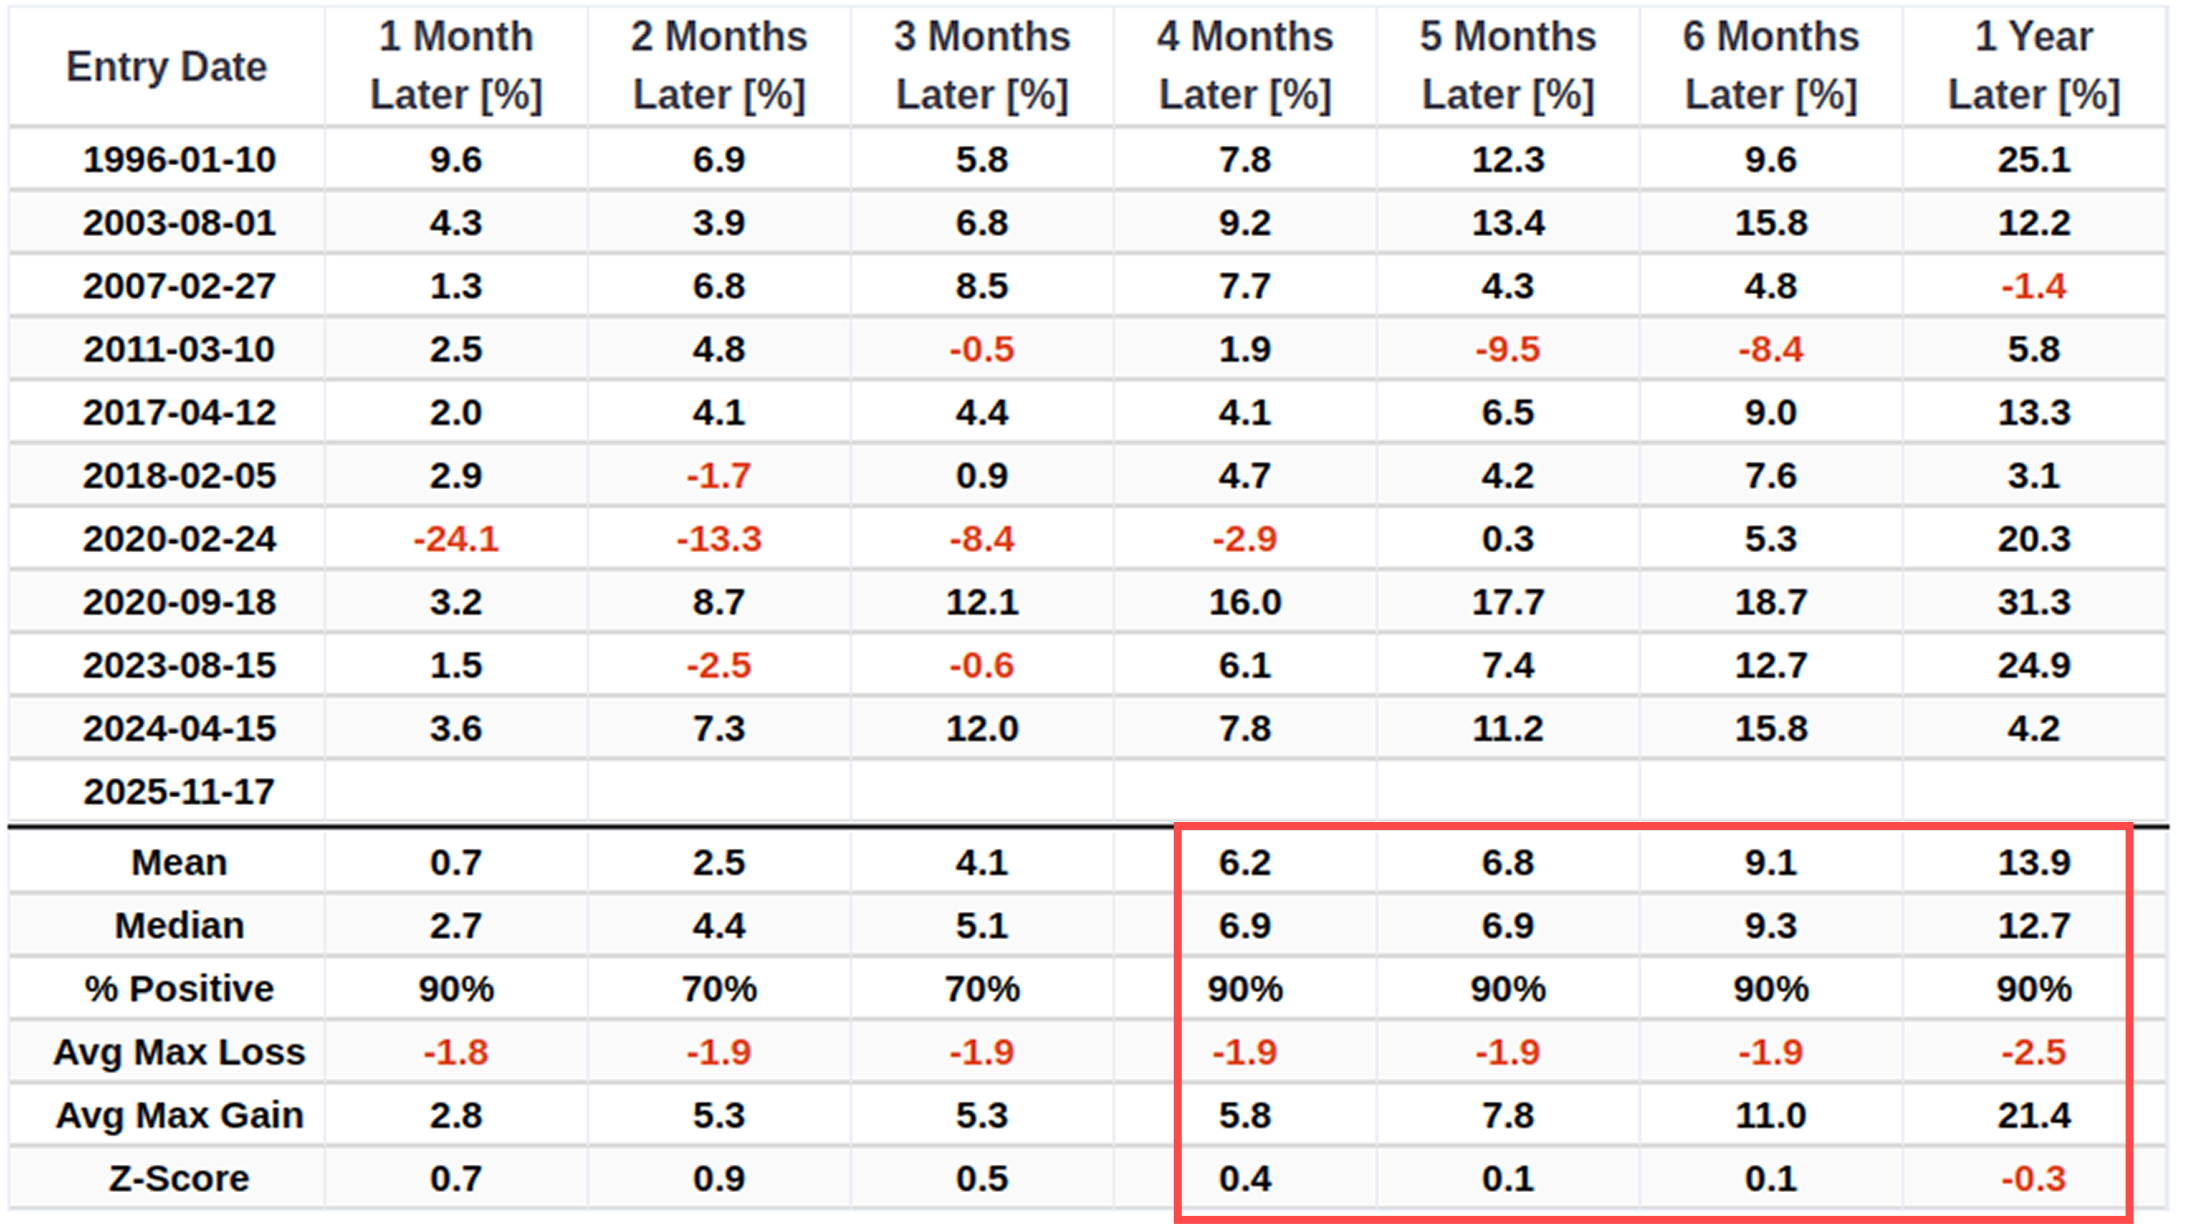
Narrowing the time frame to the past 30 years still yields 10 signals. Except for the extreme decline triggered by the COVID-19 outbreak in February 2020, the win rate is 70% for the 2-month and 3-month periods, and 90% for all other horizons. The data demonstrates high consistency-markets typically recover quickly from such pullbacks.Related Backtest Click Here.
The Smart Money/Dumb Money Confidence Spread
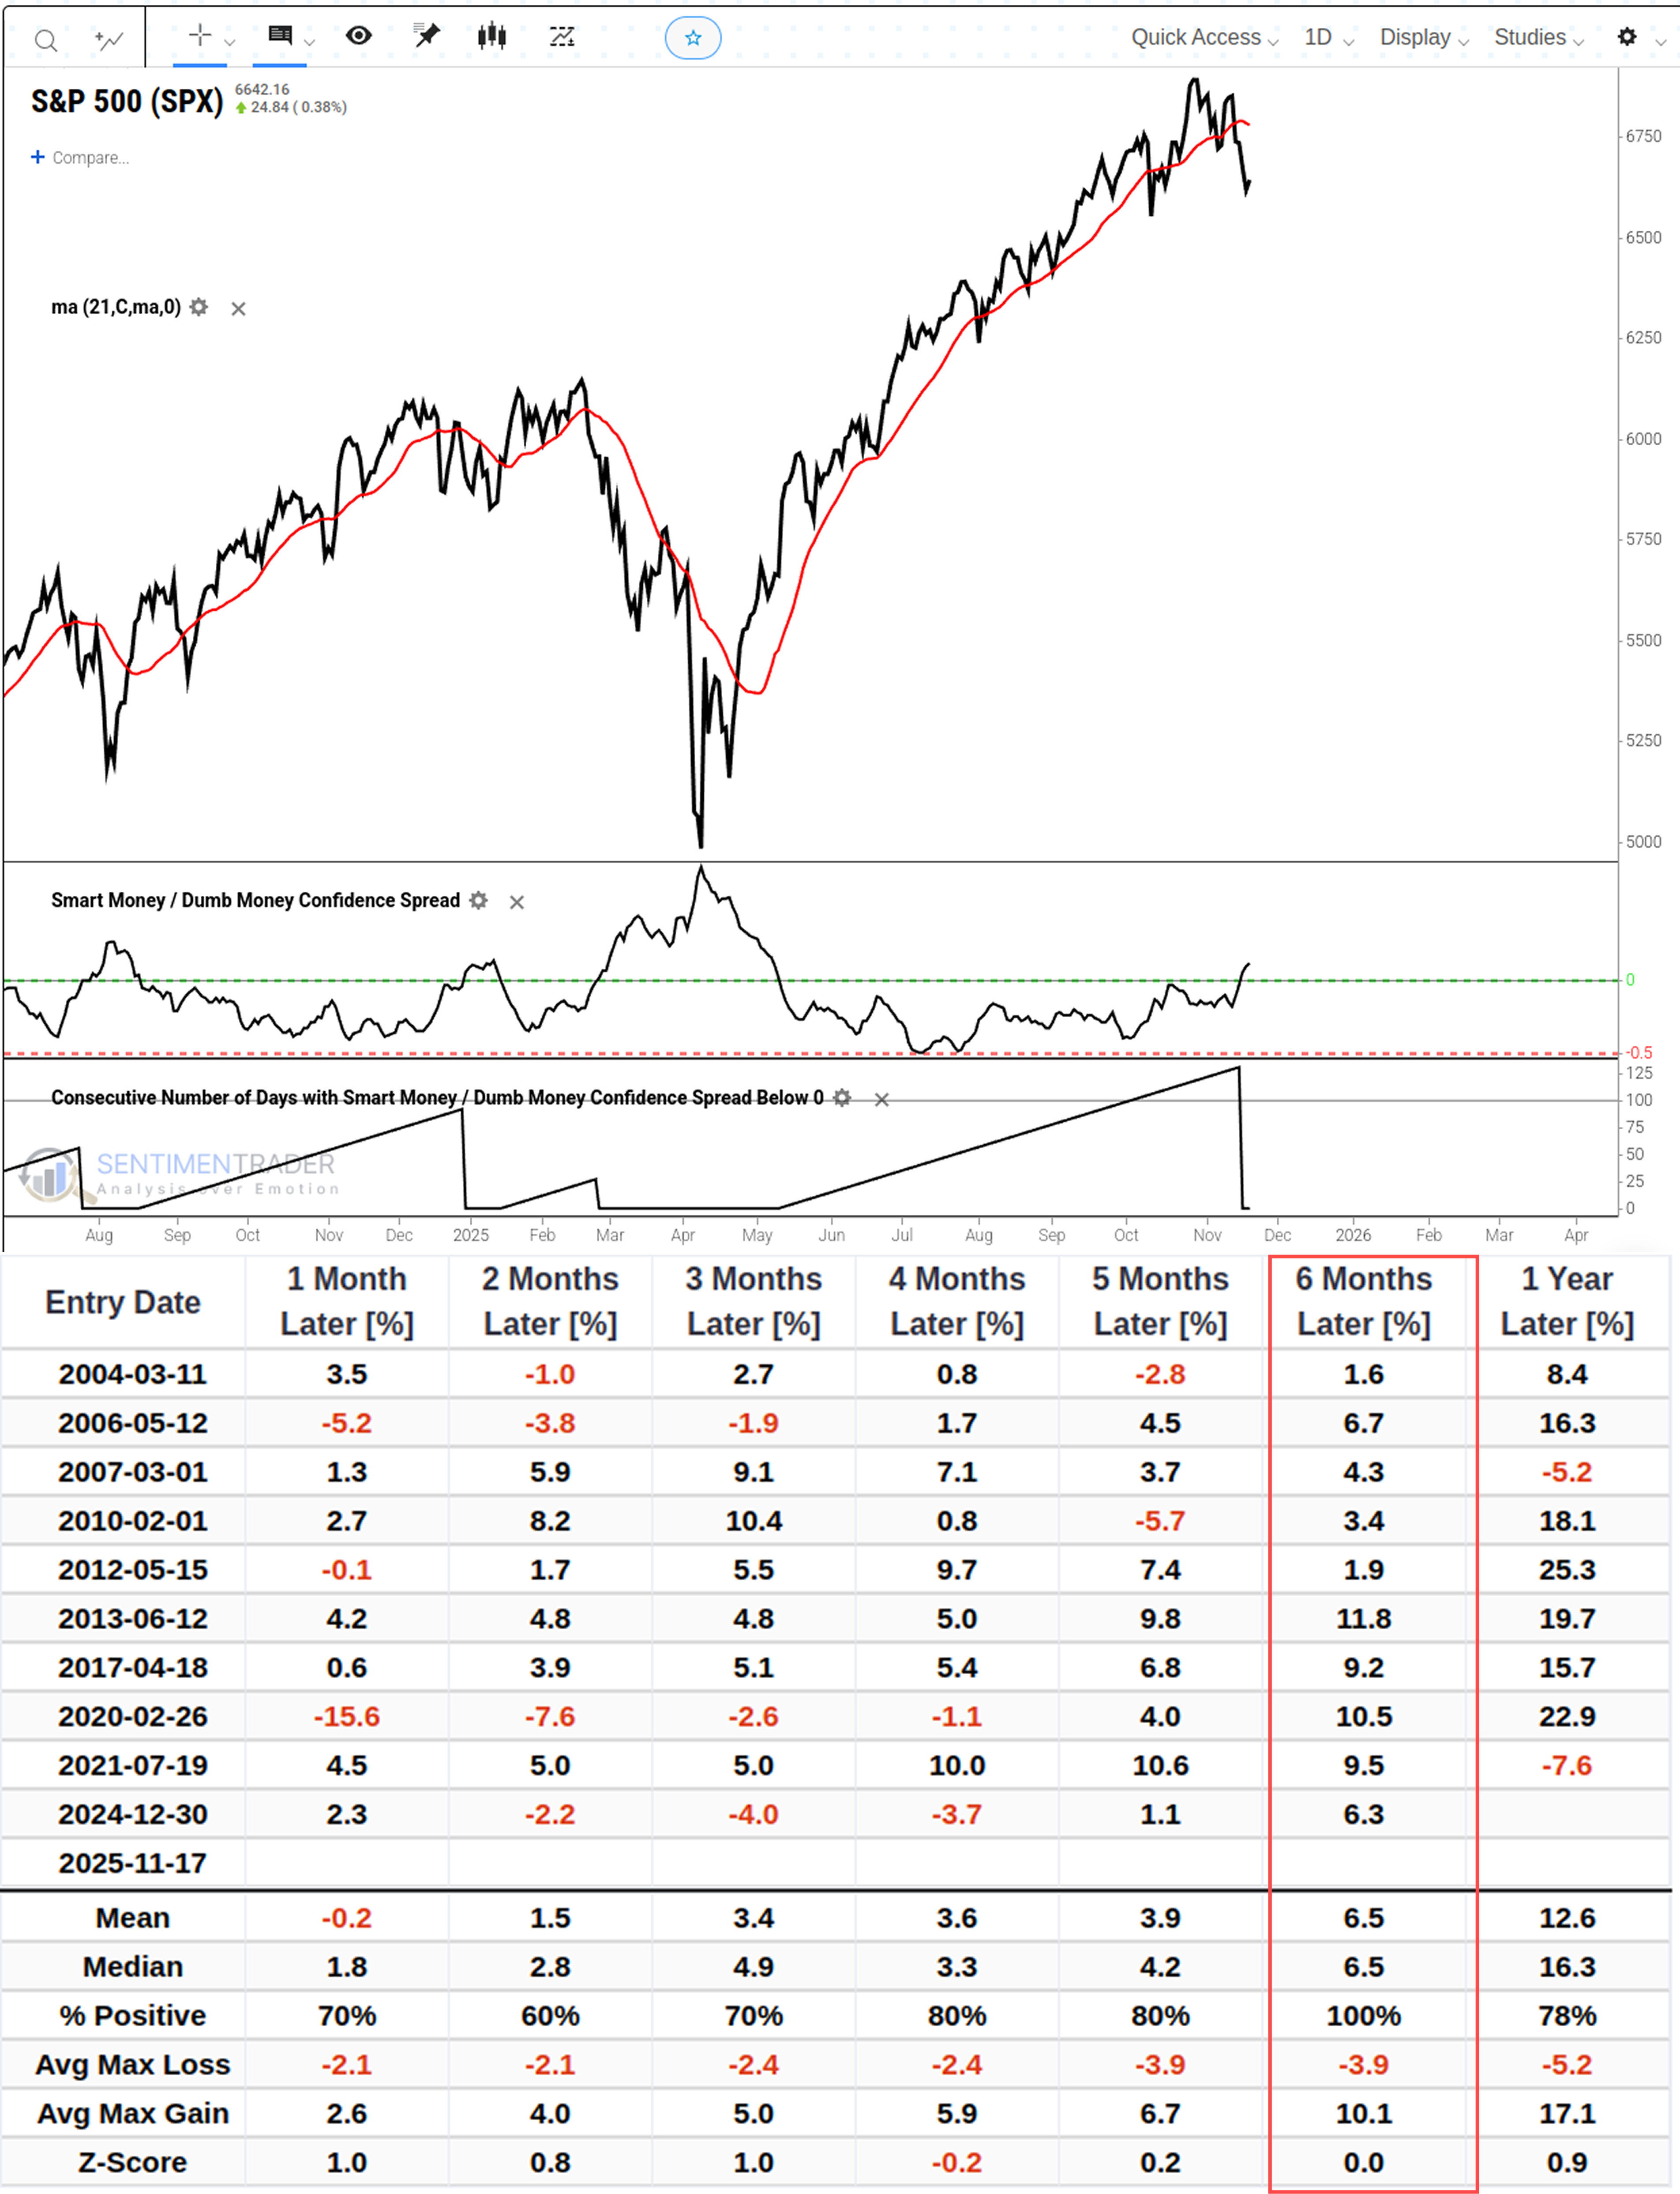
Our sentiment indicator, the Smart Money/Dumb Money Confidence Spread, has followed a similar trajectory to the market. Since August, this spread has remained in negative territory, meaning retail investors have been more optimistic than institutions. After staying below zero for an extended period, it recently formed a golden cross above zero for the first time.
The chart below shows the historical performance when the spread crosses above zero for the first time after being negative for more than 90 days. Looking at past data, the win rate for 6-month returns following such signals is an impressive 100%-despite potential volatility in the first three months and black swan events like the 2020 pandemic.Related Backtest Click Here.
Another Short-Term Indicator Signal
Additionally, we observed that the Short-term Optimism Index (Optix) reached a low on November 17, 2025. Generally speaking, if the Optix index falls below 40%, it indicates excessive pessimism across multiple metrics. A reading below 30% is even more extreme, suggesting a potential market rebound within the next 3-5 days. Like most of our indicators, these signals work best when going against the grain.
The chart below displays the historical performance when this indicator drops to 30 while the SPX is trading above its 200-day moving average.Related Backtest Click Here.
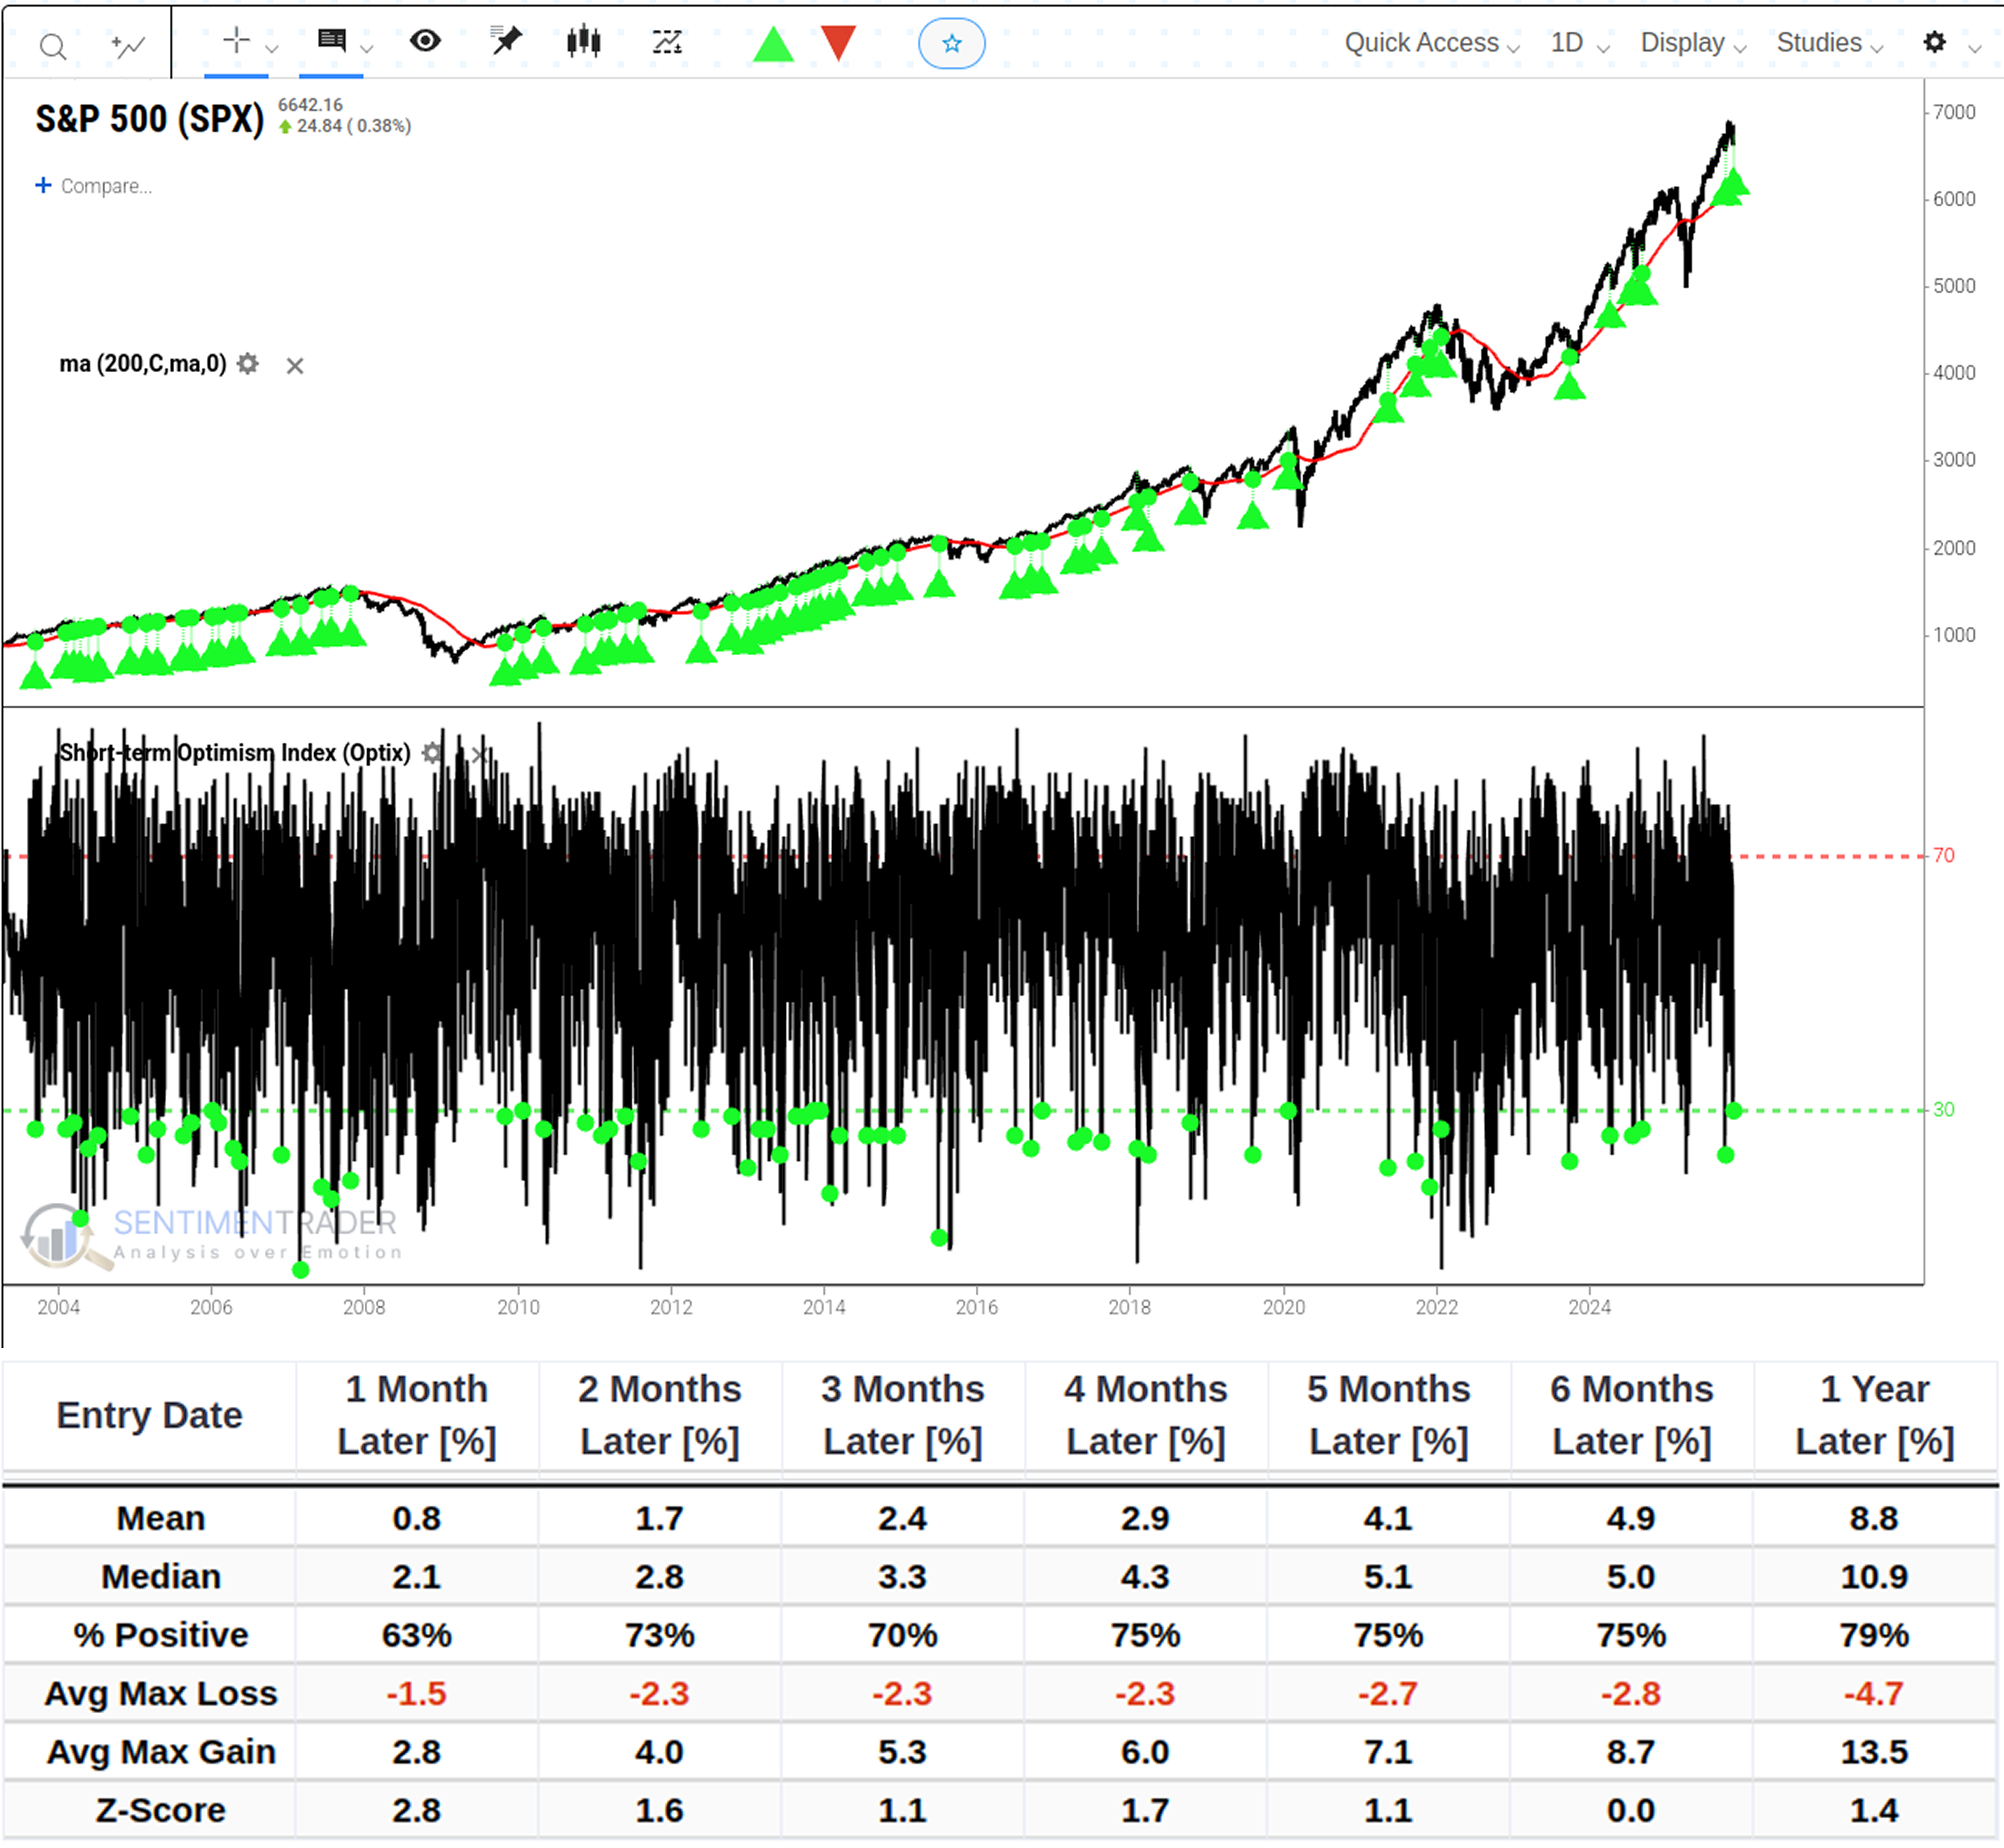
Based on 64 historical data points, while short-term returns are mixed (some cases see minor pullbacks in the first month), this setup offers an excellent risk-reward ratio. On average, the maximum downside risk following this signal is only around -1.5%. In short, this presents an opportunity to buy quality assets at a "discount" in a bull market.
Performance Across Sectors
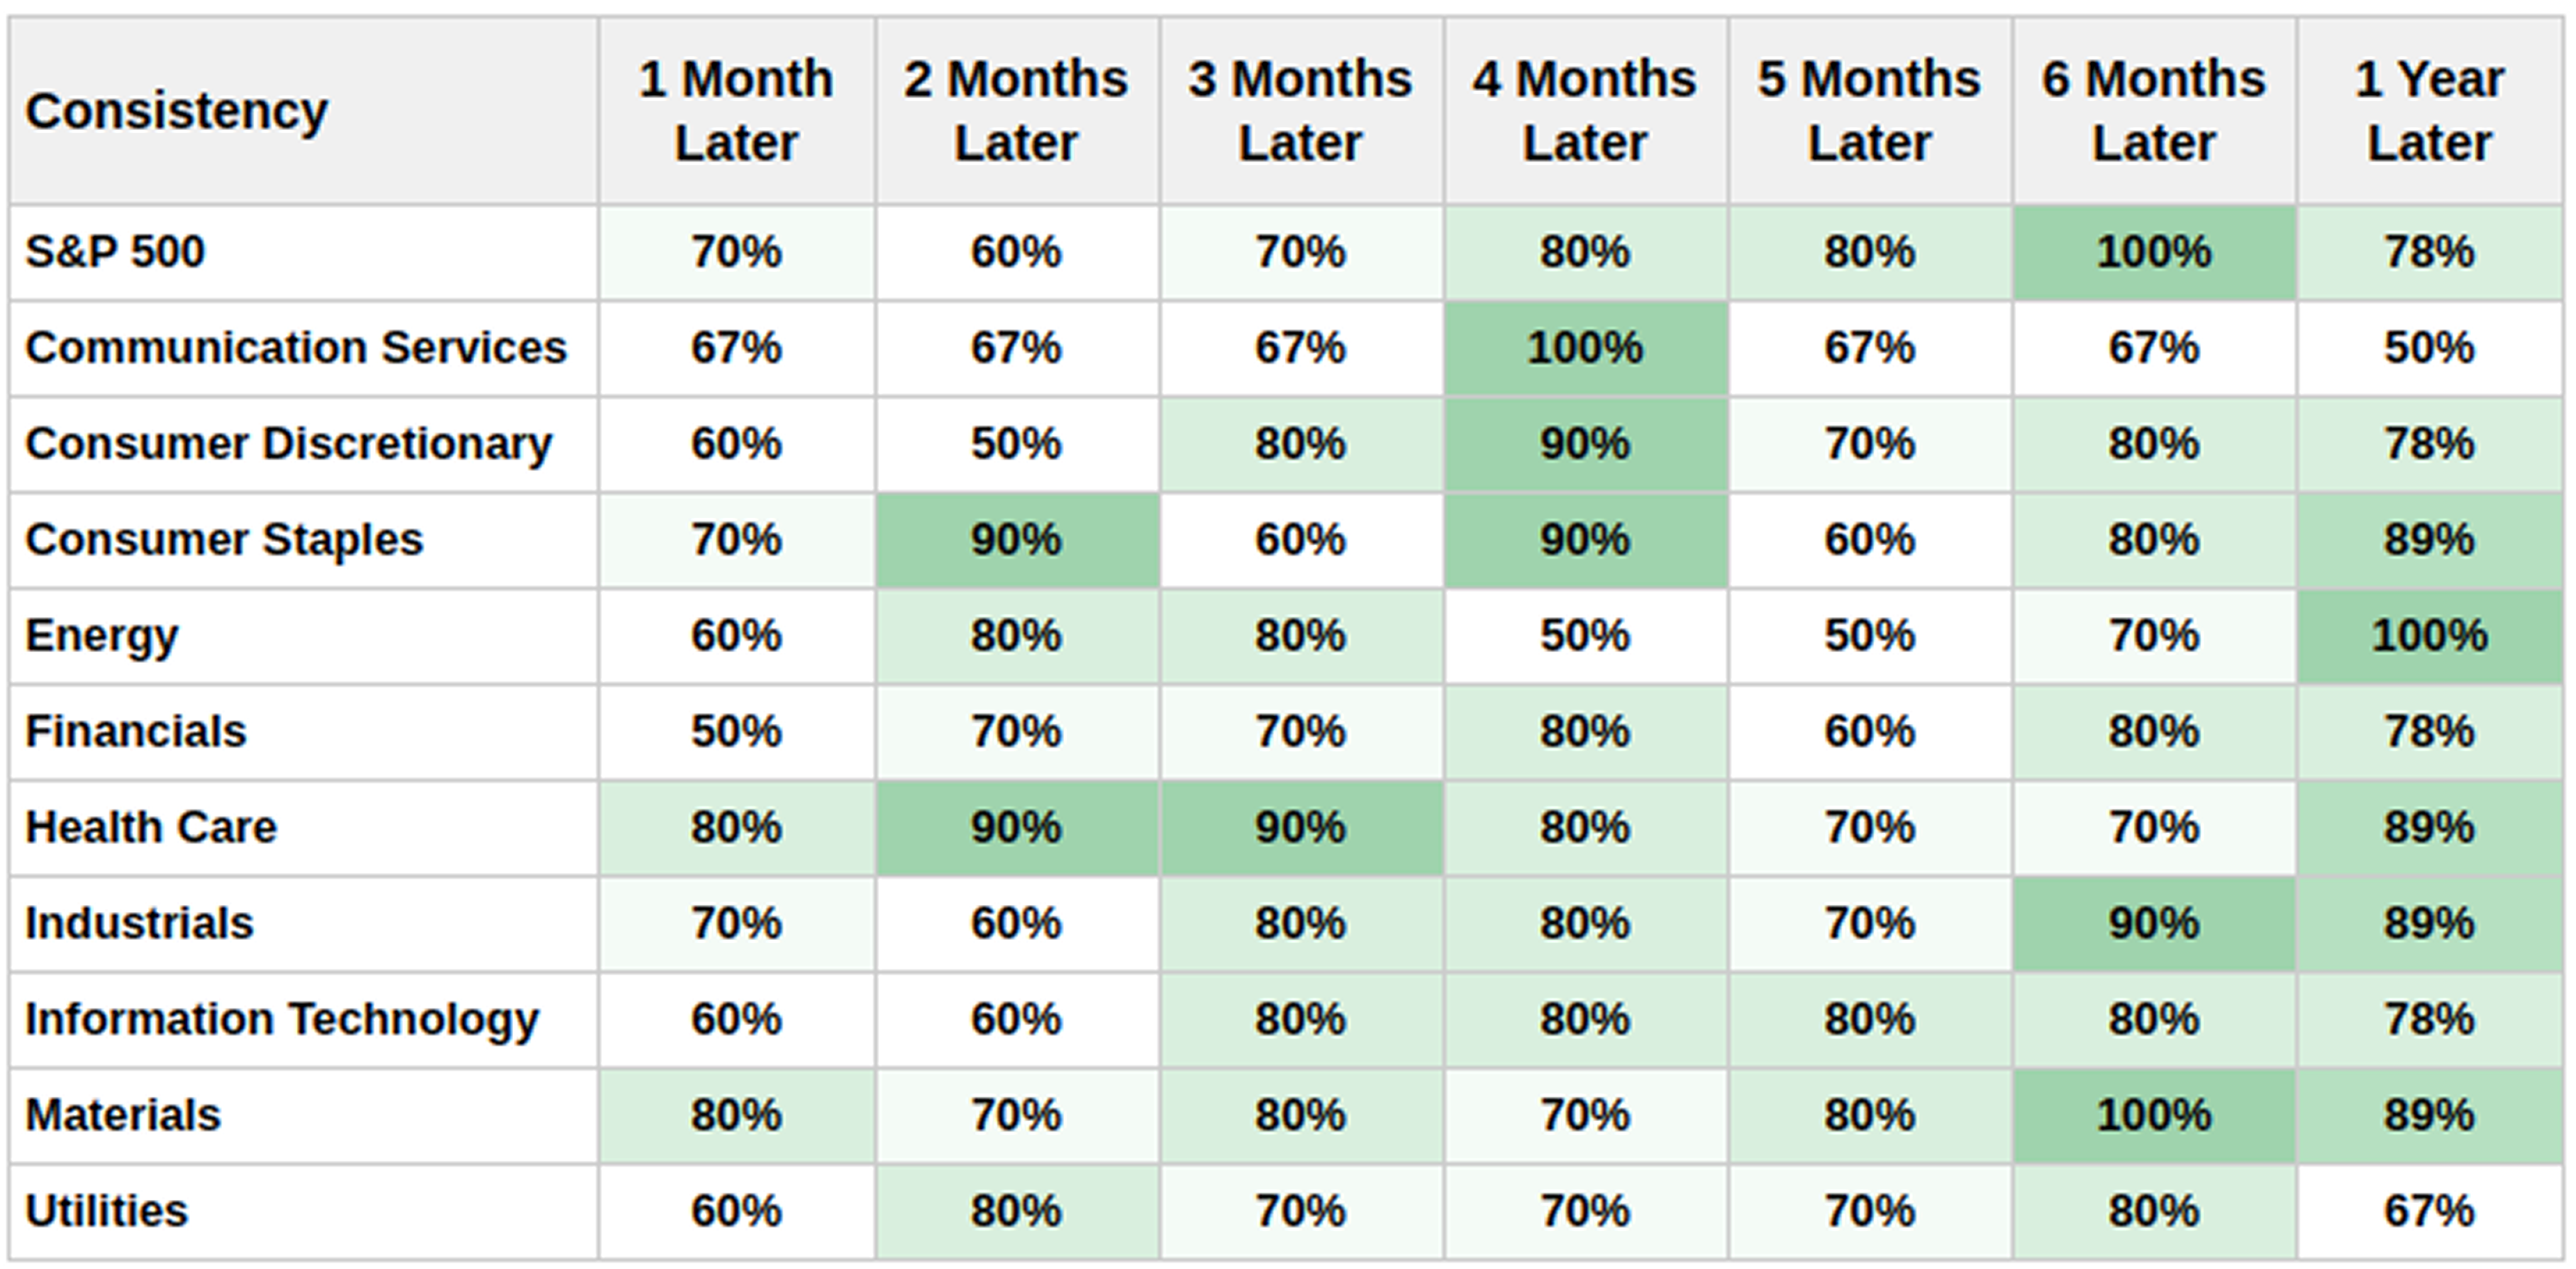
The charts below show the win rates and performance of various sectors following the Smart Money/Dumb Money signal.
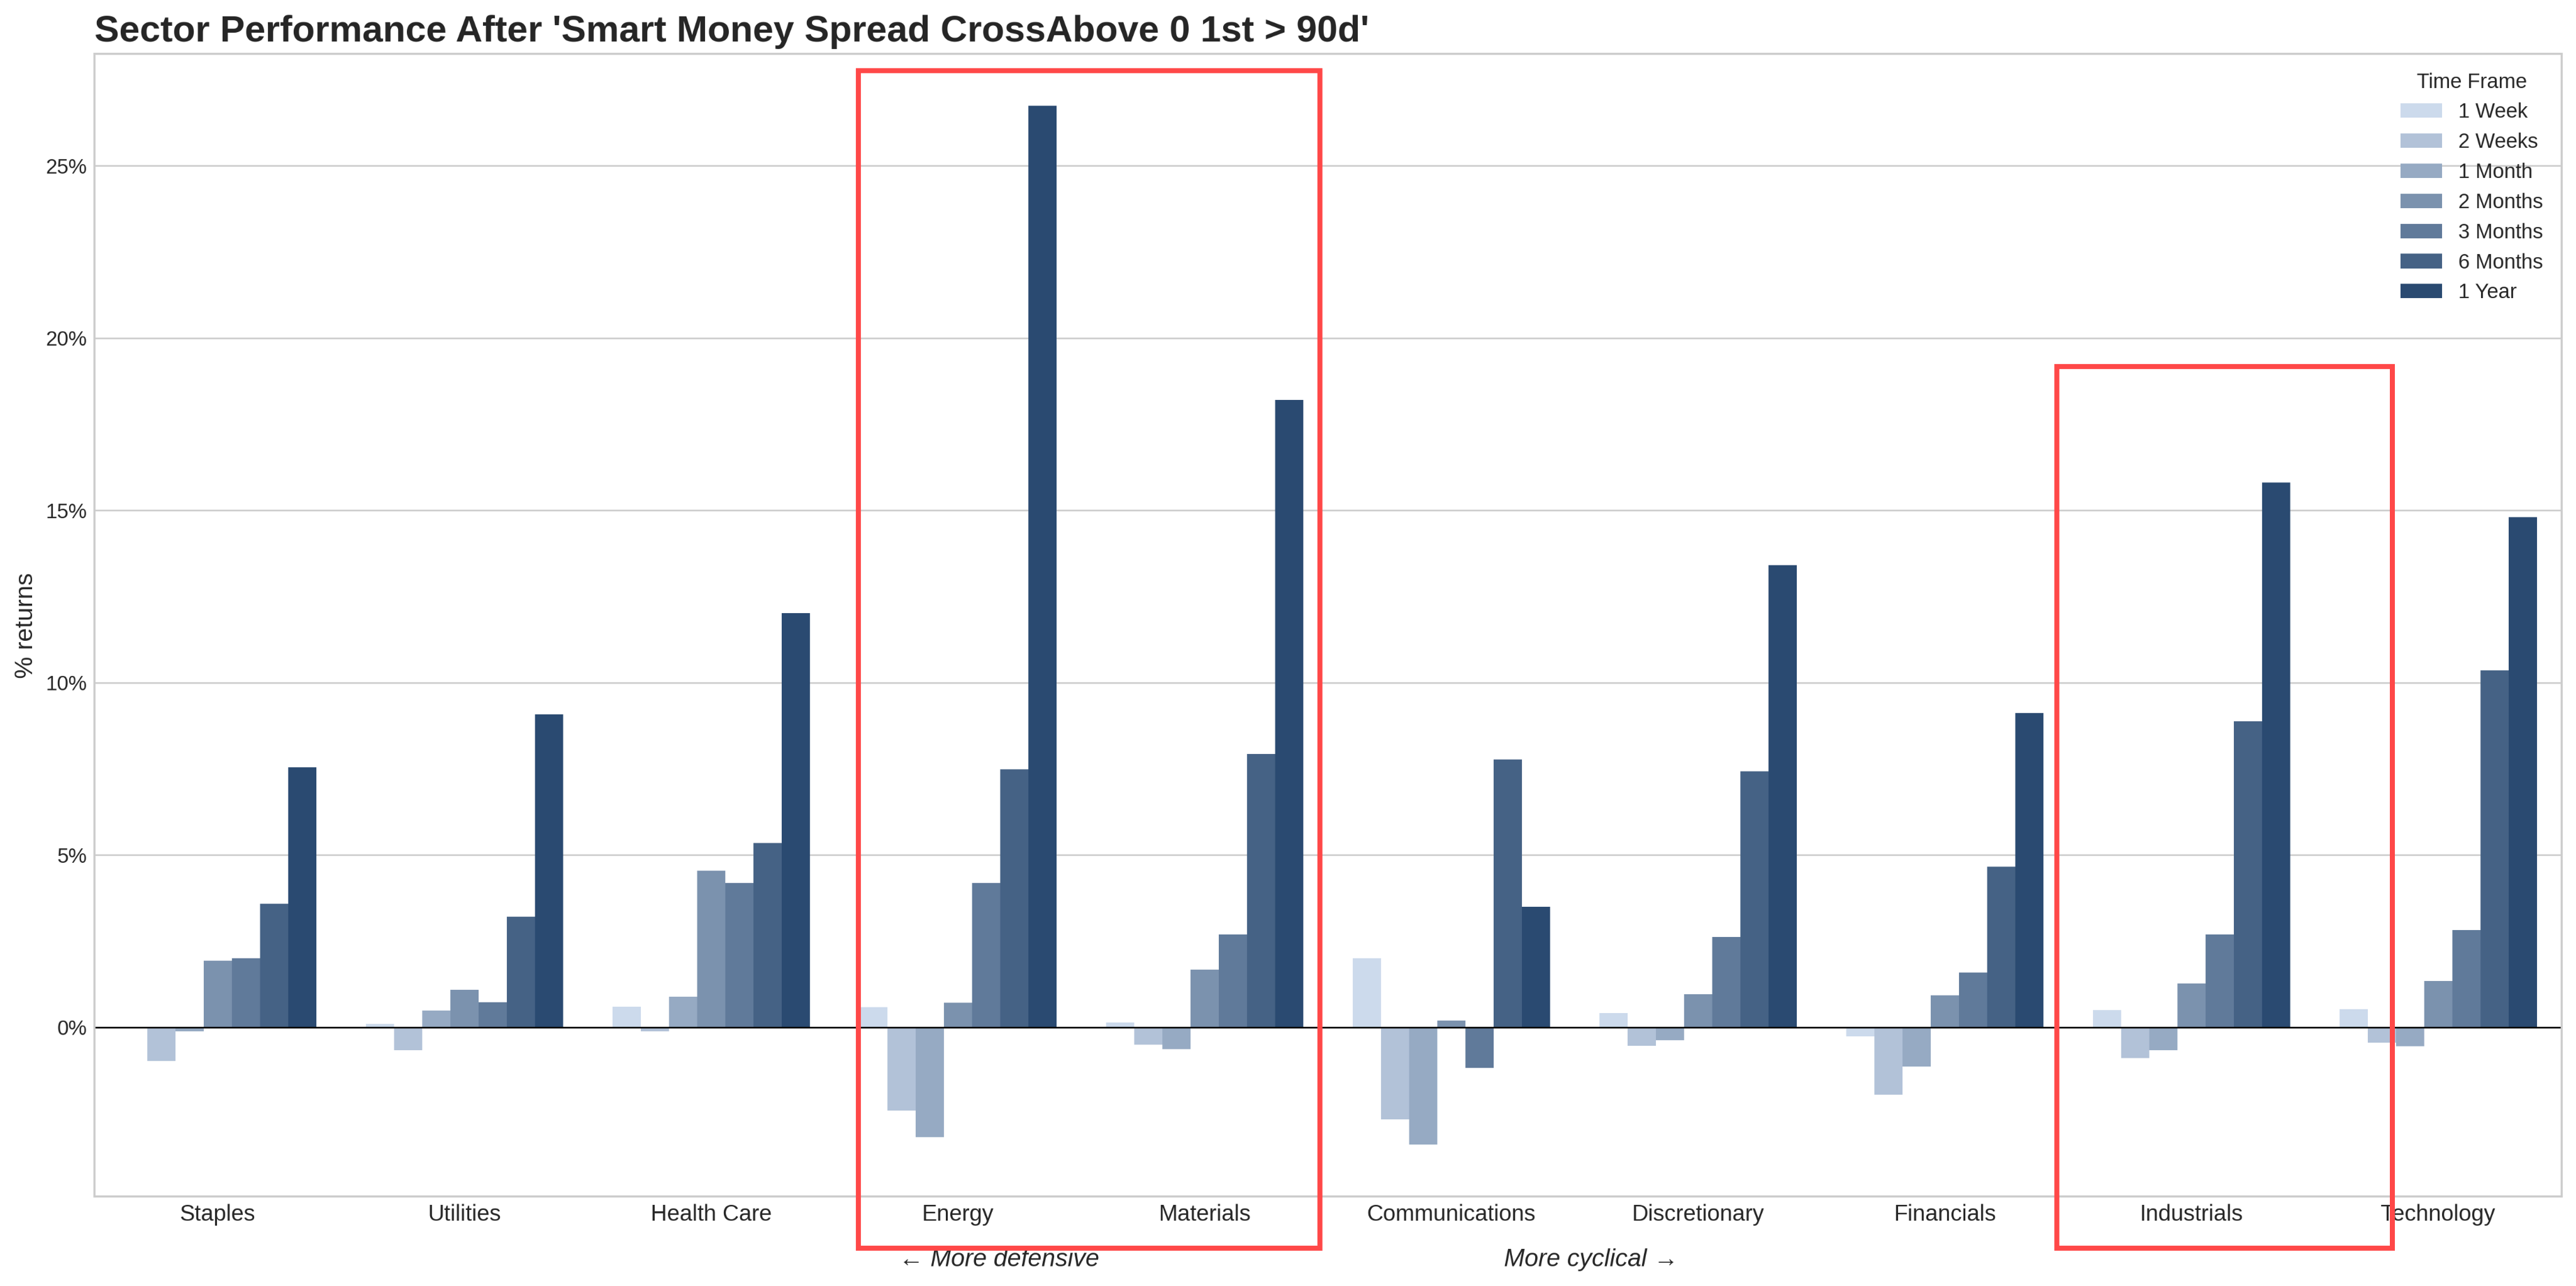
It can be seen that some traditional industrial sectors deliver higher forward returns, such as Materials, Energy, and Industrials.
What the Research Tells Us...
Market sentiment has undergone one of its most significant shifts in months. Despite the SPX's strong long-term performance, the recent break below the 50DMA has unexpectedly dented confidence, placing substantial pressure on market sentiment.
When the gap between Smart Money and Dumb Money confidence rises above zero after remaining below it for consecutive months (more than 90 days), it indicates that investors have completed the expected sharp adjustment following a prolonged period of one-sided optimism. This may seem tempting for bears, and the market may indeed face volatility or retracement in the shorter term. However, long-term market momentum (and institutional buying interest) is often not easily dissipated.
Following similar periods, stock markets typically exhibit strong upward trends over the next six months. This is usually not the end of the rally, but rather the starting point of a new round of broader growth.
Past performance is not indicative of future results. This article aims to provide an objective data perspective and a quantitative-based analytical approach, and does not constitute explicit trading advice or investment guidance.