
Time to keep an eye on XLY

Key Points
- The consumer discretionary sector has been in a solid downtrend since November 2021
- Presently, several indicators - including insider action, breadth, correlations, and seasonality are suggesting better days ahead for this troubled sector
The current trend
Between sharply rising inflation, higher interest rates, and warnings of an impending recession, the consumer discretionary sector has been hit hard. The current price trend for ticker XLY (Consumer Discretionary Select Sector SPDR Fund) is clearly unfavorable, as seen in the chart below (courtesy of StockCharts). From the November 2021 high to the June 2022 low, XLY lost -36% before rebounding ever so slightly. On a trend-following basis, the ETF remains well below its 200-day moving average, and the 200-day moving average has rolled over and is itself now in a downtrend.
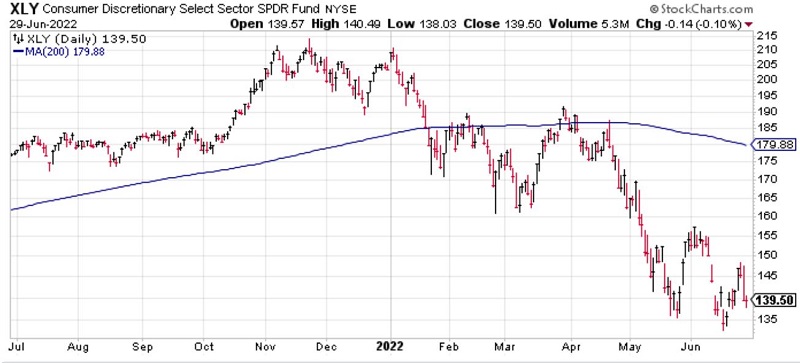
Indeed not a bullish picture. But the question is, "is there a chance that things will improve anytime soon." This is where things get a little more interesting. Let's look at several factors that seem to be arguing for better days ahead.
Insider Buy/Sell Ratio
The chart and table below display those times when the Corporate Insider Buy/Sell Ratio - XLY indicator crossed above 0.24.
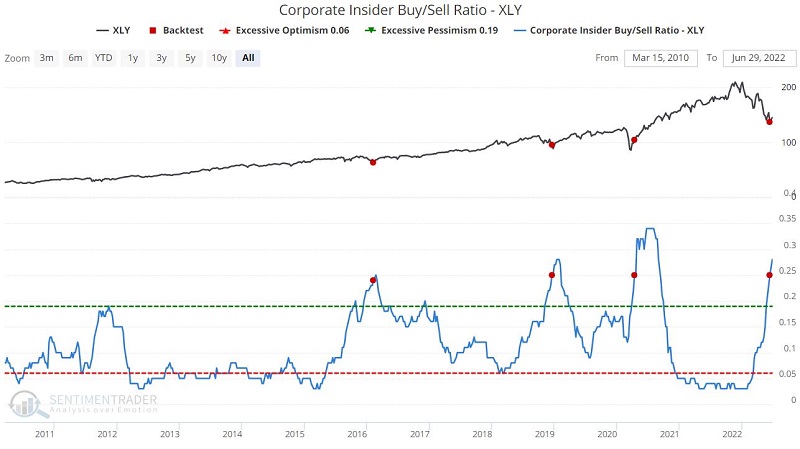
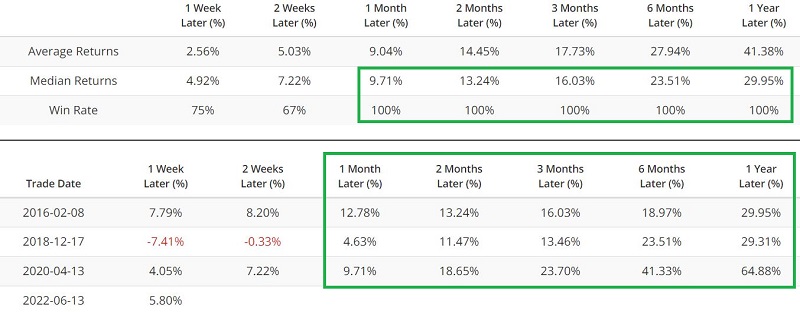
This is an exceptionally small sample size (from a very favorable overall period for stocks), and insiders are not always right - and/or are often early with their buying. Still, the implication is pretty apparent - insiders of the companies that comprise ticker XLY are bullish on their stocks. This does not necessarily argue for an immediate rebound but suggests that much damage has already been done.
XLY Breadth (% > 10 Day Avg)
Speaking of signals that tend to be early, the percentage of XLY components above their respective 10-day moving averages has hit zero on three occasions since mid-May. The chart and table below display those times when this indicator hit zero.
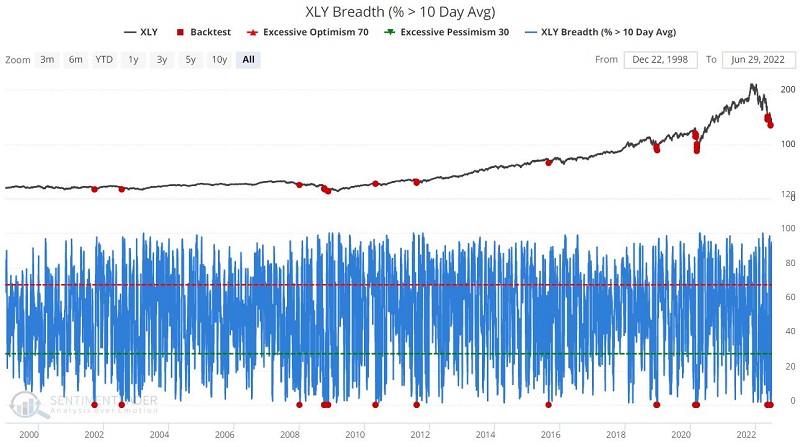
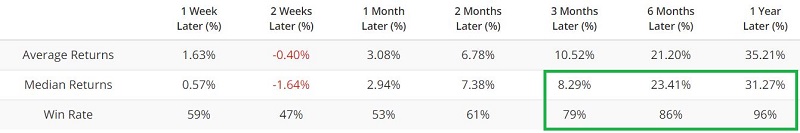
As you can see, this signal tends to be early; however, it has also typically been followed within 6-12 months by a strong bullish reversal.
XLY Component Correlation
High component correlation for an index fund typically occurs when the price is in a downtrend and often highlights a period when investors are dumping the stocks in the index indiscriminately in a bearish panic.
The chart and table below display those times when the XLY Component Correlation crossed above 0.70 for the first time in six months
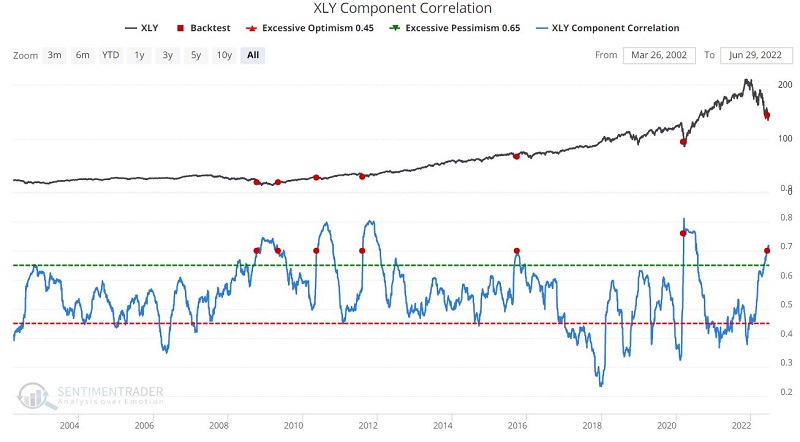
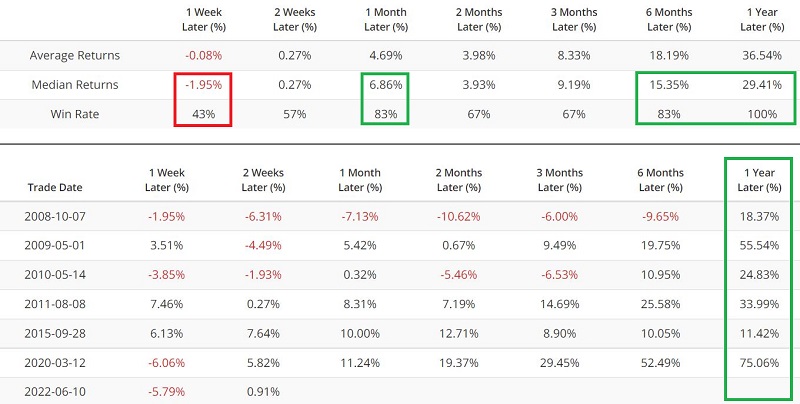
The latest signal occurred on 6/10/2022.
Seasonality
The chart below displays the annual seasonal trend for ticker XLY. Note the brief seasonally favorable period that extends from the close on TDY #121 through TDY #137.
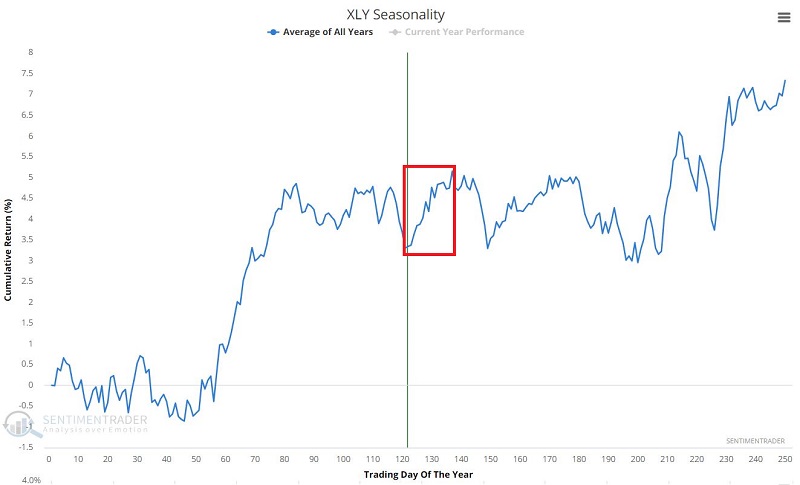
For 2022, this period extends from the close on 6/27 through the close on 7/20. For illustration, I used our Consumer Discretionary sector data from 1953 through 2021 to test this time period. The chart below shows the hypothetical cumulative % + (-) achieved by holding this sector only during this favorable period.
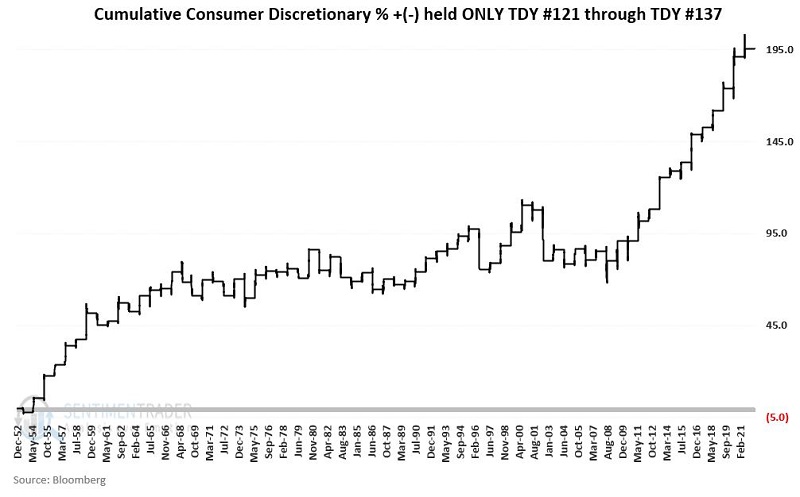
The table below displays a summary of performance for the Consumer Discretionary sector during this period.
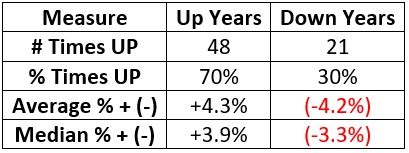
This period is by no means a "sure thing" (70% in Rate) and the 2022 period is off to a terrible start (down -4% in just two trading days). But if the recent low of $133.04 and of XLY stages a reversal, a short pop in early July remains a possibility.
What the research tells us…
The conventional wisdom regarding the consumer discretionary sector is pretty straightforward: Consumer discretionary is a sector in the middle of a justifiable downtrend, based on inflation, interest rates, and economic uncertainty. Ticker XLY barely holds above a very tenuous low of $133.04 a share.
What we have seen here, however, is several signals suggesting that the consumer discretionary sector could be poised for a rebound (in the short-term based on seasonality if support holds and over the next 6-12 months based on insider buying, breadth, and correlations). If XLY breaks down through recent support like a hot knife through butter, then all bets are off. However, as long as the recent low holds - or if it is taken out temporarily, then price reverses back above the "line in the sand," aggressive traders might consider looking for an opportunity to play this sector. Less aggressive investors might wait patiently for a clear sign of a reversal and look ahead to better days in the 6 to 12 month timeframe.