
Time to Keep an Eye on Biotech

Key Points
- Optix on ticker XBI (SPDR S&P Biotech ETF) has reached a level that has often signaled the potential for a short-term rebound
- Also, a subsequent reversal and increase in XBI Optix could generate another tradable signal
Tough sledding for biotech
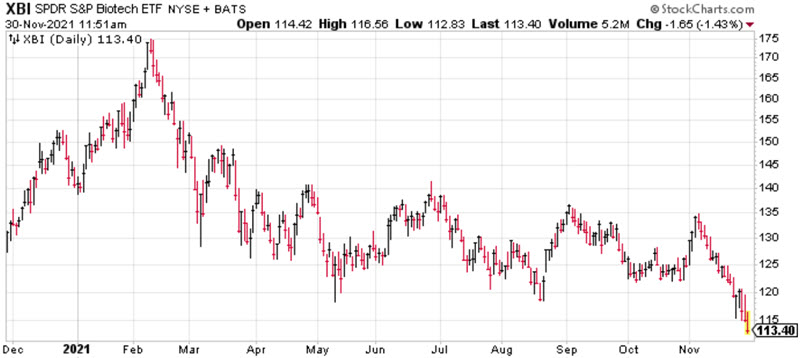
The chart below (courtesy of StockCharts) displays the price action for ticker XBI. The ETFs shares have been steadily declining since early November and are well off their February 2021 high.
XBI Optix 50-day average drops below 40%
The chart below displays those times when the XBI Optix 50-day moving average dropped below 40% for the first time in a month. You can run this test by clicking here.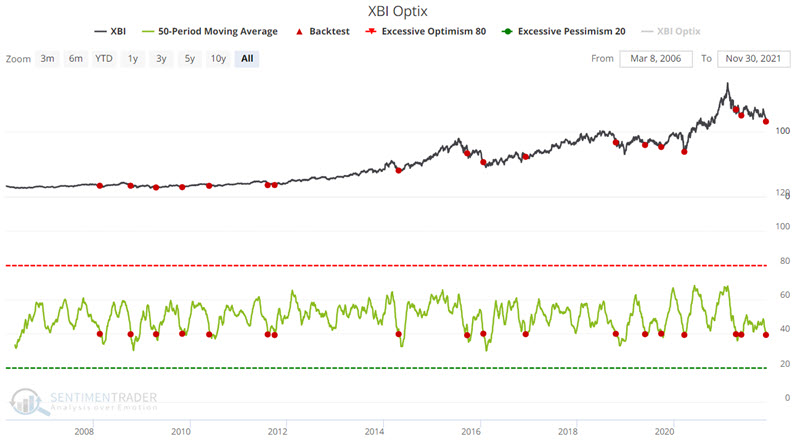
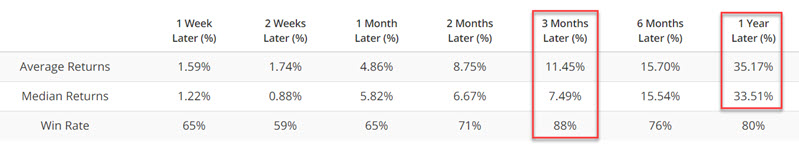
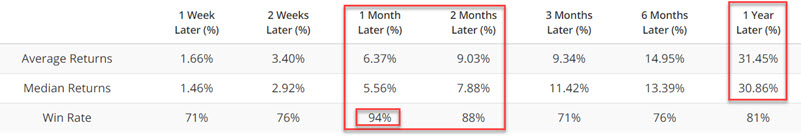
The table below displays XBI performance following previous signals. Two things to note:
- A 3-month holding period has had an 88% Win Rate
- 12-month Average and Median returns have been over +30%
Watching for an XBI Optix 50-day average back above 40%
At times buying when XBI first pierces 40% to the downside can seem like trying to catch a falling safe. An additional/alternative signal occurs when the 50-day moving average of the XBI Optix rises back above 40%.
The chart below displays the dates on which the 50-day moving average for XBI Optix moved back above 40% for the first time in a month. You can run this test by clicking here.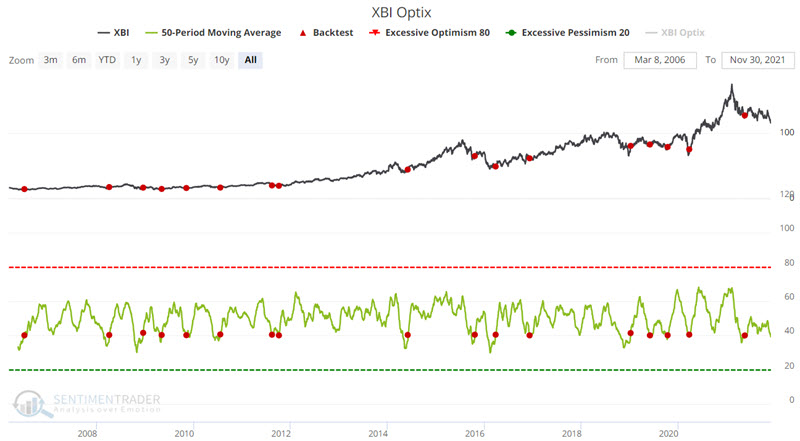
The table below displays XBI performance following previous signals. Two things to note:
- One and 2-month holding periods have had a very high Win Rate
- 12-month Average and Median returns have been over +30%
What the research tells us…
- A downswing in investor optimism typically accompanies sharp declines in the price of ticker XBI
- When this downswing becomes overdone (i.e., when the 50-day average of XBI Optix drops below 40%), it often signals that a reversal is near
- Likewise, when XBI Optix reverses and advances from an oversold level (i.e., when the 50-day average crosses back above 40%), it typically offers traders a second bite of the apple