
Time to Keep a Close Eye on QQQ

The stock market pulled back in September and early October, which caused a great deal of angst among a large portion of the investment population. And given all of the excesses that we have seen (and cataloged here at Sentimentrader) along with high valuations and soaring inflation, there is every chance that the recent increase in worry is not without merit.
That said, at least two factors are flashing signs of hope for the Nasdaq 100 Index and the most heavily traded vehicle that tracks NDX performance - ticker QQQ (Invesco QQQ Trust).
QQQ OPTIX
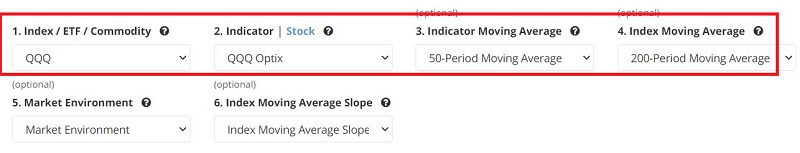
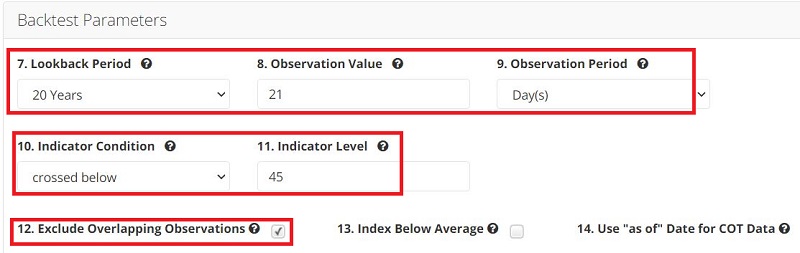
This test looks at investor sentiment for ticker QQQ and identifies those times when:
- The 50-period moving average of QQQ Optix
- Crosses below 45
- For the first time in 21 days
- While QQQ is ABOVE its 200-day moving average
- In the past 20 years
In a nutshell, this scan looks for waning optimism within the context of an existing longer-term uptrend in price.
The input screens appear below. You can run this test by clicking here.
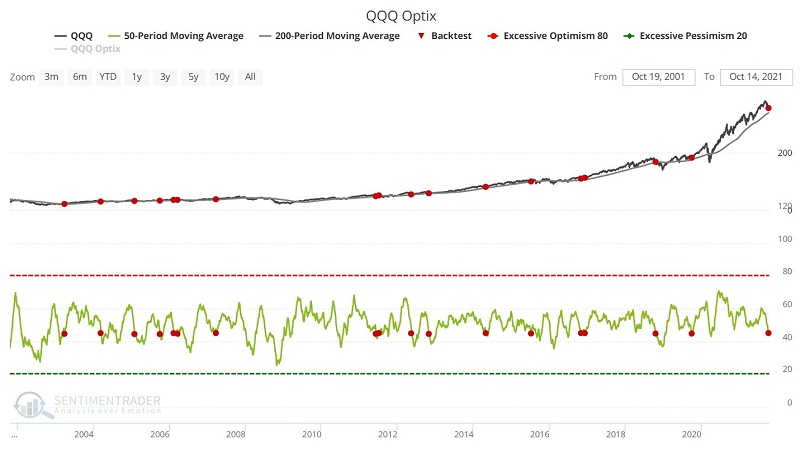
The chart below displays previous signals. The most recent signal occurred on 10/8/2021.
 The table below displays a summary of the results.
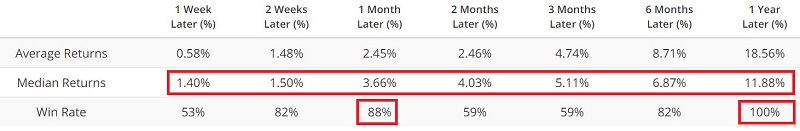 As you can see:
- The highest Win Rates were for 1-month and 1-year after a signal
- The Median Returns improve from each time frame to the next
SEASONALITY
The chart below displays the Annual Seasonal Trend for ticker LQD.
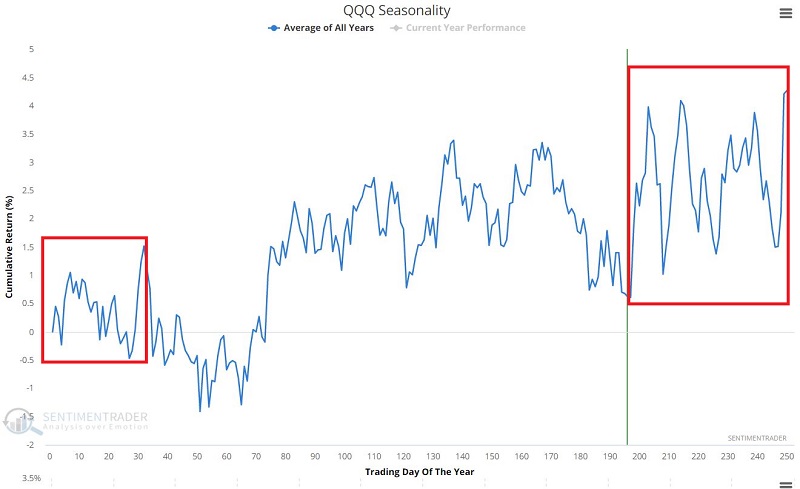 Note that a period Optix of seasonal strength begins after Trading Day of Year (TDY) #197 and extends through TDY #32 of the following year (though not without the potential for some volatile swings along the way).
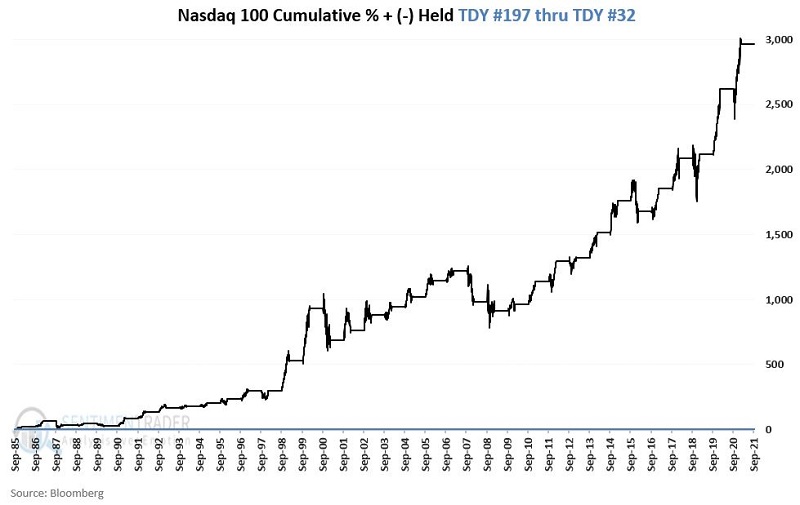
For testing, we will use the Nasdaq 100 Index itself, which can be tested back to 1985 (and is the index that QQQ tracks).
The chart below displays the hypothetical cumulative % growth from holding the Nasdaq 100 Index ONLY from TDY #197 each year through TDY #32 of the following year, starting in October 1985.
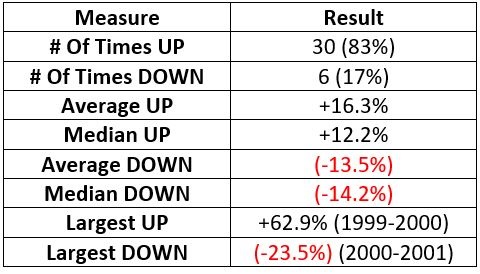
 The table below displays a summary of the results.
SUMMARY
So, based on the factors detailed above, is the tech-heavy Nasdaq 100 Index "off to the races" again? And is the market "guaranteed" to be higher 12 months from now? Not at all. But they do suggest that investors might consider giving the bullish case the benefit of the doubt unless and until QQQ takes out recent support near 350 and/or closes below its 200-day moving average.