Products
SentimenTrader Trading Tools
‍
Backtest Engine
My Trading Toolkit
Correlation Analysis
Seasonality
Indicators & Data API
‍
Proprietary Indicators & Charts
Market Data API
Strategies & Scanner
‍
50+ Trading Strategies
Smart Stock Scanner
Research Reports
‍
Research Solutions
Reports Library
Free Resources
Simple Backtest Calculator
Simple Seasonality Calculator
The Kelly Criterion Calculator
Sentiment Geo Map
Public Research Reports
Pricing
Company
About
In the News
Testimonials
Client Success Stories
Contact
Log inLoginSign up
< BACK TO ALL REPORTS

Time to Keep a Close Eye on Corporate Bonds

Jay Kaeppel
2021-10-14
A lot of doubt and fear has crept into the bond market of late. This is not surprising given that interest rates are still near all-time lows, and inflation is relatively high and a cause of major concern for fixed-income investors. Still, at least two factors are flashing signs of hope for investment-grade corporate bonds in the months ahead.

A lot of doubt and fear has crept into the bond market of late. This is not surprising given that interest rates are still near all-time lows, and inflation is relatively high and a cause of major concern for fixed-income investors.

Still, at least two factors are flashing signs of hope for investment-grade corporate bonds in the months ahead.

OPTIX

Jason recently pointed out the dearth of optimism in the corporate bond market. In this case, we can use this as a contrarian sign by using this test (which you can run by clicking here).

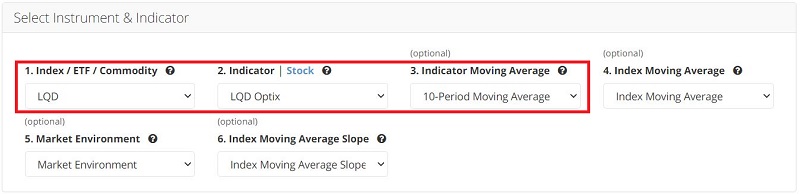
This test looks at investor sentiment for ticker LQD (iShares iBoxx $ Investment Grade Corporate Bond ETF) and identifies those times when:

  • The 10-period moving average of LQD Optix
  • Crosses below 20

The input screens appear below.

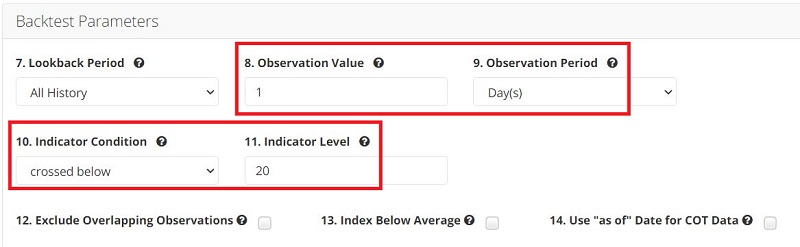
The chart below displays previous signals.

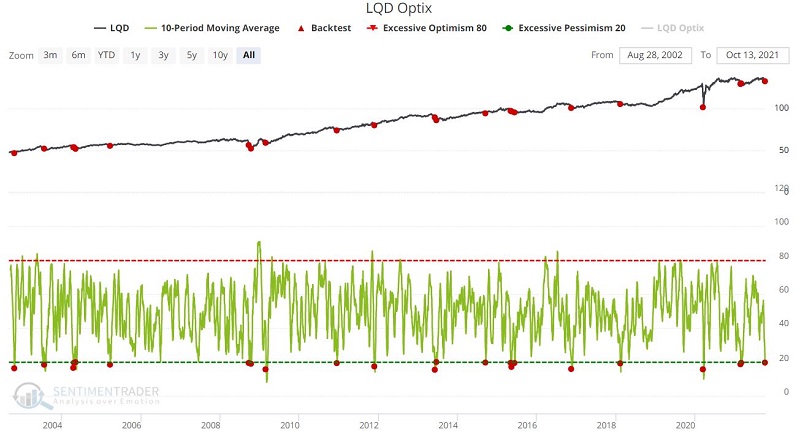
The most recent signal occurred on 10/8/2021, as seen in the chart below.

The table below displays a summary of the results.

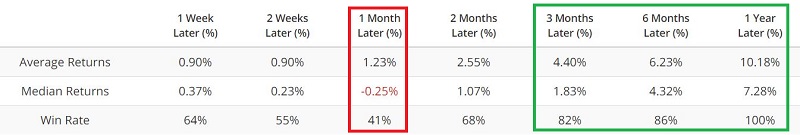
As you can see, investment-grade bond performance is so-so in the first month after a new Optix signal. After that, however, results improve significantly.

SEASONALITY

The chart below displays the Annual Seasonal Trend for ticker LQD.

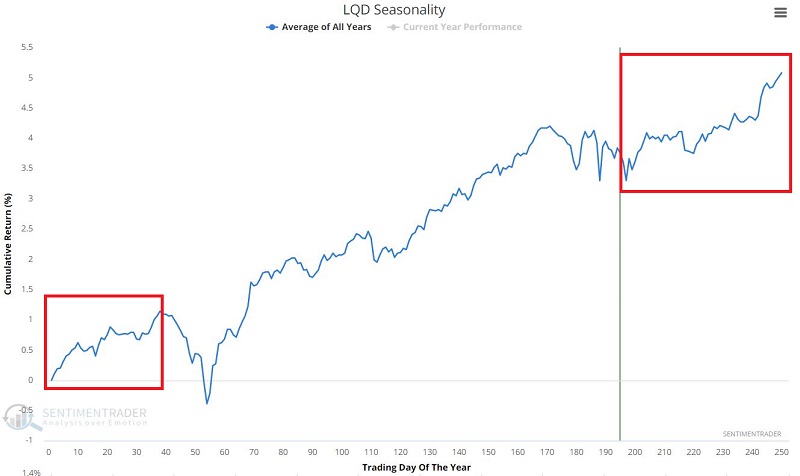
Note that a period of seasonal strength begins after Trading Day of Year (TDY) #197 and extends through TDY #38 of the following year.

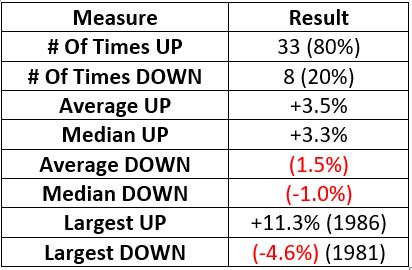
To test the performance of investment-grade bonds during this seasonal period, we will use daily total return data for ticker FBNDX (Fidelity Investment Grade Bond Fund), which has data back to 1980. The chart below displays the cumulative total return for FBNDX if held ONLY from TDY #197 through TDY #38 of the following year, every year since 1980.
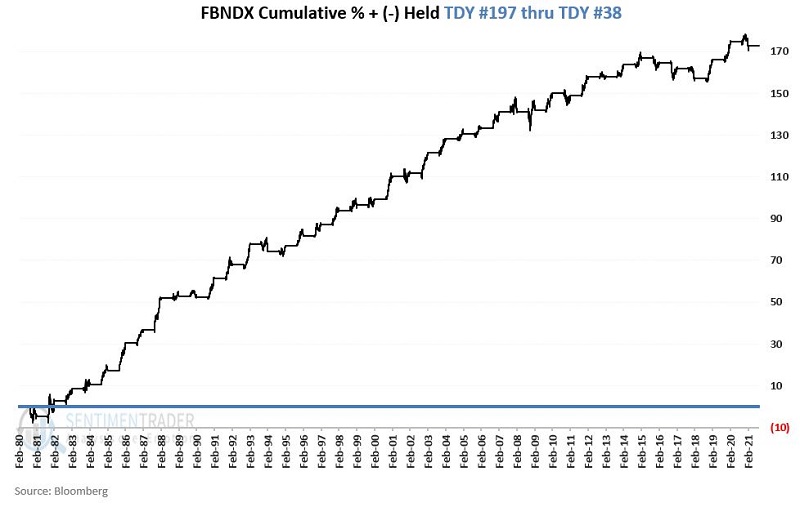
The table below displays a summary of performance.

SUMMARY

So, do the factors detailed above "guarantee" that investment-grade corporate bonds are sure to rally in the months ahead? Not at all. Bond price movements are primarily a function of interest rates. 

3 things to note about interest rates:

  • They have been in a downtrend for almost 40 years
  • They are still near all-time lows
  • They may ultimately get pushed higher as a function of inflation

In other words, bonds are not the "slam dunk" they were during the past several decades as interest rates steadily declined. Still, bearish sentiment and bullish seasonality are often a winning combination.

Sorry, you don't have access to this report

Upgrade your subscription plan to get access
Go to Dasboard
PRODUCTS
SentimenTrader
Trading Tools
Indicators & Data API
‍
Strategies & Scanner
‍
Research Reports
FREE
RESOUrCES
Simple Backtest
Calculator
Simple Seasonality
Calculator
The Kelly Criterion
Calculator
Sentiment Geo Map
‍
Public Research Reports
‍
Pricing
Bundle pricing
‍
Announcements
‍
FAQ
COMPANY
‍
About
‍
In the News
‍
Testimonials
‍
Client Success Stories
CONTACT
‍
General Inquiries
‍
Media Inquiries
‍
Financial Professionals Inquiries
‍
© 2025 Sundial Capital Research Inc. All rights reserved.
Setsail Marketing
TermsPrivacyAffiliate Program
Risk Disclosure: Futures and forex trading contains substantial risk and is not for every investor. An investor could potentially lose all or more than the initial investment. Risk capital is money that can be lost without jeopardizing ones’ financial security or life style. Only risk capital should be used for trading and only those with sufficient risk capital should consider trading. Past performance is not necessarily indicative of future results.

Hypothetical Performance Disclosure: Hypothetical performance results have many inherent limitations, some of which are described below. No representation is being made that any account will or is likely to achieve profits or losses similar to those shown; in fact, there are frequently sharp differences between hypothetical performance results and the actual results subsequently achieved by any particular trading program. One of the limitations of hypothetical performance results is that they are generally prepared with the benefit of hindsight. In addition, hypothetical trading does not involve financial risk, and no hypothetical trading record can completely account for the impact of financial risk of actual trading. for example, the ability to withstand losses or to adhere to a particular trading program in spite of trading losses are material points which can also adversely affect actual trading results. There are numerous other factors related to the markets in general or to the implementation of any specific trading program which cannot be fully accounted for in the preparation of hypothetical performance results and all which can adversely affect trading results.

Testimonial Disclosure: Testimonials appearing on this website may not be representative of other clients or customers and is not a guarantee of future performance or success.