Products
SentimenTrader Trading Tools
‍
Backtest Engine
My Trading Toolkit
Correlation Analysis
Seasonality
Market Prediction
Indicators & Data API
‍
Proprietary Indicators & Charts
Market Data API
Strategies & Scanner
‍
50+ Trading Strategies
Smart Stock Scanner
Smart Option Scanner
Research Reports
‍
Research Solutions
Reports Library
Free Resources
Simple Backtest Calculator
Simple Seasonality Calculator
The Kelly Criterion Calculator
Sentiment Geo Map
Public Research Reports
Education
Sentiment Indicators
Technical Indicators
Pricing
Company
About
In the News
Testimonials
Client Success Stories
Contact
Log inLoginSign up
< BACK TO ALL REPORTS

Thursday Midday Color

Jason Goepfert
2019-03-28
null

Here's what's piquing my interest so far on this fading rally day.

Breadth Review

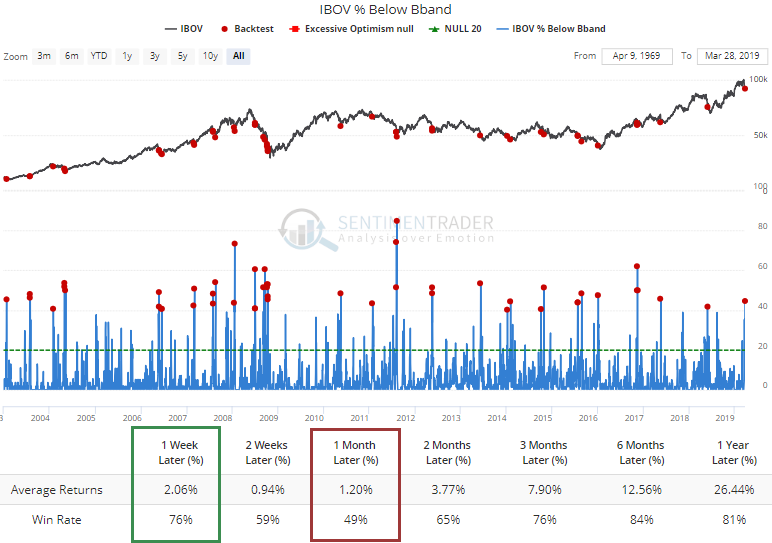
There was a spike in the number of stocks on the Brazilian Ibovespa exchange falling below their lower Bollinger Bands. This happens when stocks are trading in a relatively narrow range then suddenly drop.
Thursday Midday Color

Historically, that has led to quick rebounds but more questionable returns during the next month.

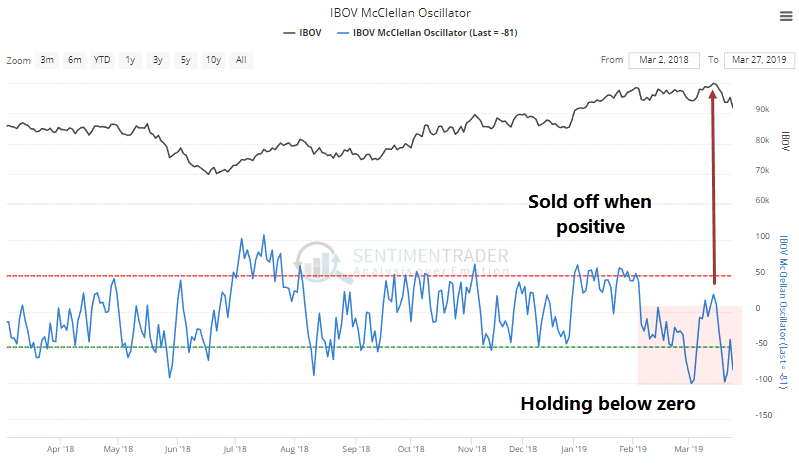
When we looked at the cracks underlying the new highs in this market last week, the main culprit was waning momentum despite rising prices. That's still evident. The McClellan Oscillator has been holding below zero, and stocks sold off as soon as it went positive. That is not what we typically see during healthy market environments.
Thursday Midday Color

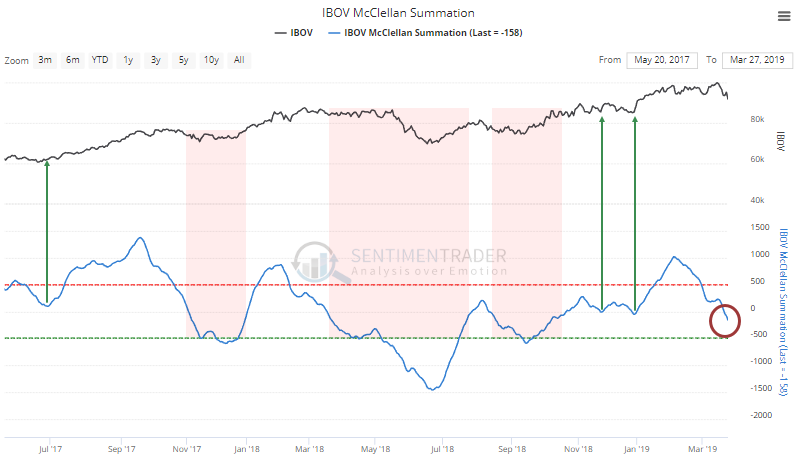
The loss of momentum is also evident in the Summation Index, which has moved below zero. The last two times it neared zero, it bounced as stocks recovered. Very generally, markets have trouble holding any gains when the Summation Index is below zero and falling.
Thursday Midday Color

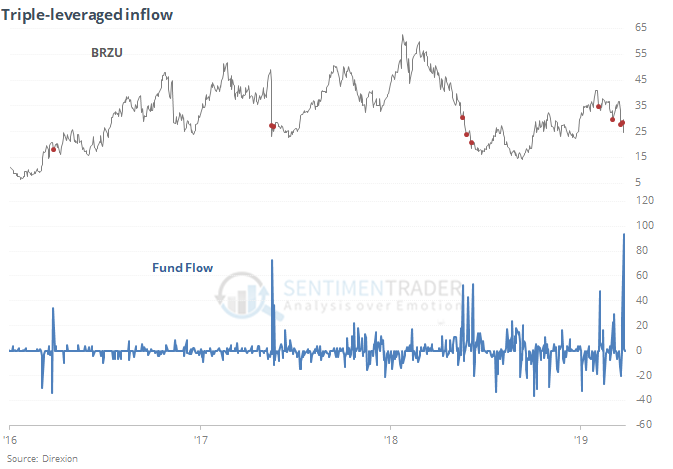
As noted by Bloomberg, the swift loss in Brazilian shares has led to a jump in assets in the triple-leveraged BRZU fund, which is supposed to give traders 300% exposure to the MSCI Brazil 25-50 index.
Thursday Midday Color

With fund flows, though, we don't know if the shares are being created to satisfy buyers or short-sellers. And based on past reactions to big inflows, it could be the latter. The fund saw some short-term rebounds after the others.

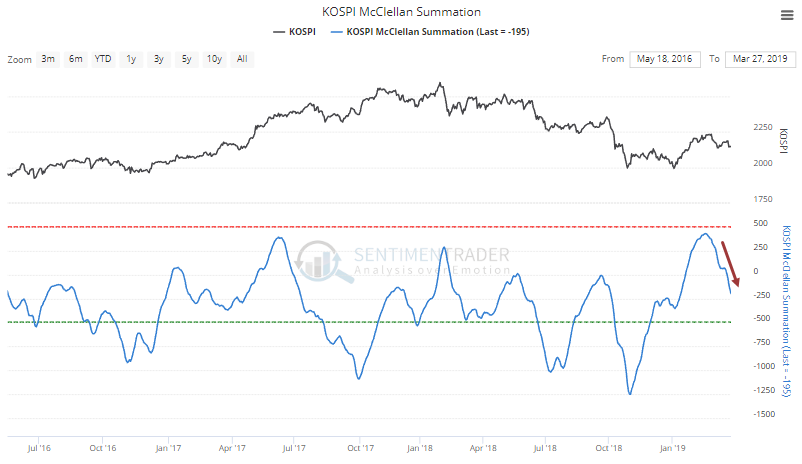
Waning momentum also a worry with the Kospi. It's a good sign that there was enough momentum to get the Summation Index close to +500 but so far it has been continuing to fall into negative territory.
Thursday Midday Color

Bond Risk

Risk in almost all assets is above-average or even extreme, limiting the number of good risk/reward opportunities out there. With the big move in bonds lately, the risk there has increased as well.

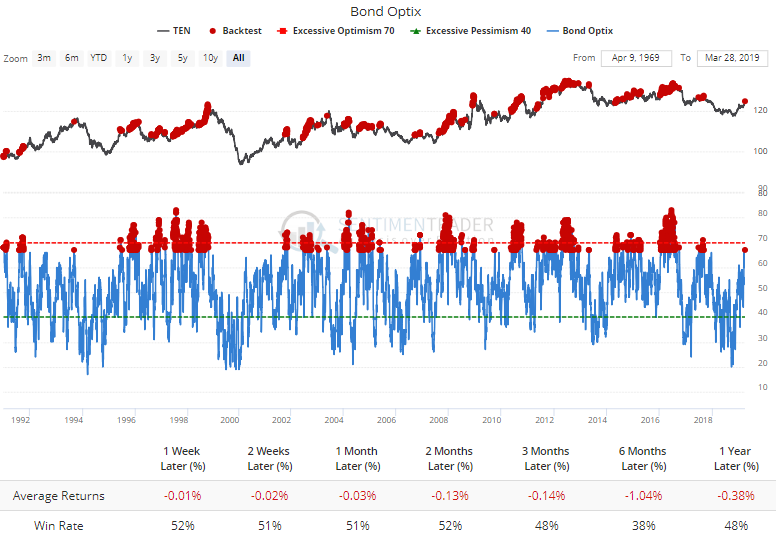
The Optimism Index for the broad bond market is up to 67. That's still a bit below the threshold of 70, but it's still one of the highest levels in two years. Historically, a reading this high has led to negative returns for 10-year Treasury futures.
Thursday Midday Color

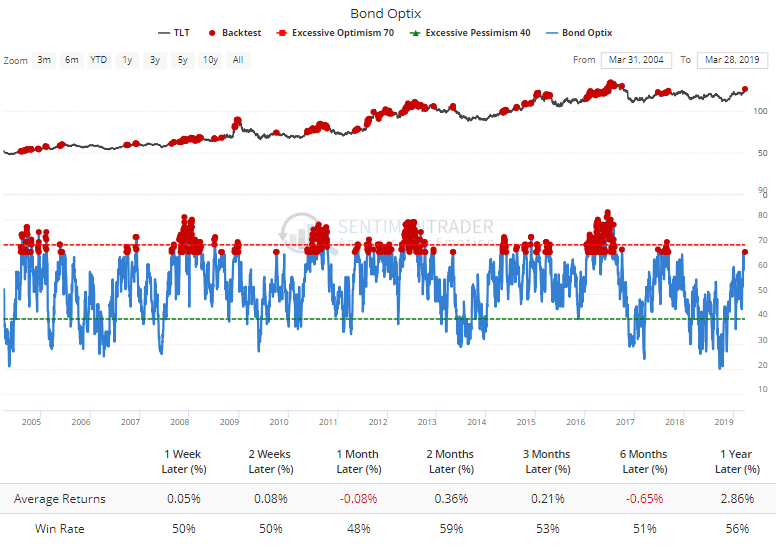
For a fund like TLT, returns have also been relatively flat at best.
Thursday Midday Color

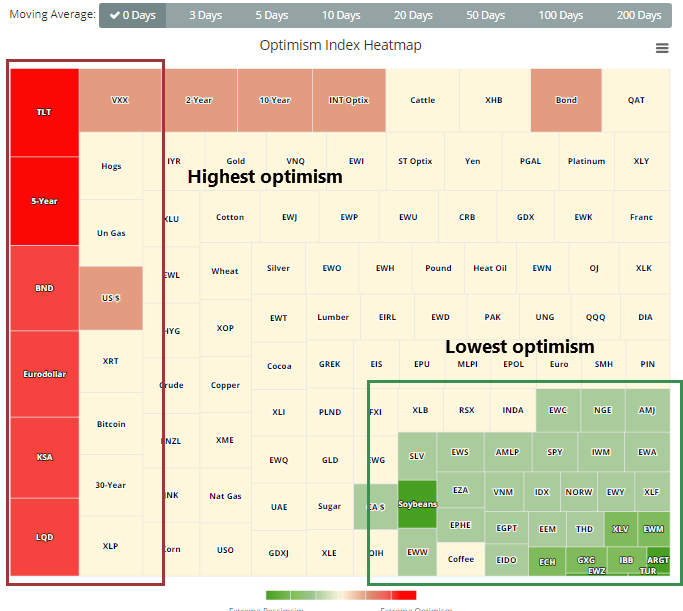
Looking at the heat map of Optimism Indexes, we can see that the highest optimism is currently in TLT.
Thursday Midday Color

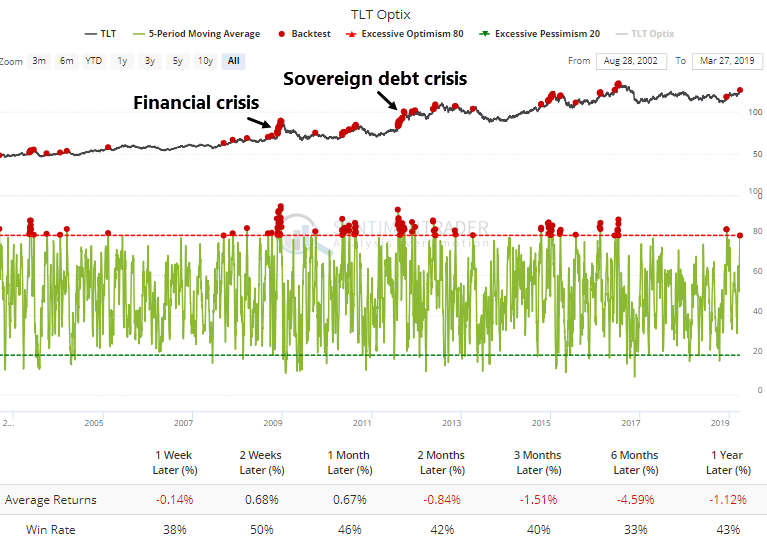
The 5-day average is now above 80, which again has led to iffy returns for the fund.
Thursday Midday Color

The two times that optimism got this high on TLT and yet it managed to sustained some gains were during two of the most tumultuous times in markets, during the 2008 financial crisis and 2011 sovereign debt crisis when the USA's creditworthiness was being questioned.

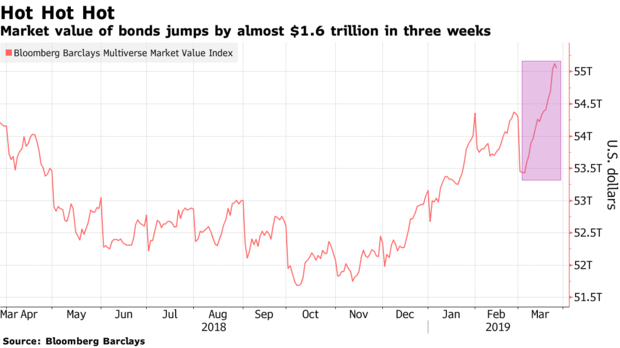
Bloomberg notes that the aggregate market value of global corporate investment-grade and high-yield bonds has jumped by an enormous amount in only the past few weeks.
Thursday Midday Color

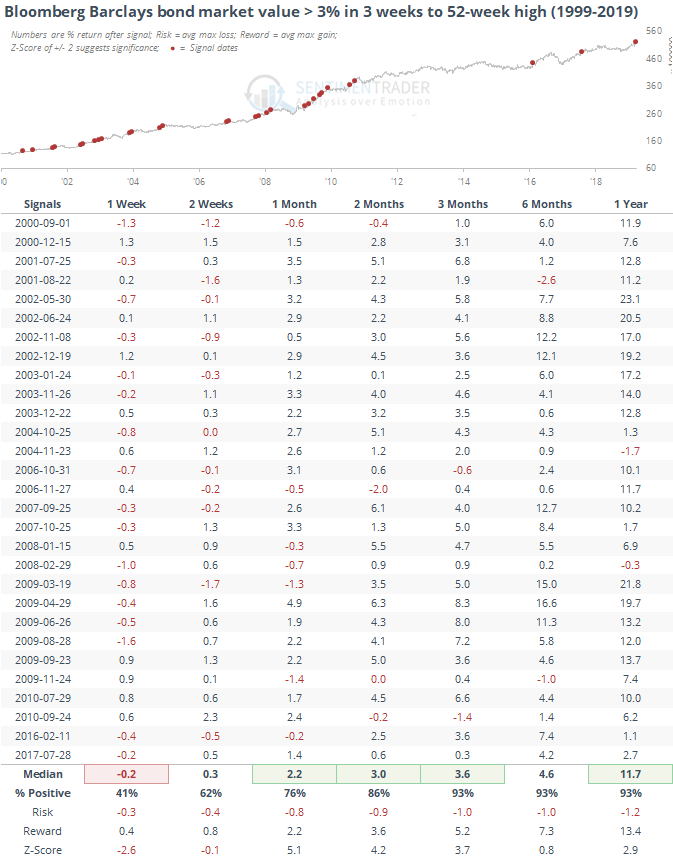
In the very short-term, that has been a bit of a worry, but longer-term, the bull market in those assets continued strongly.
Thursday Midday Color

PRODUCTS
SentimenTrader
Trading Tools
Indicators & Data API
‍
Strategies & Scanner
‍
Research Reports
FREE
RESOUrCES
Simple Backtest
Calculator
Simple Seasonality
Calculator
The Kelly Criterion
Calculator
Sentiment Geo Map
‍
Public Research Reports
‍
Education
Sentiment Indicators
‍
Technical Indicators
‍
Pricing
Bundle pricing
‍
FAQ
‍
Announcements
‍
COMPANY
‍
About
‍
In the News
‍
Testimonials
‍
Client Success Stories
CONTACT
‍
General Inquiries
‍
Media Inquiries
‍
Financial Professionals Inquiries
‍
© 2026 Sundial Capital Research Inc. All rights reserved.
Setsail Marketing
TermsPrivacyAffiliate Program
Risk Disclosure: The information and tools provided are for research and analytical purposes only and are not intended as investment advice. Market analysis involves uncertainty, and outcomes may differ from expectations. Users should conduct their own due diligence and consider their individual circumstances before making any financial decisions. Past performance is not necessarily indicative of future results.

Hypothetical Performance Disclosure: Hypothetical performance results have many inherent limitations, some of which are described below. No representation is being made that any account will or is likely to achieve profits or losses similar to those shown; in fact, there are frequently sharp differences between hypothetical performance results and the actual results subsequently achieved by any particular trading program. One of the limitations of hypothetical performance results is that they are generally prepared with the benefit of hindsight. In addition, hypothetical trading does not involve financial risk, and no hypothetical trading record can completely account for the impact of financial risk of actual trading. for example, the ability to withstand losses or to adhere to a particular trading program in spite of trading losses are material points which can also adversely affect actual trading results. There are numerous other factors related to the markets in general or to the implementation of any specific trading program which cannot be fully accounted for in the preparation of hypothetical performance results and all which can adversely affect trading results.

Testimonial Disclosure: Testimonials appearing on this website may not be representative of other clients or customers and is not a guarantee of future performance or success.