Products
SentimenTrader Trading Tools
‍
Backtest Engine
My Trading Toolkit
Correlation Analysis
Seasonality
Market Prediction
Indicators & Data API
‍
Proprietary Indicators & Charts
Market Data API
Strategies & Scanner
‍
50+ Trading Strategies
Smart Stock Scanner
Smart Option Scanner
Research Reports
‍
Research Solutions
Reports Library
Free Resources
Simple Backtest Calculator
Simple Seasonality Calculator
The Kelly Criterion Calculator
Sentiment Geo Map
Public Research Reports
Education
Sentiment Indicators
Technical Indicators
Pricing
Company
About
In the News
Testimonials
Client Success Stories
Contact
Log inLoginSign up
< BACK TO ALL REPORTS

Thursday Midday Color

Jason Goepfert
2019-03-21
null

Here's what's piquing my interest so far today.
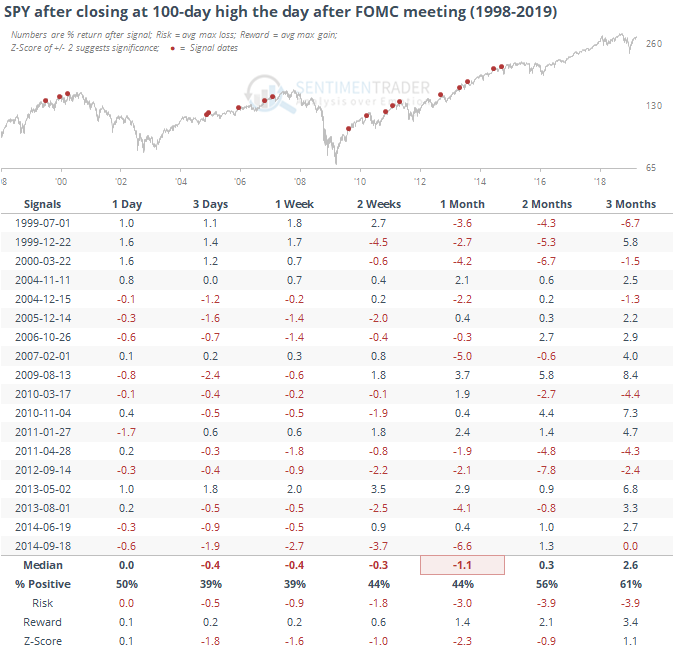
FOMC Reversal

Stocks are trying to fully reverse any weakness from earlier this week. If SPY closes at a new high for this move, it would be the first time traders pushed it to at least a 100-day high the day following a FOMC meeting since 2014. Other times that happened, SPY tended to pull back in the days ahead.
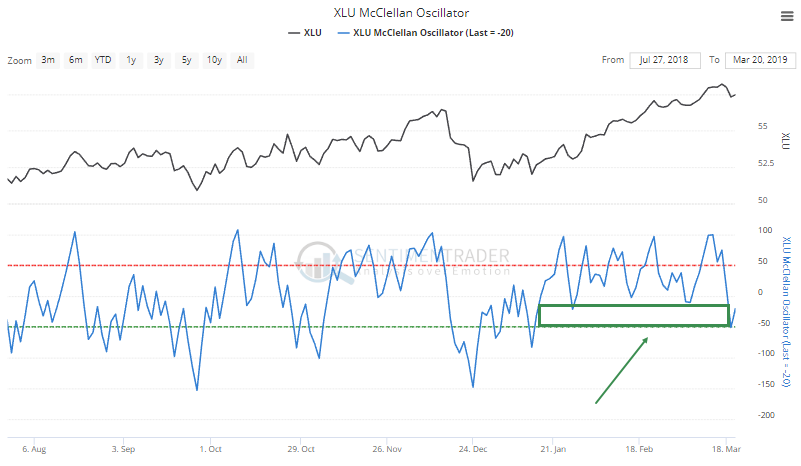
Utilities Pause

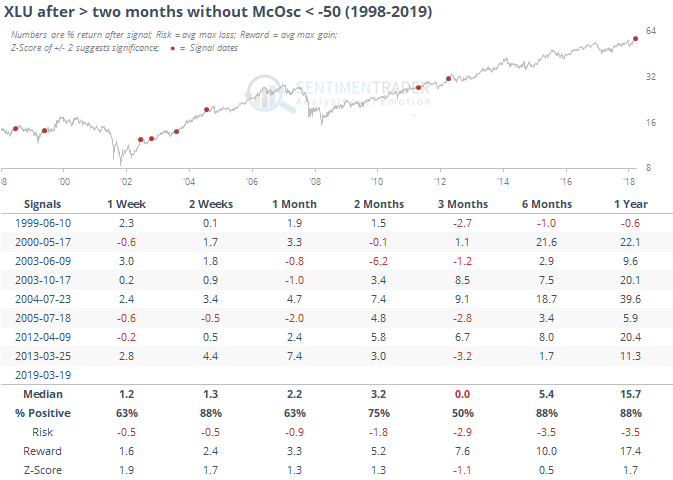
On Monday, we saw how stretched the utilities sector was, with the kinds of breadth readings normally reserved for higher-flying kinds of stocks. When such a staid sector sees those types of readings, it has almost always led to re-adjustments, which we've seen so far this week. The McClellan Oscillator for XLU just dropped below -50 for the first time in a couple of months.

That's a long stretch of positive momentum. When it ends, XLU has usually seen a short-term rebound, but they didn't often last over the next few months. Long-term, though, this kind of momentum was a good sign, like we've seen in the other studies.
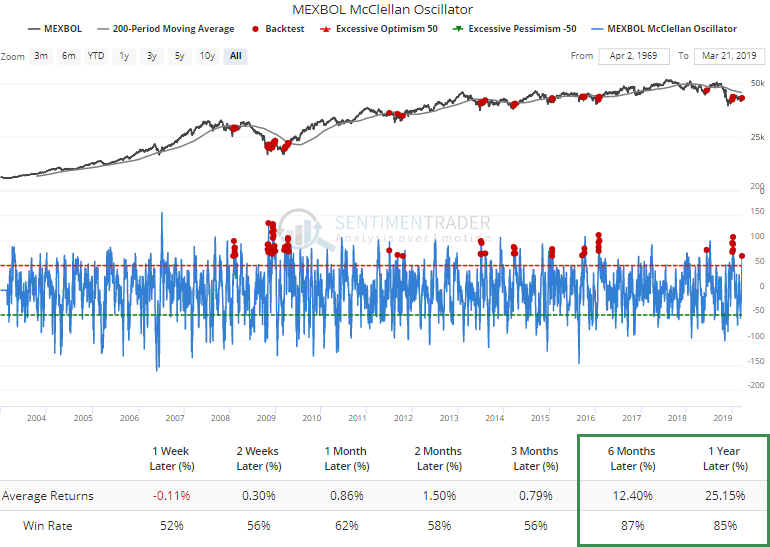
Andale

Mexican stocks have caught a bid, and the Oscillator for the Mexbol index has climbed to nearly 70. When this triggers while the index is still below its 200-day average, it has indicated fairly stretched short-term conditions.

But most of these signals indicated times when investors were first starting to get interested in that market again, and long-term, Mexbol did very well, with excellent and consistent gains over the next 6-12 months.
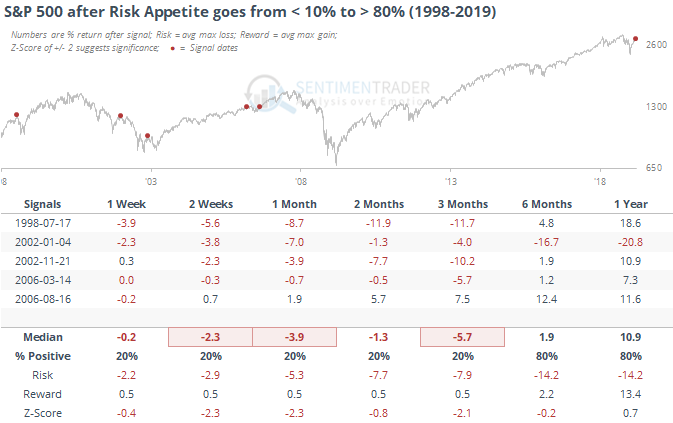
Hungry For Risk

Investors' appetite for risk has returned in a big way. The Risk Appetite Index, which looks at factors like asset volatility, sector returns, and credit spreads, has jumped to 85% from being almost the lowest it can possibly go in December.

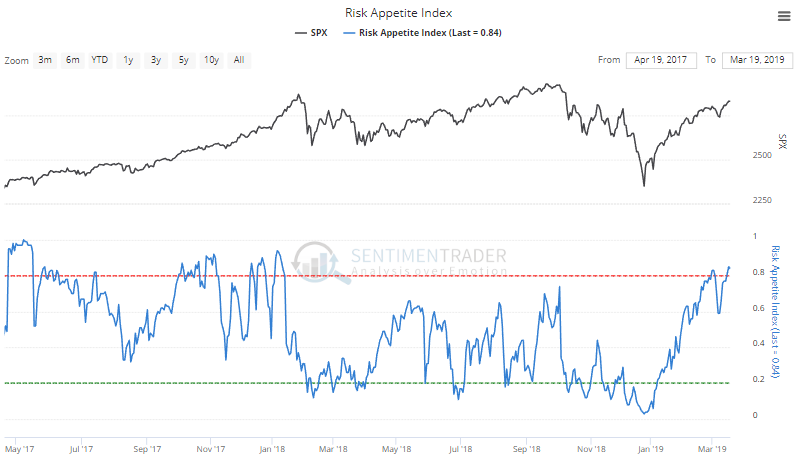
This is the quickest cycle from extreme risk aversion to extreme risk appetite since 2001. If we extended the time period for the cycle to the past six months, it still ranks as one of the few times risk has cycled so much in such a short period of time. Most of the others led to poor returns.
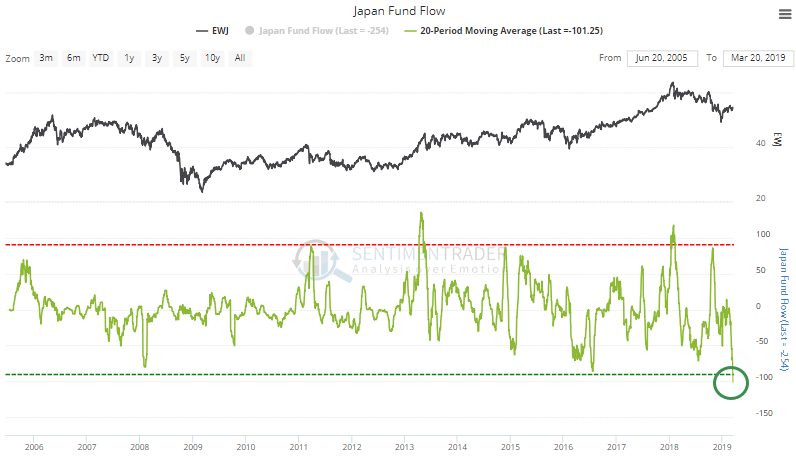
Record Outflow

ETF traders continue to flee the EWJ fund, focused on Japanese equities. It has lost an average of more than $100 million per day for the past month, a record since the fund's inception.

The shares outstanding have collapsed to the lowest level since 2013.

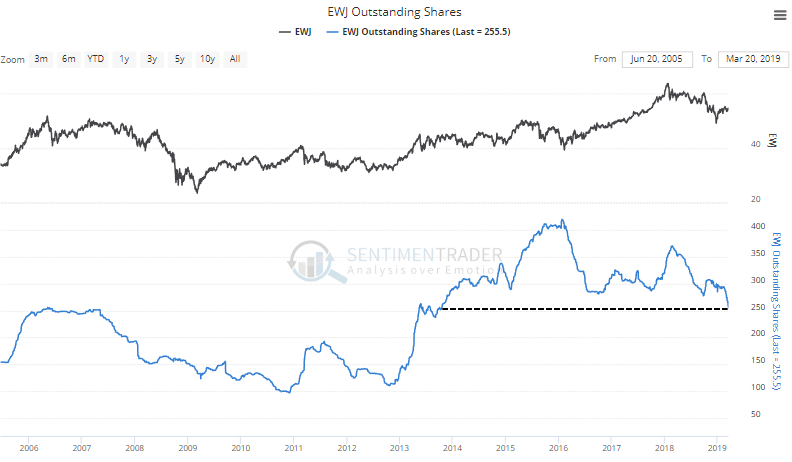
It's possible that some of this isn't related to sentiment, and is just an asset shift to other Japanese-focused funds, like DJX. But those aren't taking in that much money, and EWJ is still by far the largest of the funds with more than 4 times the assets of the next-largest one.

PRODUCTS
SentimenTrader
Trading Tools
Indicators & Data API
‍
Strategies & Scanner
‍
Research Reports
FREE
RESOUrCES
Simple Backtest
Calculator
Simple Seasonality
Calculator
The Kelly Criterion
Calculator
Sentiment Geo Map
‍
Public Research Reports
‍
Education
Sentiment Indicators
‍
Technical Indicators
‍
Pricing
Bundle pricing
‍
FAQ
‍
Announcements
‍
COMPANY
‍
About
‍
In the News
‍
Testimonials
‍
Client Success Stories
CONTACT
‍
General Inquiries
‍
Media Inquiries
‍
Financial Professionals Inquiries
‍
© 2026 Sundial Capital Research Inc. All rights reserved.
Setsail Marketing
TermsPrivacyAffiliate Program
Risk Disclosure: The information and tools provided are for research and analytical purposes only and are not intended as investment advice. Market analysis involves uncertainty, and outcomes may differ from expectations. Users should conduct their own due diligence and consider their individual circumstances before making any financial decisions. Past performance is not necessarily indicative of future results.

Hypothetical Performance Disclosure: Hypothetical performance results have many inherent limitations, some of which are described below. No representation is being made that any account will or is likely to achieve profits or losses similar to those shown; in fact, there are frequently sharp differences between hypothetical performance results and the actual results subsequently achieved by any particular trading program. One of the limitations of hypothetical performance results is that they are generally prepared with the benefit of hindsight. In addition, hypothetical trading does not involve financial risk, and no hypothetical trading record can completely account for the impact of financial risk of actual trading. for example, the ability to withstand losses or to adhere to a particular trading program in spite of trading losses are material points which can also adversely affect actual trading results. There are numerous other factors related to the markets in general or to the implementation of any specific trading program which cannot be fully accounted for in the preparation of hypothetical performance results and all which can adversely affect trading results.

Testimonial Disclosure: Testimonials appearing on this website may not be representative of other clients or customers and is not a guarantee of future performance or success.