Thursday Midday Color

Here's what's piquing my interest so far today.
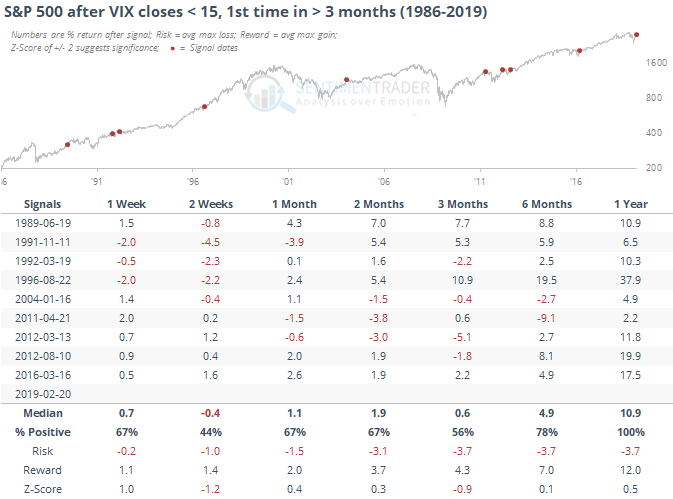
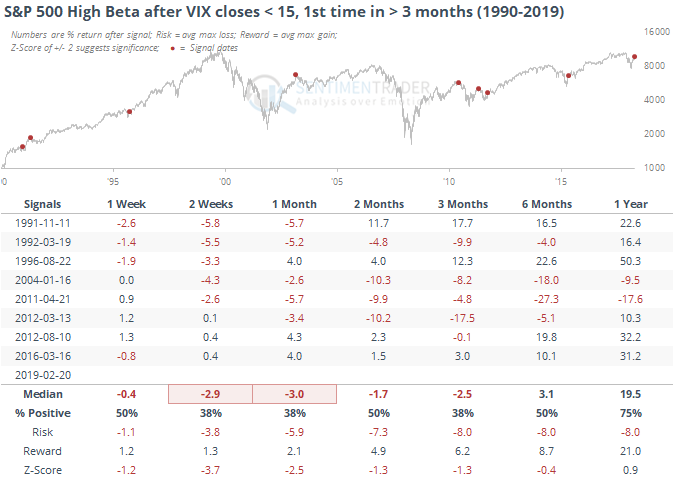
The VIX closed under 15 for the first time in months on Wednesday. That has rarely led to further losses over the next several weeks.
Ignore the latest date on the tables, it should read “2019-02-15”.
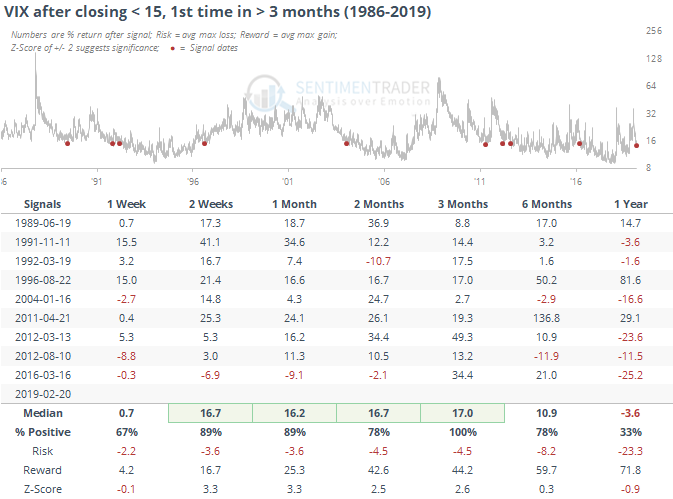
The rising volatility didn’t necessarily translate to declining stocks.
As always, it pays to be cautious about seeing returns like this and assuming it will translate to gains in any of the VIX-related ETFs. Because of how they’re structured, they’re not good vehicles to bet on rising volatility except for extremely short-term trades.
Every volatility or “bear market” ETF I checked showed mostly losses after these signals, though the history is limited to the last 8 years or so.
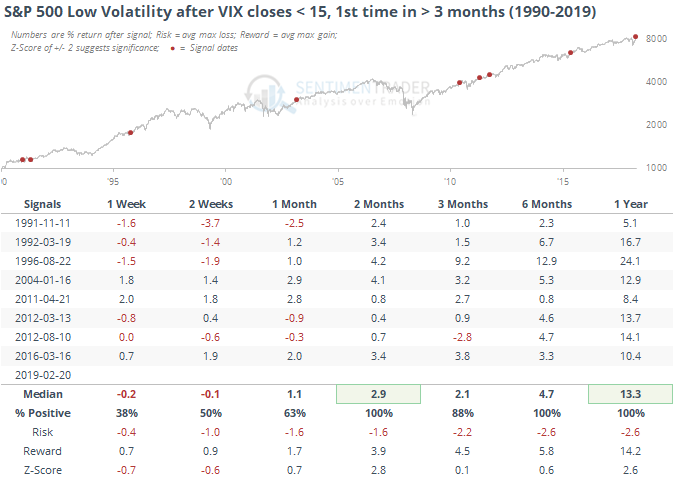
One aspect that was more fruitful was looking at low-volatility indexes as opposed to bear market or volatility ETFs. Funds like SPLV that track the lowest volatility stocks did well after the VIX first dipped below 15.
That contrasts with high beta stocks, which suffered much worse.
It stands to reason, then, that the ratio of low volatility to high beta stocks should mostly rise, which it did.
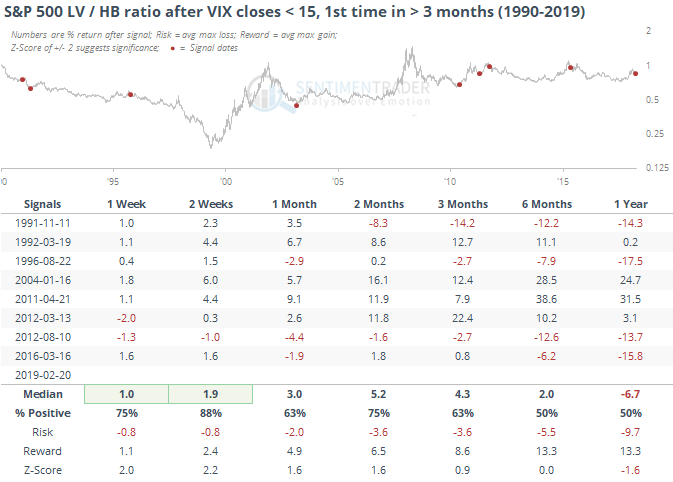
While there have been funds pouring into these low volatility funds in recent weeks, and they’re trading at new highs, these VIX signals suggest they should be able to hold up much better than the higher volatility spectrum of stocks in the weeks and months ahead.
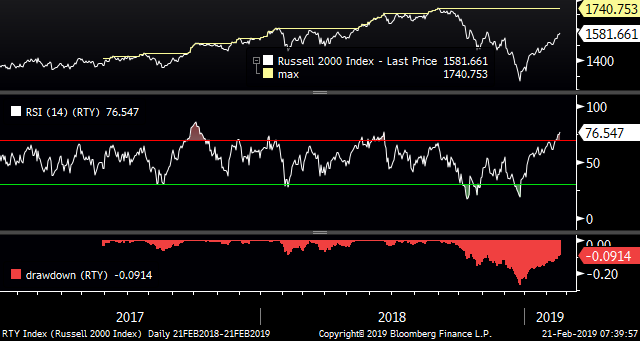
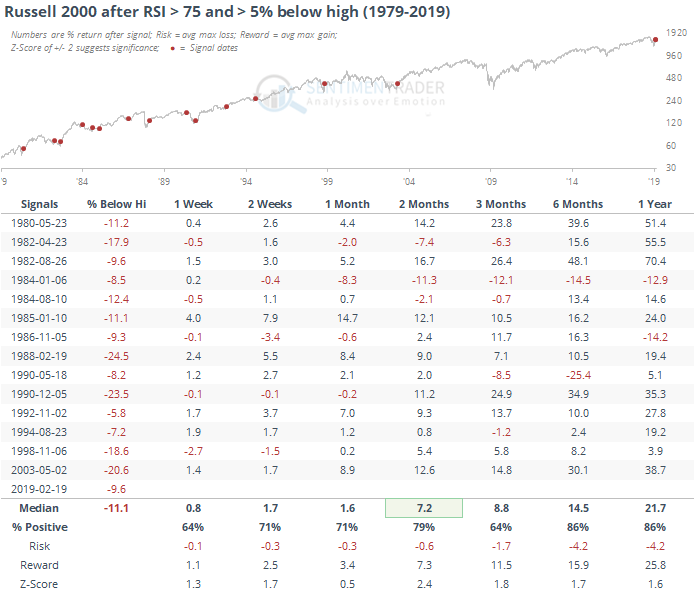
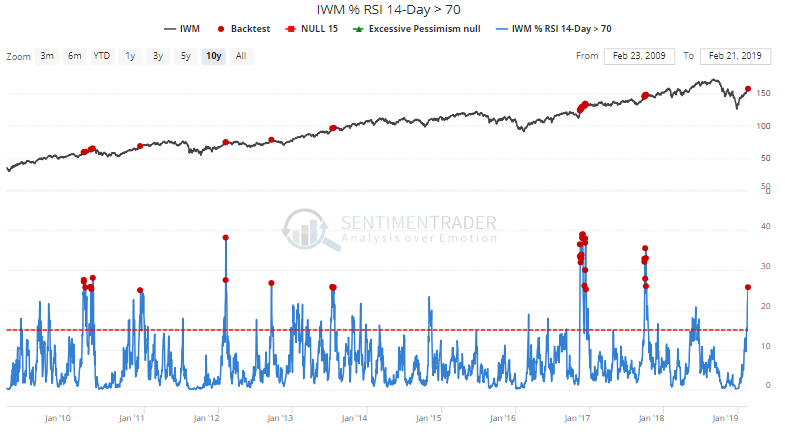
Yesterday we saw the remarkable and persistent buying thrust the small-cap Russell 2000 has enjoyed. That has triggered an RSI above 75 for the first time in months, even though the index is still nearly 10% below its 52-week high.
That has led to decent returns for the Russell, especially over the next couple of months.
More than a quarter of stocks in the CAC 40 of french stocks are in overbought territory with an RSI above 70. When the index was trading below its 200-day average, as it is now, there have only been two other signals in the past 15 years, in 2009 and 2012.
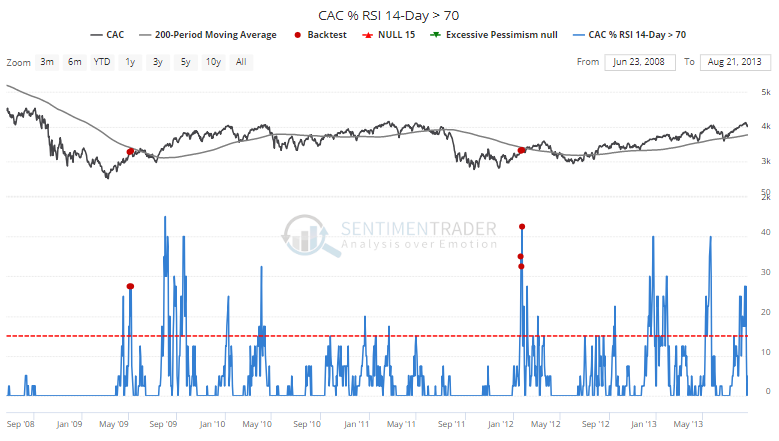
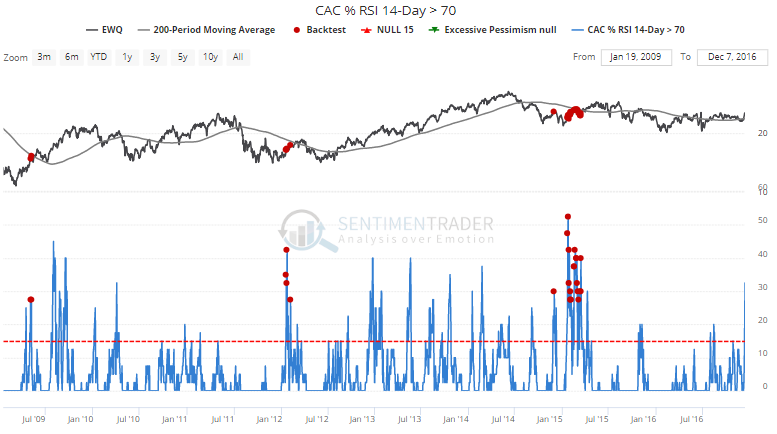
Using the EWQ fund, there were some days in 2015 that triggered as well.
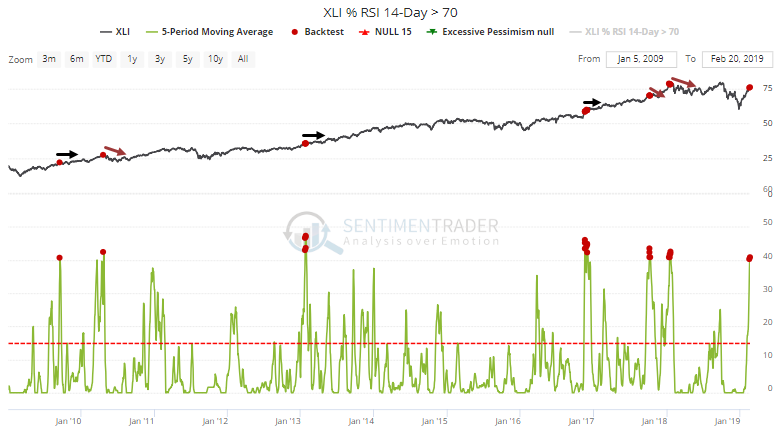
Over the past week, an average of 40% of Industrials stocks have traded in overbought territory. That's one of the most since the financial crisis. Future returns were not bad, but risk/reward over the next month was iffy.
More than a quarter of small-cap stocks are overbought.
Same for the S&P 500, and it's been a bit of a struggle afterward.
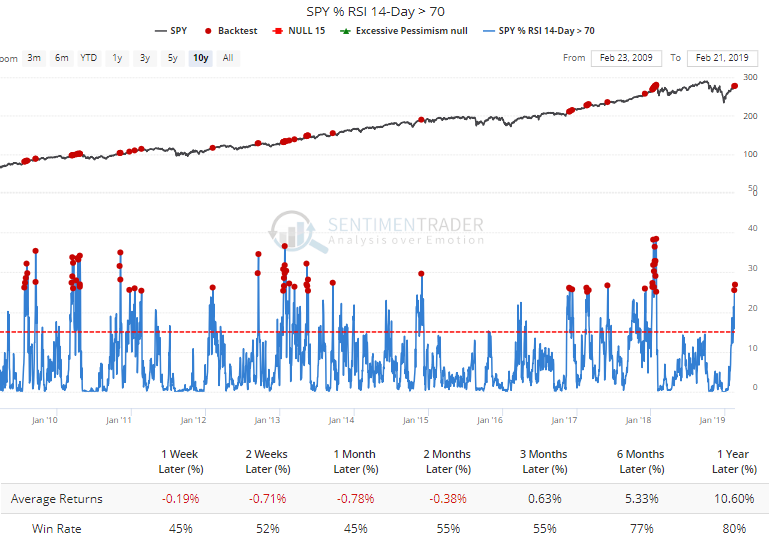
More than 30% of them within the S&P 1500 index are stretched.
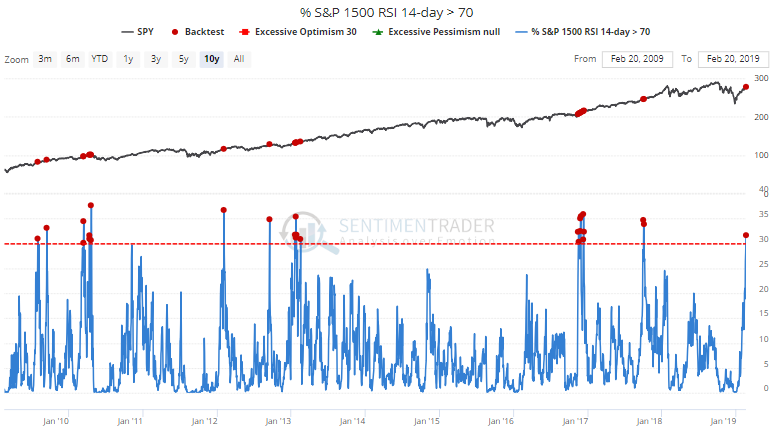
Again, future returns were fine on most time frames except the very short-term, but upside tended to be limited as the rallies plateaued and buyers rested. Except for 2017, which was just a beast.
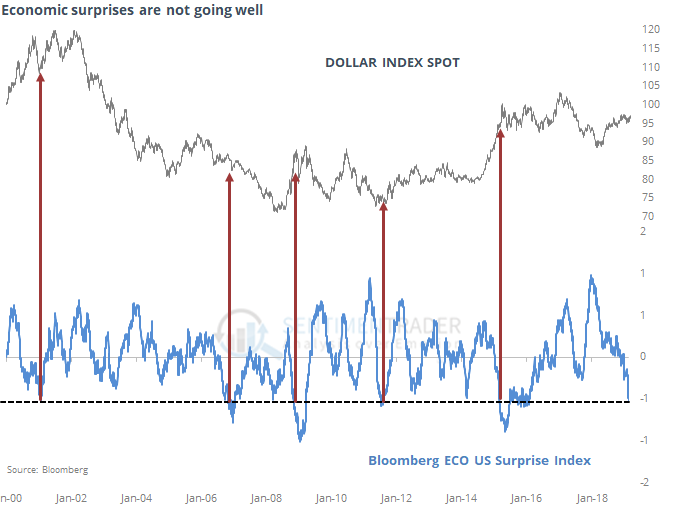
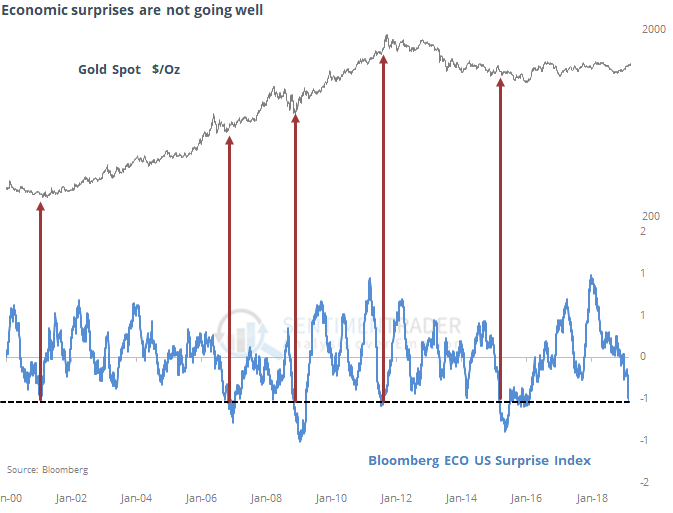
Economic releases today have had a negative impact on the Bloomberg Economic Surprise Index. Not a great sign for stocks.
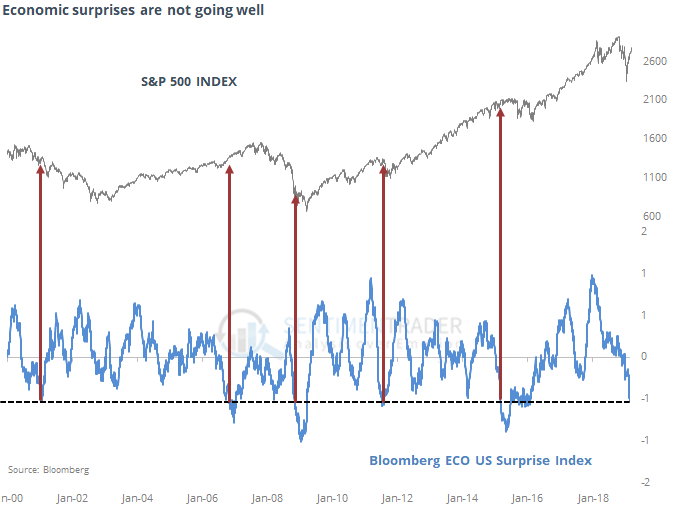
It's been a pretty good sign for 10-year Treasury yields, though. Which is curious - one would think it would precede declining yields, but traders are forward-looking, not backward-looking like the economic surprise index.
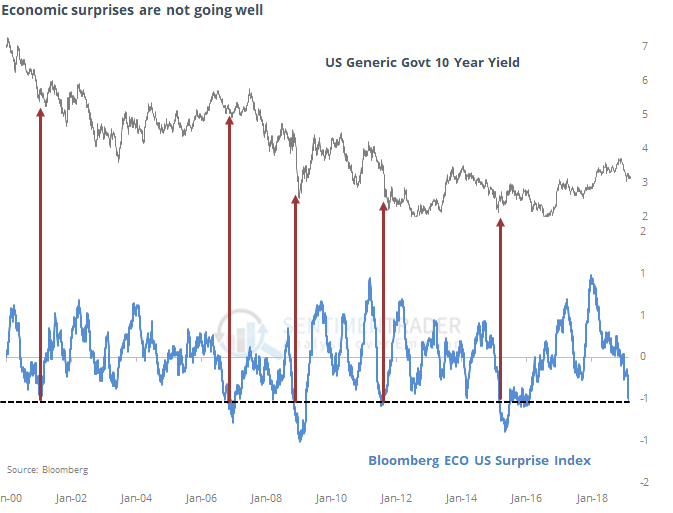
It preceded mixed returns for the U.S. dollar.
It was a better sign for gold, though most of them triggered during the bull run leading up to the 2011 peak.
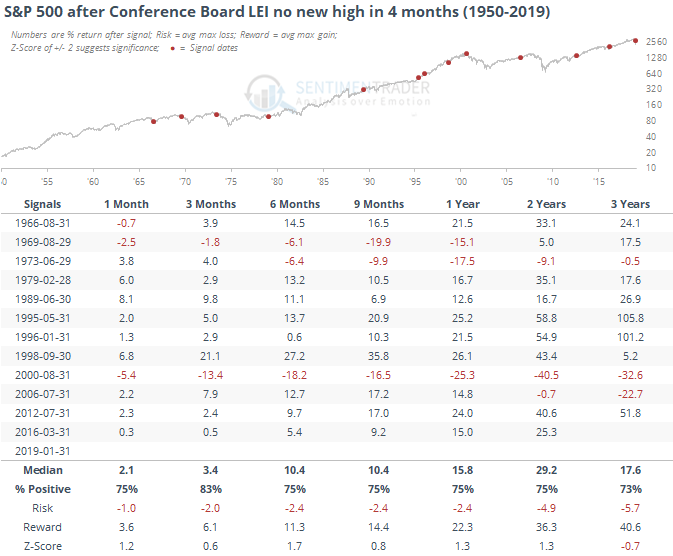
Among the economic reports released today that are causing some consternation, the Conference Board's Leading Economic Index declined slightly yet again.
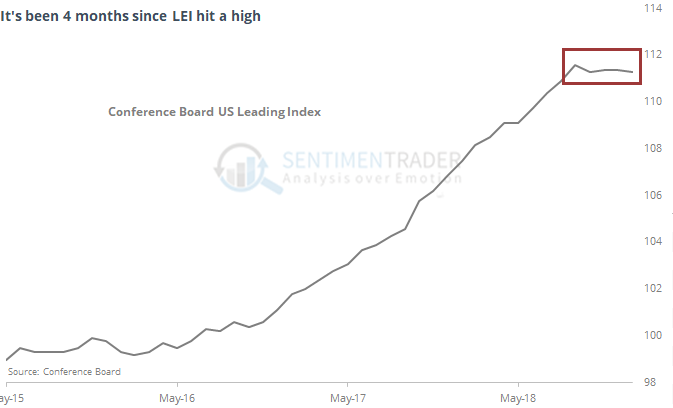
It's now been 4 months since the LEI reached a multi-year high, but that hasn't been enough to suggest a peak in stocks.