
Three Sectors Where Traders Should Look for Opportunity

Key points
- The stock market has advanced sharply in recent months, so a pullback remains a distinct possibility
- That said, several sectors are entering periods of historically significant and persistent fourth-quarter strength
- Traders should be looking for opportunities to play the long side in technology, industrials, and regional banks
Mid-October has historically been a launch pad for certain sectors
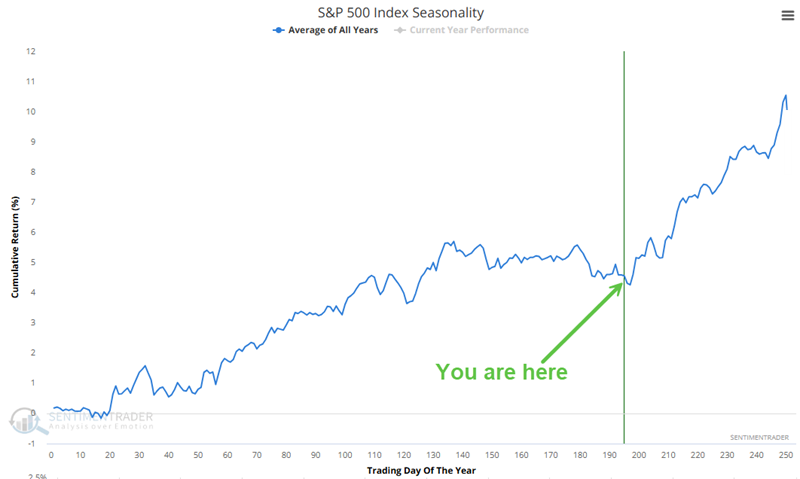
The stock market has been on a tear since bottoming in early April. The recent Fed rate cut has added fuel to the bullish fire, and we are now heading into what is generally considered the weakest seasonal period of the year. The charts below show the Annual Seasonal Trends historically for the S&P 500 index. A favorable period extends from the close on Trading Day of the Year (TDY) #197 through the end of the year. For 2025, this period runs from the close on October 15th through December 31st.
The chart below displays the hypothetical growth of $1 invested in the S&P 500 only during this period for the past 40 years.
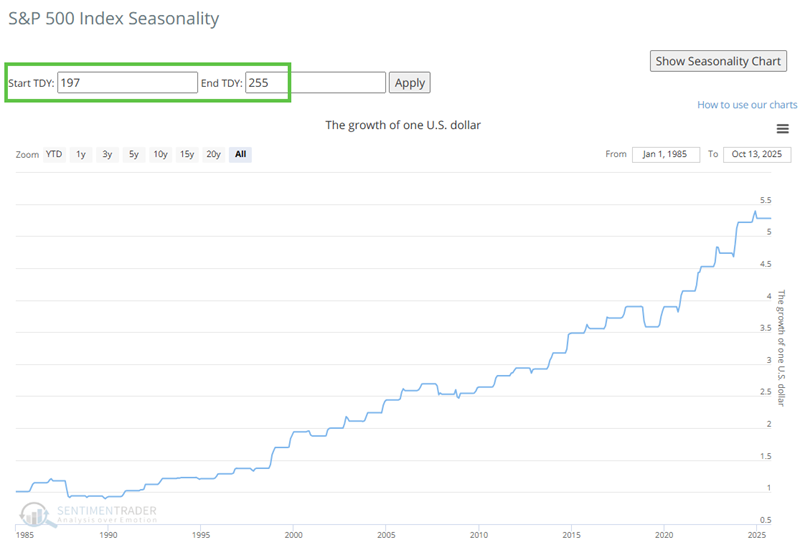
Despite the historical tendency for strength during this period, it is always important to remember that seasonality is a secondary indicator, and performance can vary widely from year to year. Given that the S&P 500 has already advanced 34% from its April low, the potential for a subpar "year-end" rally should not be ignored. Still, certain sectors have shown notable strength from mid-October through the end-of-year period.
Sector #1: Technology
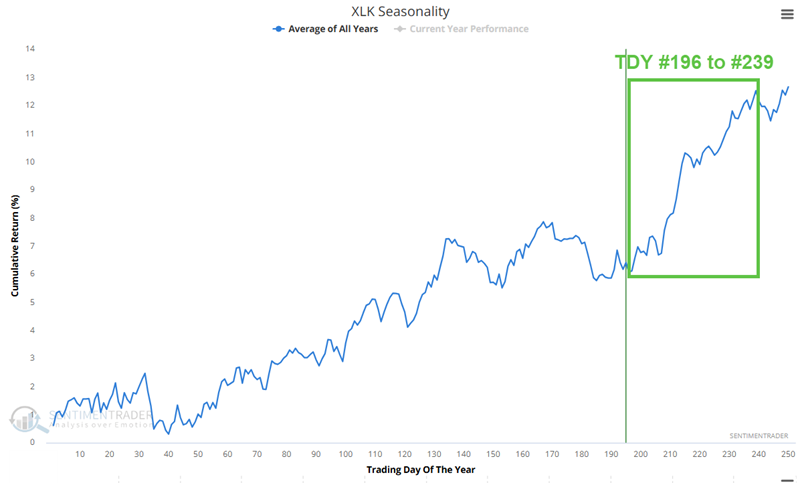
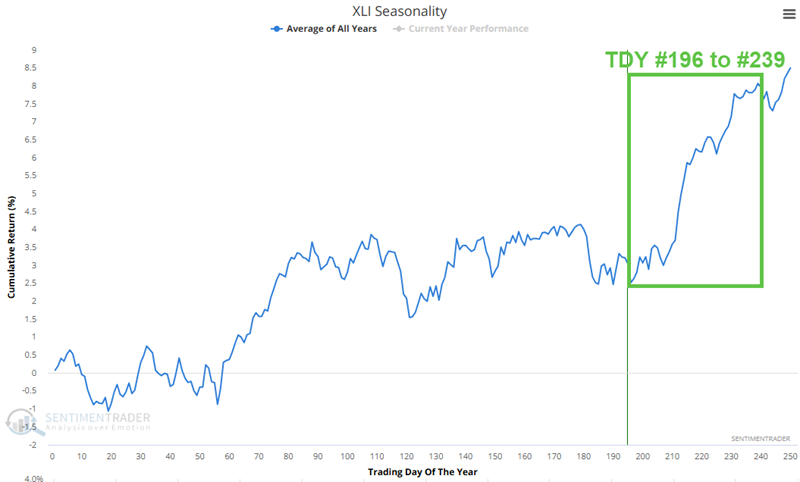
The Annual Seasonal Trend chart for the Technology Select Sector SPDR Fund (XLK) is entering a favorable period that extends from Trading Day of the Year (TDY) #196 through TDY #239. For 2025, this period extends from October 14th through December 15th.
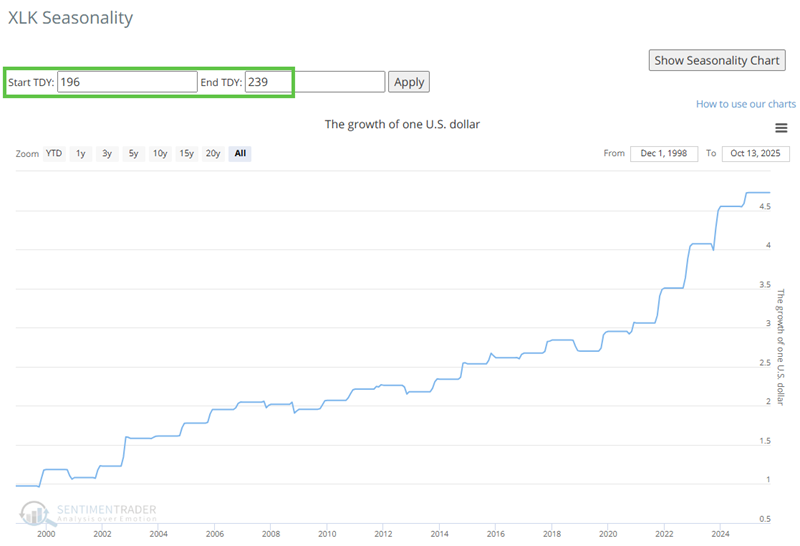
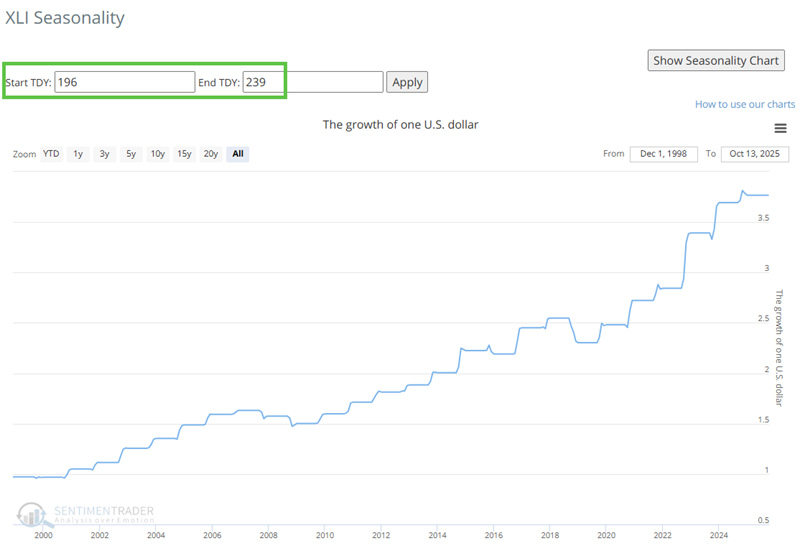
The chart below displays the hypothetical growth of $1 invested in XLK during this period since 1999. A hypothetical $ invested in XLK during this period, every year since 1999, has gained 373%.
The table below summarizes XLK performance during this period since 1999.
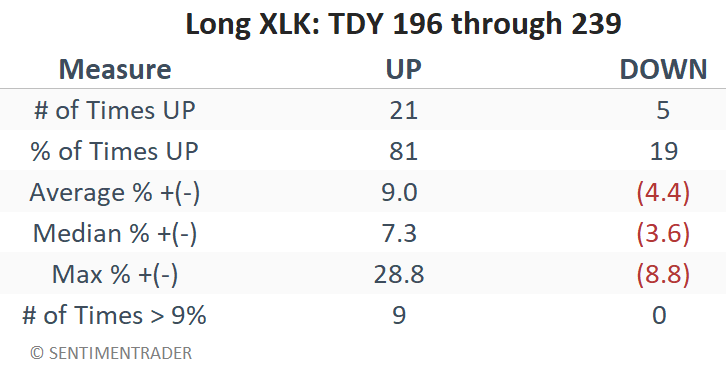
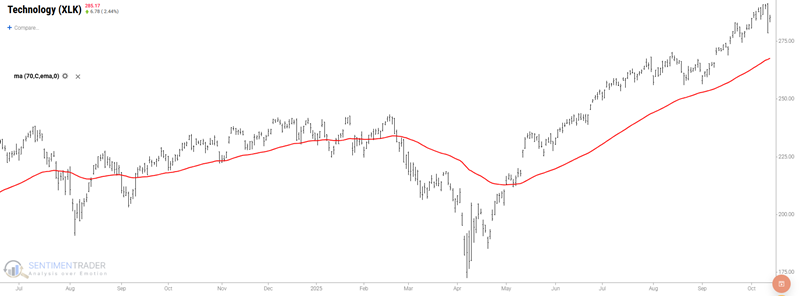
Technology has already been on a significant run. The primary question for tech traders is whether to jump in and hope for continued strength or wait for a pullback before jumping in.
Sector #2: Industrials
The Annual Seasonal Trend chart for the Industrial Select Sector SPDR Fund (XLI) enjoys the same seasonally favorable period as technology. For 2025, this period extends from October 14th through December 15th.
The chart below displays the hypothetical growth of $1 invested in XLI during this period since 1999. A hypothetical $ invested in XLI during this period, every year since 1999, has gained 288%.
The table below summarizes XLI's performance during this period since 1999.
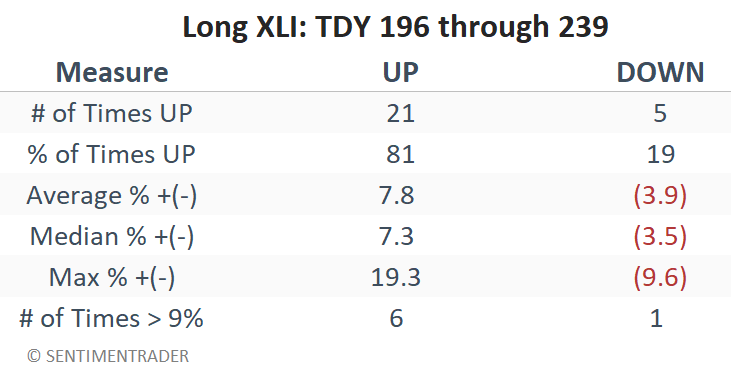
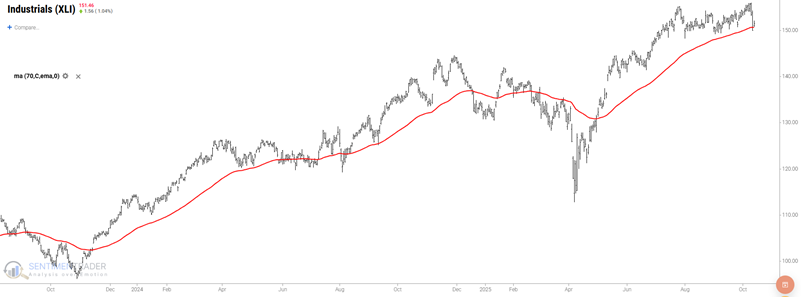
Industrials rallied significantly off the April 2025 low but have stalled recently. Traders should watch price closely relative to the 70-day EMA to see if it holds. As long as it does, price and seasonality will be in agreement.
Sector #3: Regional Banks
The Regional Banks sector has been underperforming in 2025 and is presently trading below its 70-day exponential moving average.
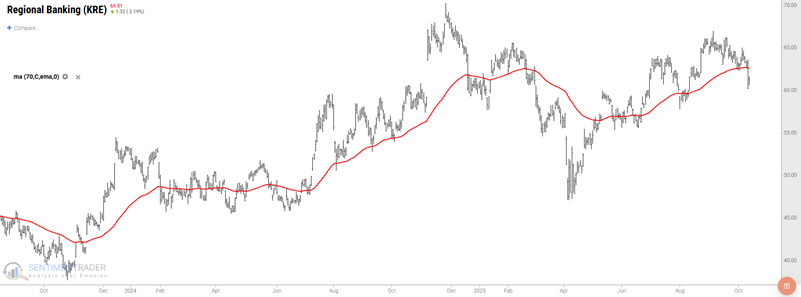
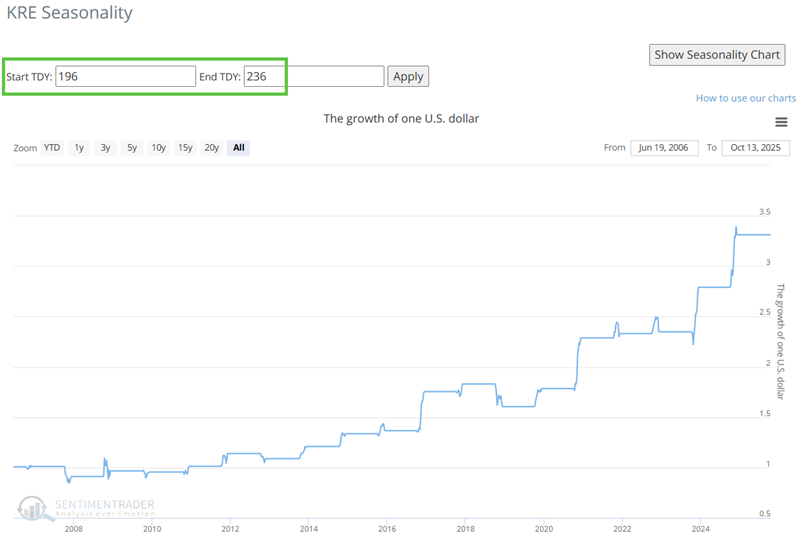
If this sector is going to bounce, it should start to happen soon. The Annual Seasonal Trend chart for the SPDR S&P Regional Banking ETF (KRE) is entering a favorable period that extends from Trading Day of the Year (TDY) #196 through TDY #236. For 2025, this period extends from October 14th through December 10th.
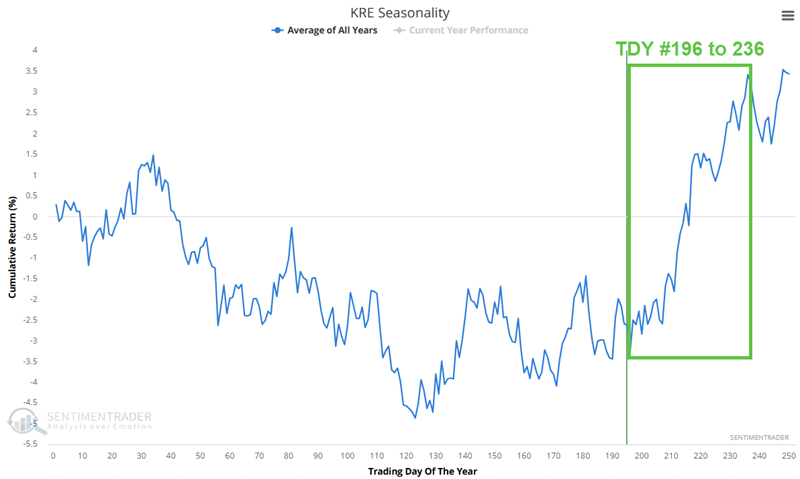
The chart below displays the hypothetical growth of $1 invested in XLI during this period since 2006. A hypothetical $1 invested in KRE during this period, every year since 2006, has gained 232%.
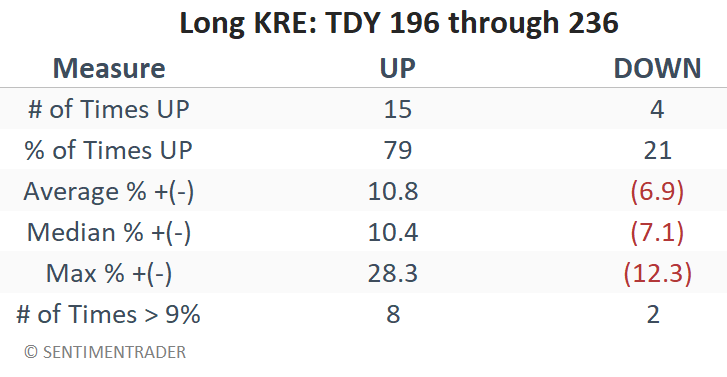
The table below summarizes KRE performance during this period since 2006.
What the research tells us…
Will technology continue to soar? Will industrials get back in gear after trading sideways for the past three months? And will regional banks bounce back from their notable underperformance in 2025? Unfortunately, we do not have a crystal ball and cannot predict the future. That said, we can review history and note that all three sectors have a robust history of showing strength during the fourth quarter. Traders looking for an "edge" should look closely for opportunities to play the long side of these sectors as 2025 moves through its final quarter.