
Three of the Big Four stage a comeback

Key points:
- Of the "Big Four" U.S. equity indices, three have stormed back from moderately large drawdowns
- When these three have recovered to within 5% of their highs after a drawdown, it was a good sign for future returns
- The Nasdaq Composite, in particular, enjoyed excellent returns for months afterward
Three for four ain't bad
Three of the "Big Four" have come storming back.
The most-followed three U.S. equity indices have recovered to within 5% of their multi-year highs. This is a notable recovery from at least a -15% drawdown for the S&P 500, Dow Industrials, and Nasdaq Composite. Only the small-cap Russell 2000, with less historical data to test, is lagging.
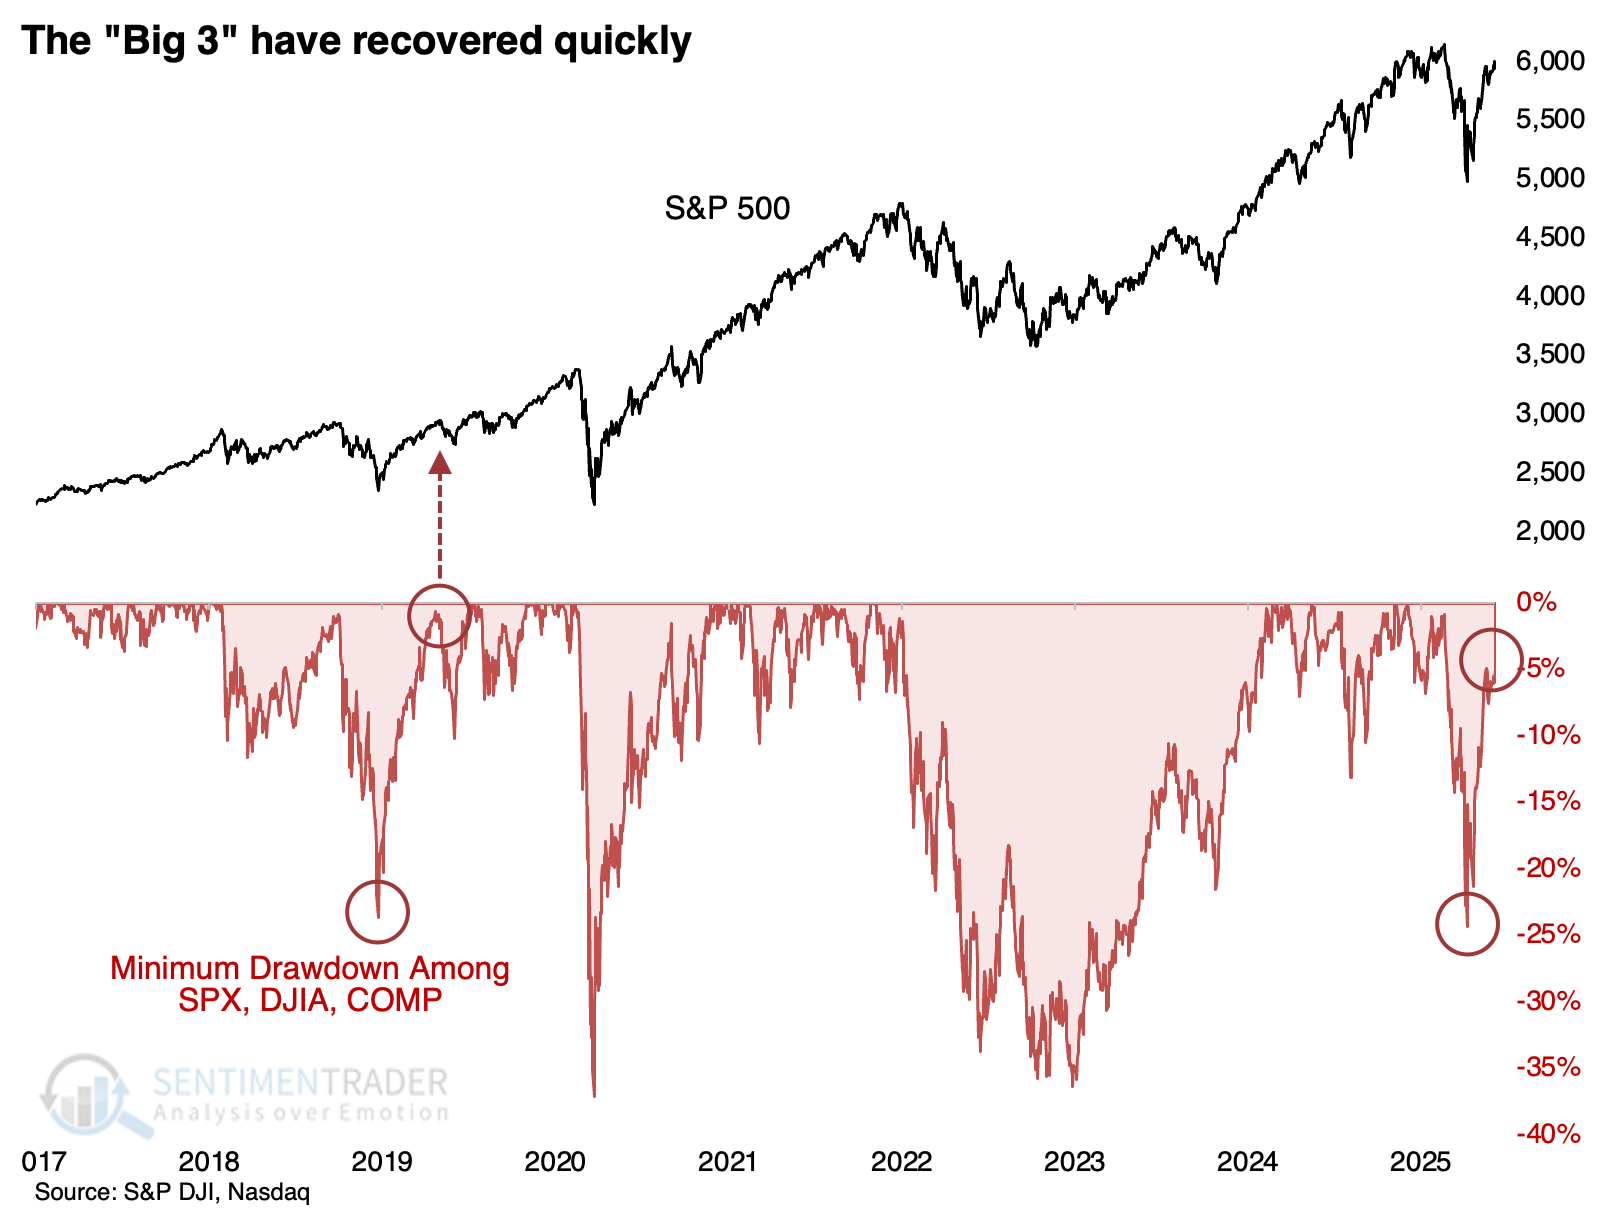
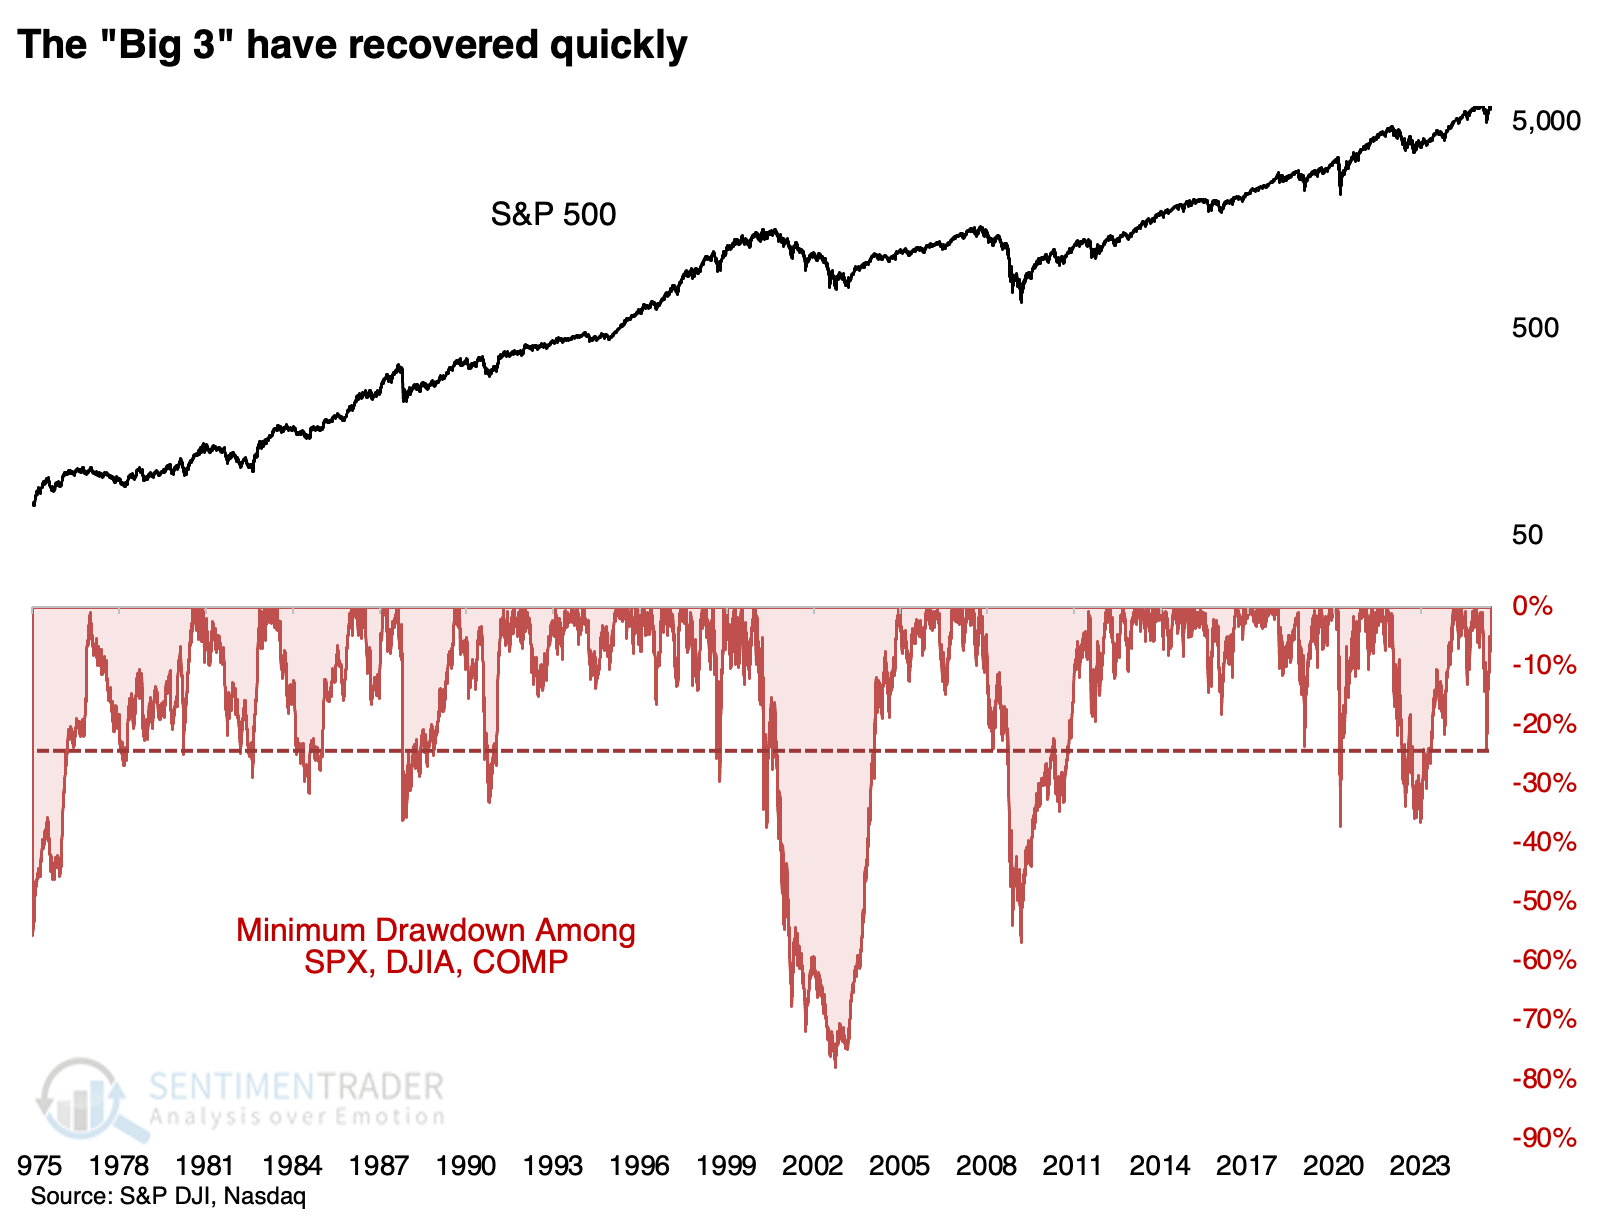
Since the Nasdaq's inception in 1971, this recovery ranks among the quickest and most substantial from a drawdown of at least -15% across all three indices.
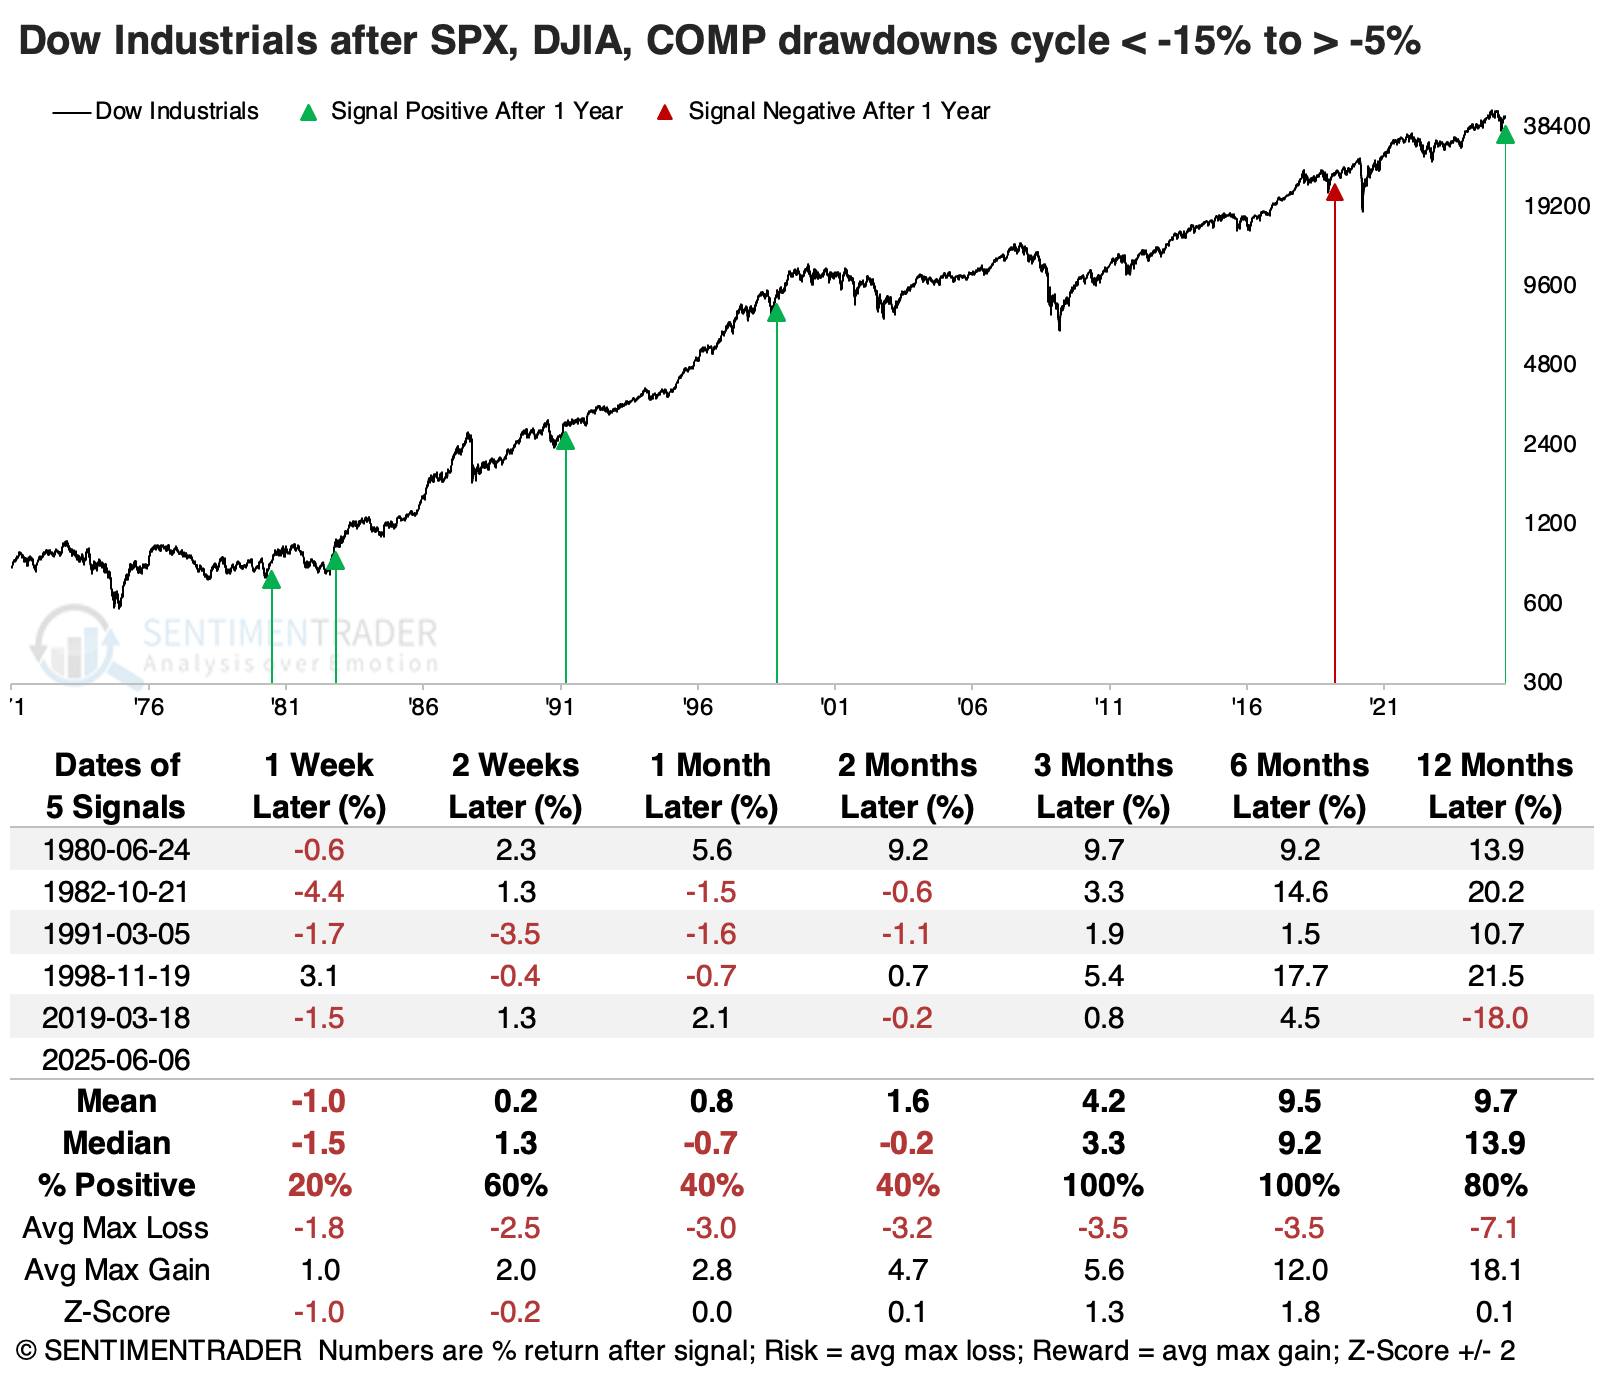
The tables below show how each of them performed after all three recovered to within 5% of a 3-year high after all were at least 15% below within the past 50 sessions. On average, the current drawdown was less than -4% between the three.
Not many times have we witnessed such a quick recovery across all three indices. However, they were good for the S&P 500 from the available history. It continued to power higher each time over the following three to six months, though it eventually succumbed to the pandemic panic in 2020.
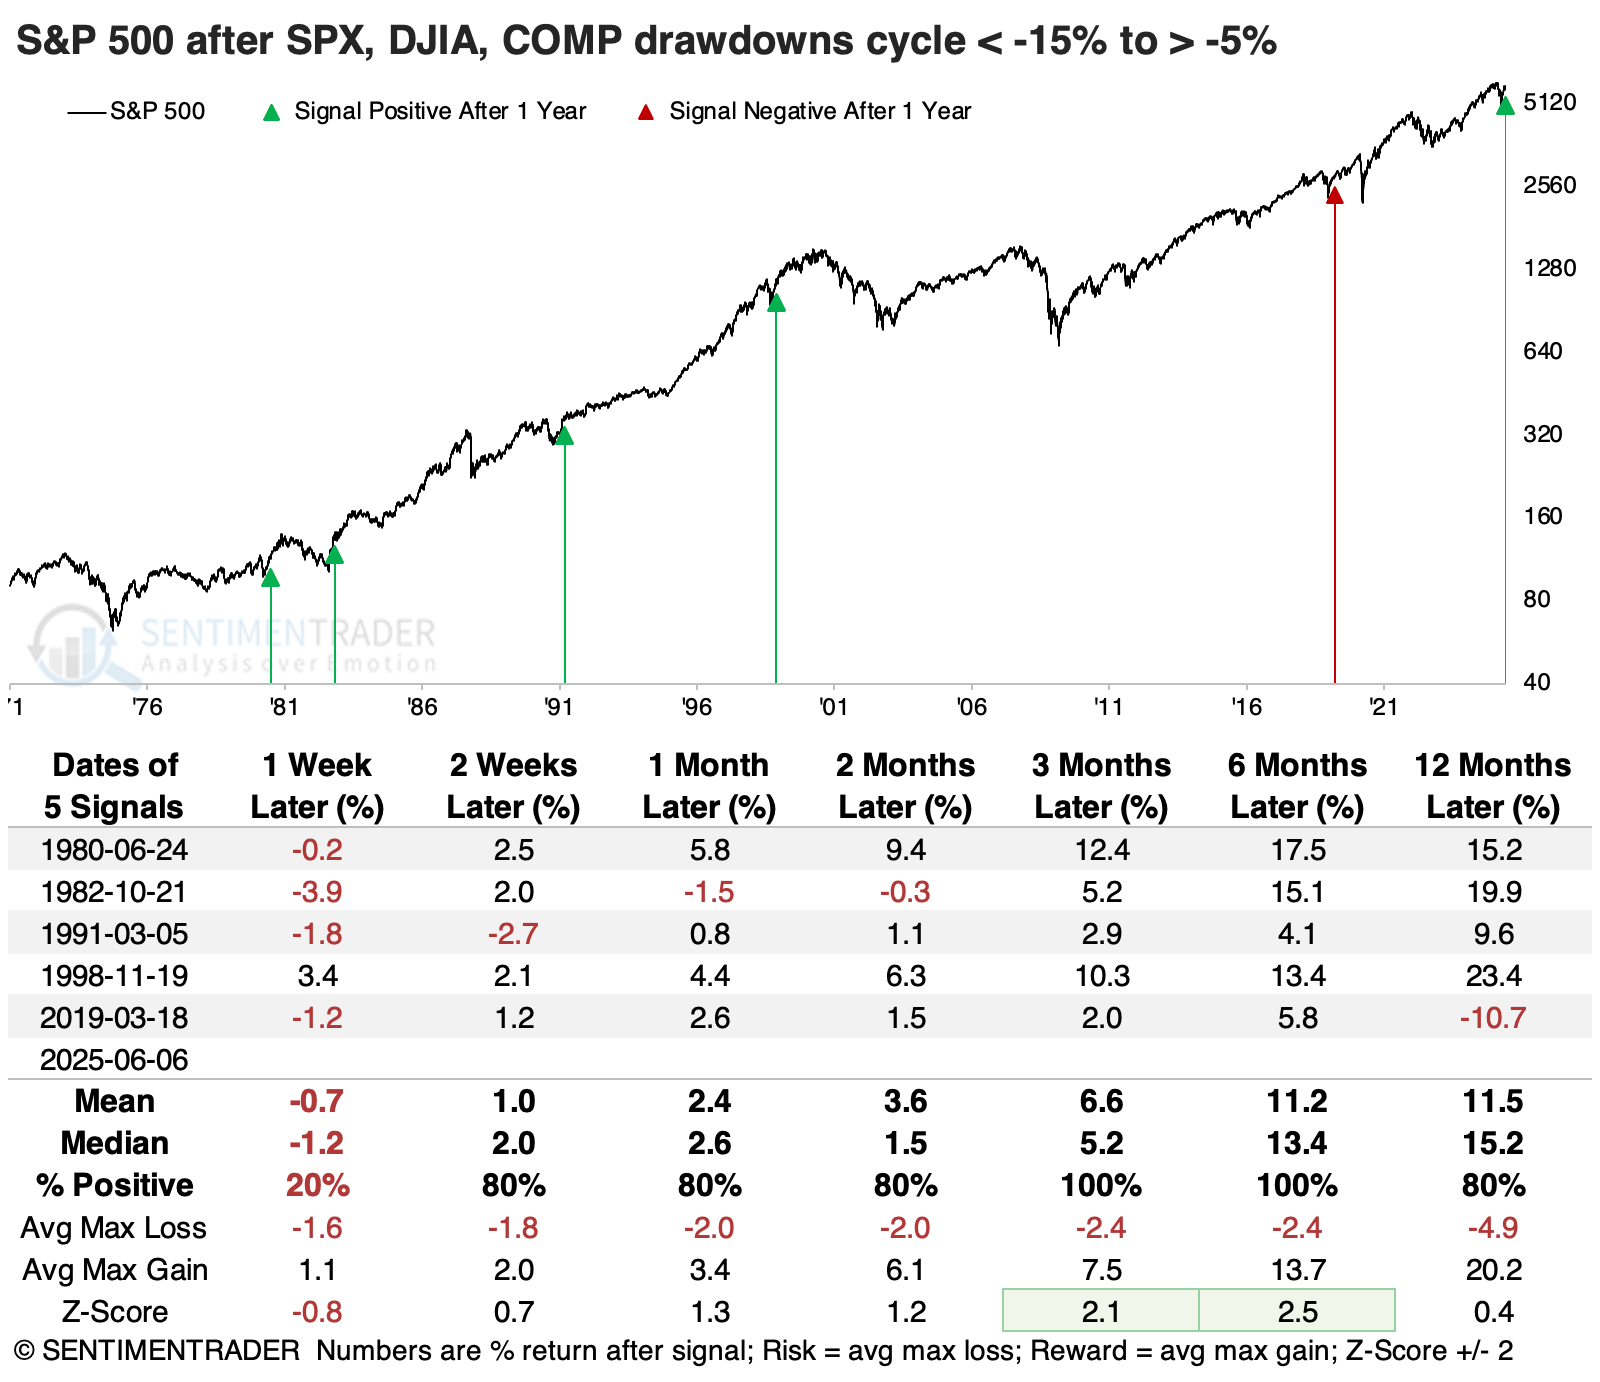
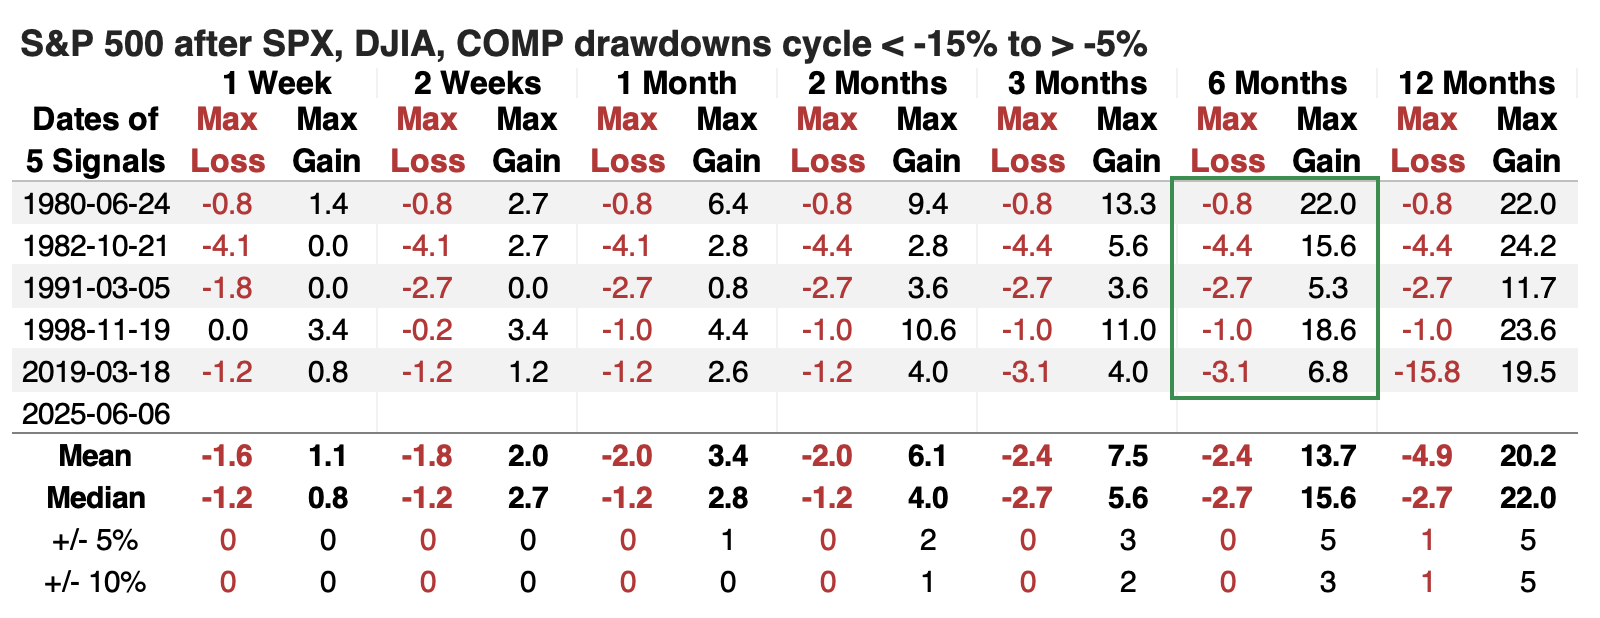
Even more notable than its consistency was how little risk there was within the next six months. The S&P didn't fall more than -4.4% at any point within that time frame across any of the signals (though, again, it's a tiny sample size), while its maximum gain exceeded that in every instance.
These signals were okay for the Dow Industrials, but it performed worse than the S&P 500, especially over shorter time frames. Its losses weren't significant, but it did not prove to be the place to be among the three.
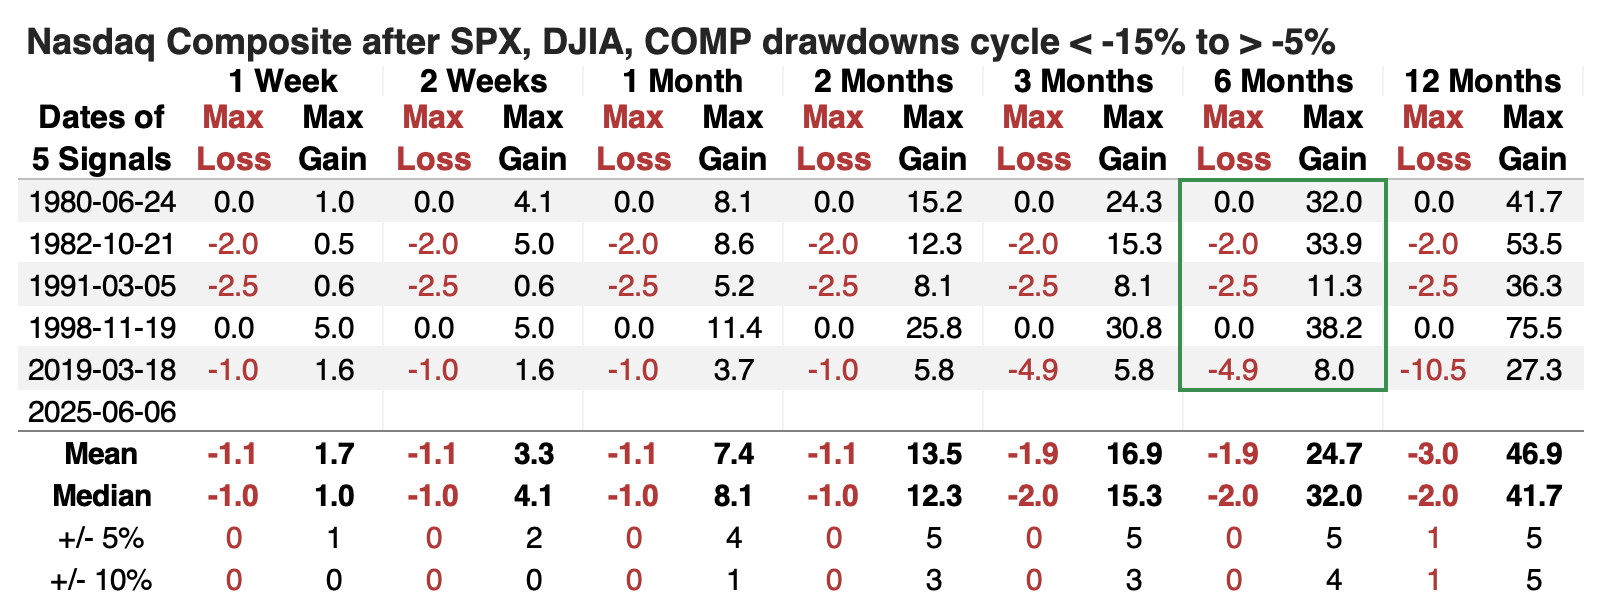
The index that shone the most was the Nasdaq Composite. It soared in the months following these signals, enjoying double-digit gains four out of five times over the following six months.
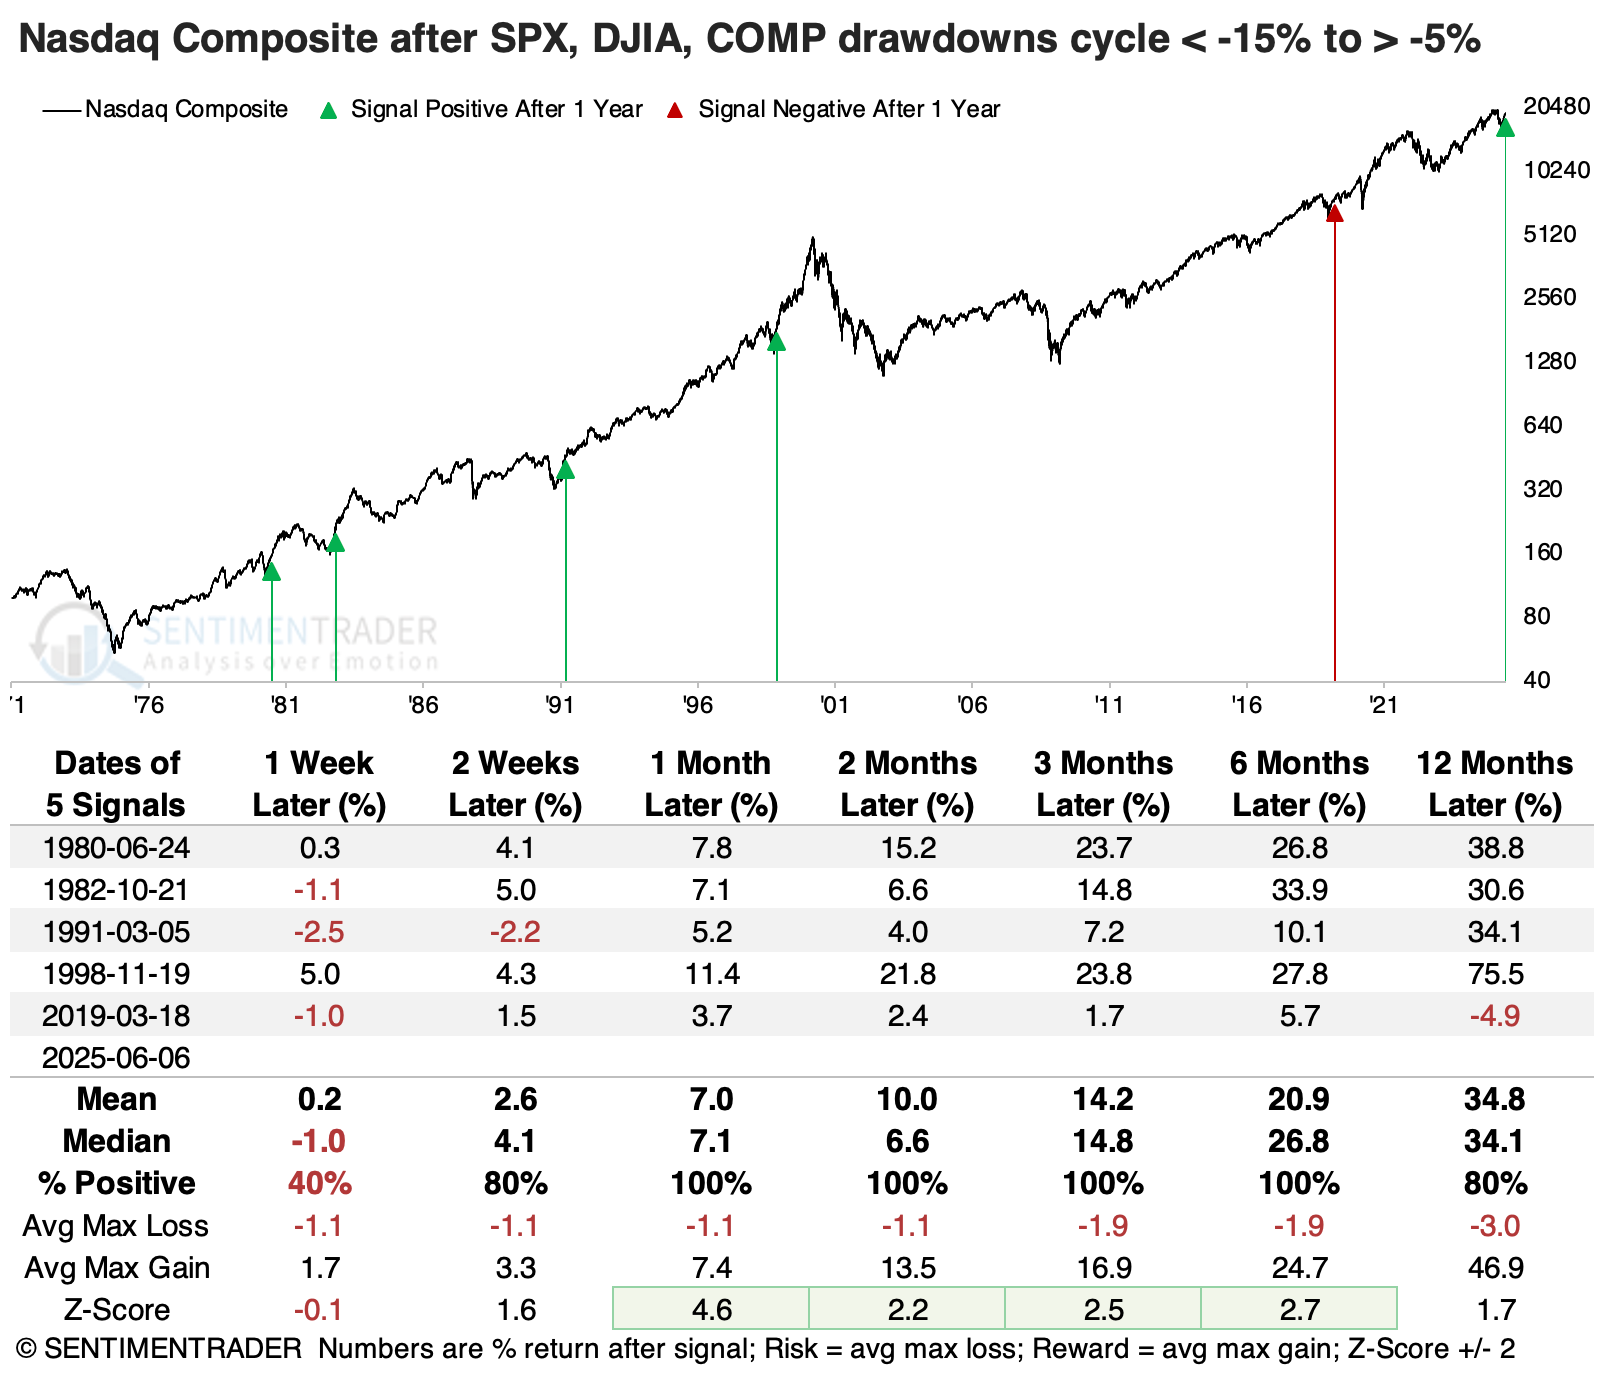
The risk/reward profile was fantastic, with the Nasdaq losing no more than -2.5% over the next two months after any signal, while enjoying modest to exceptional gains. Even over the following six months, there was a heavy skew toward reward over risk.
Recoveries from more modest drawdowns
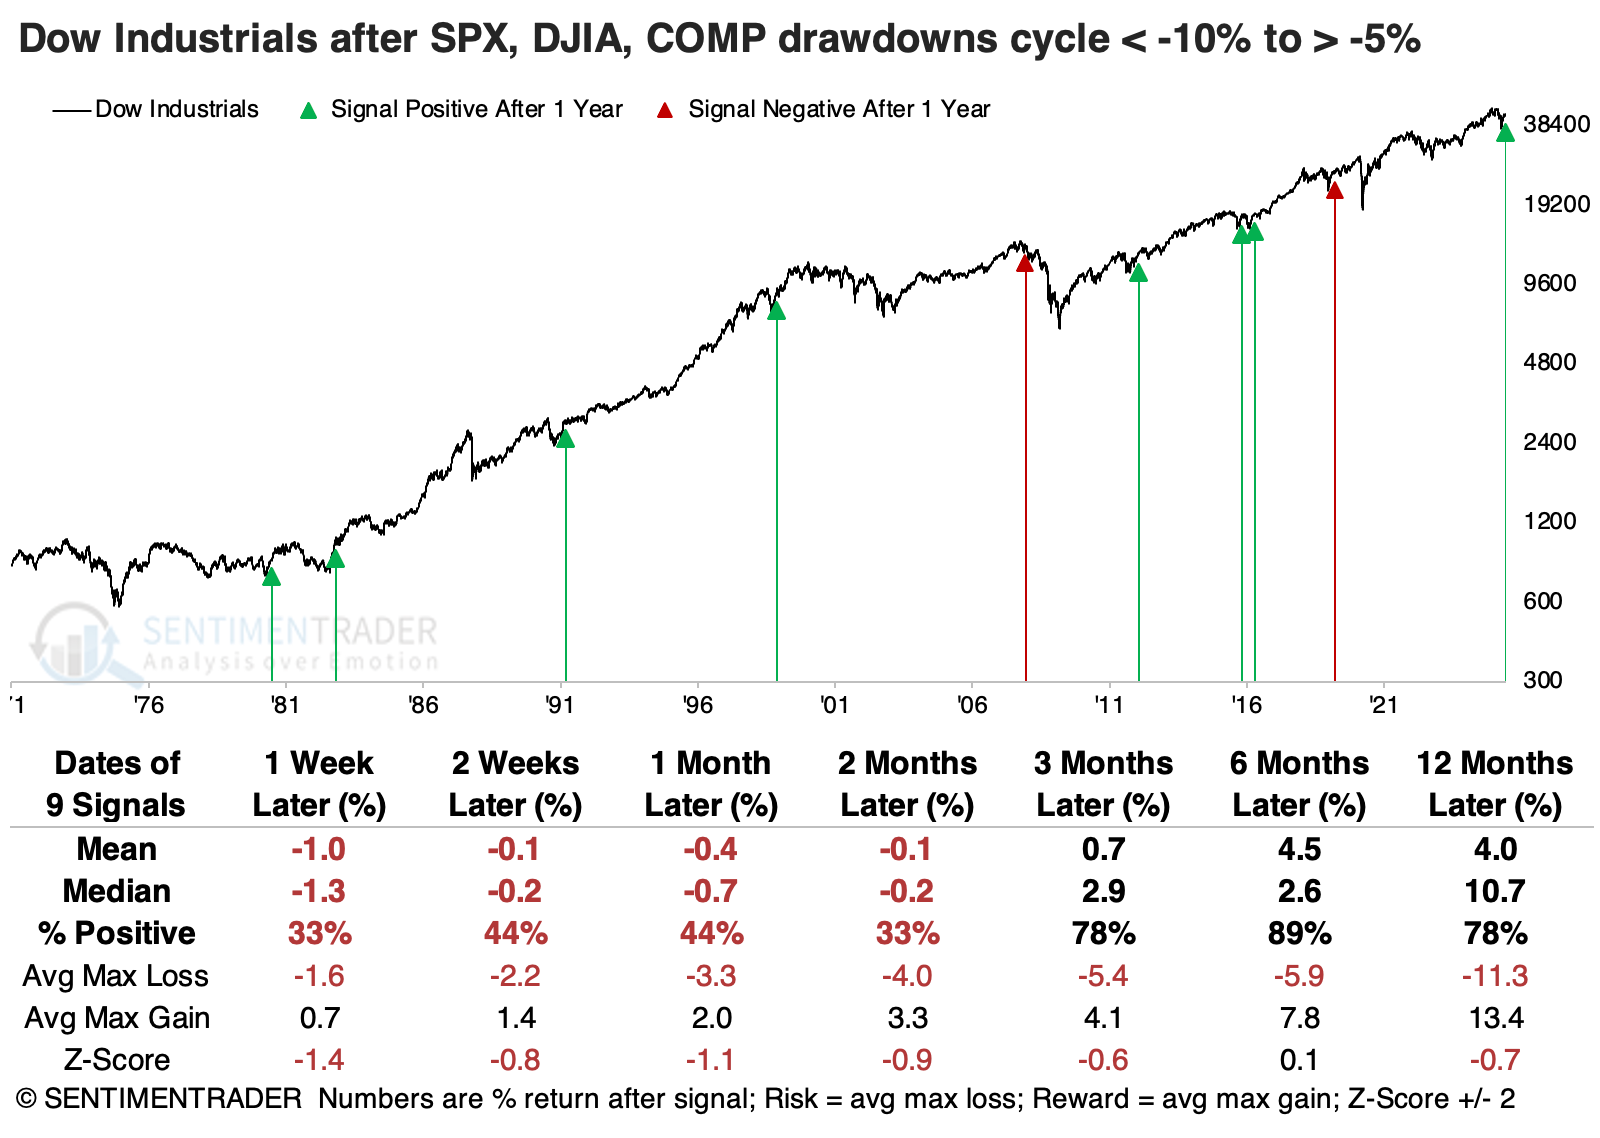
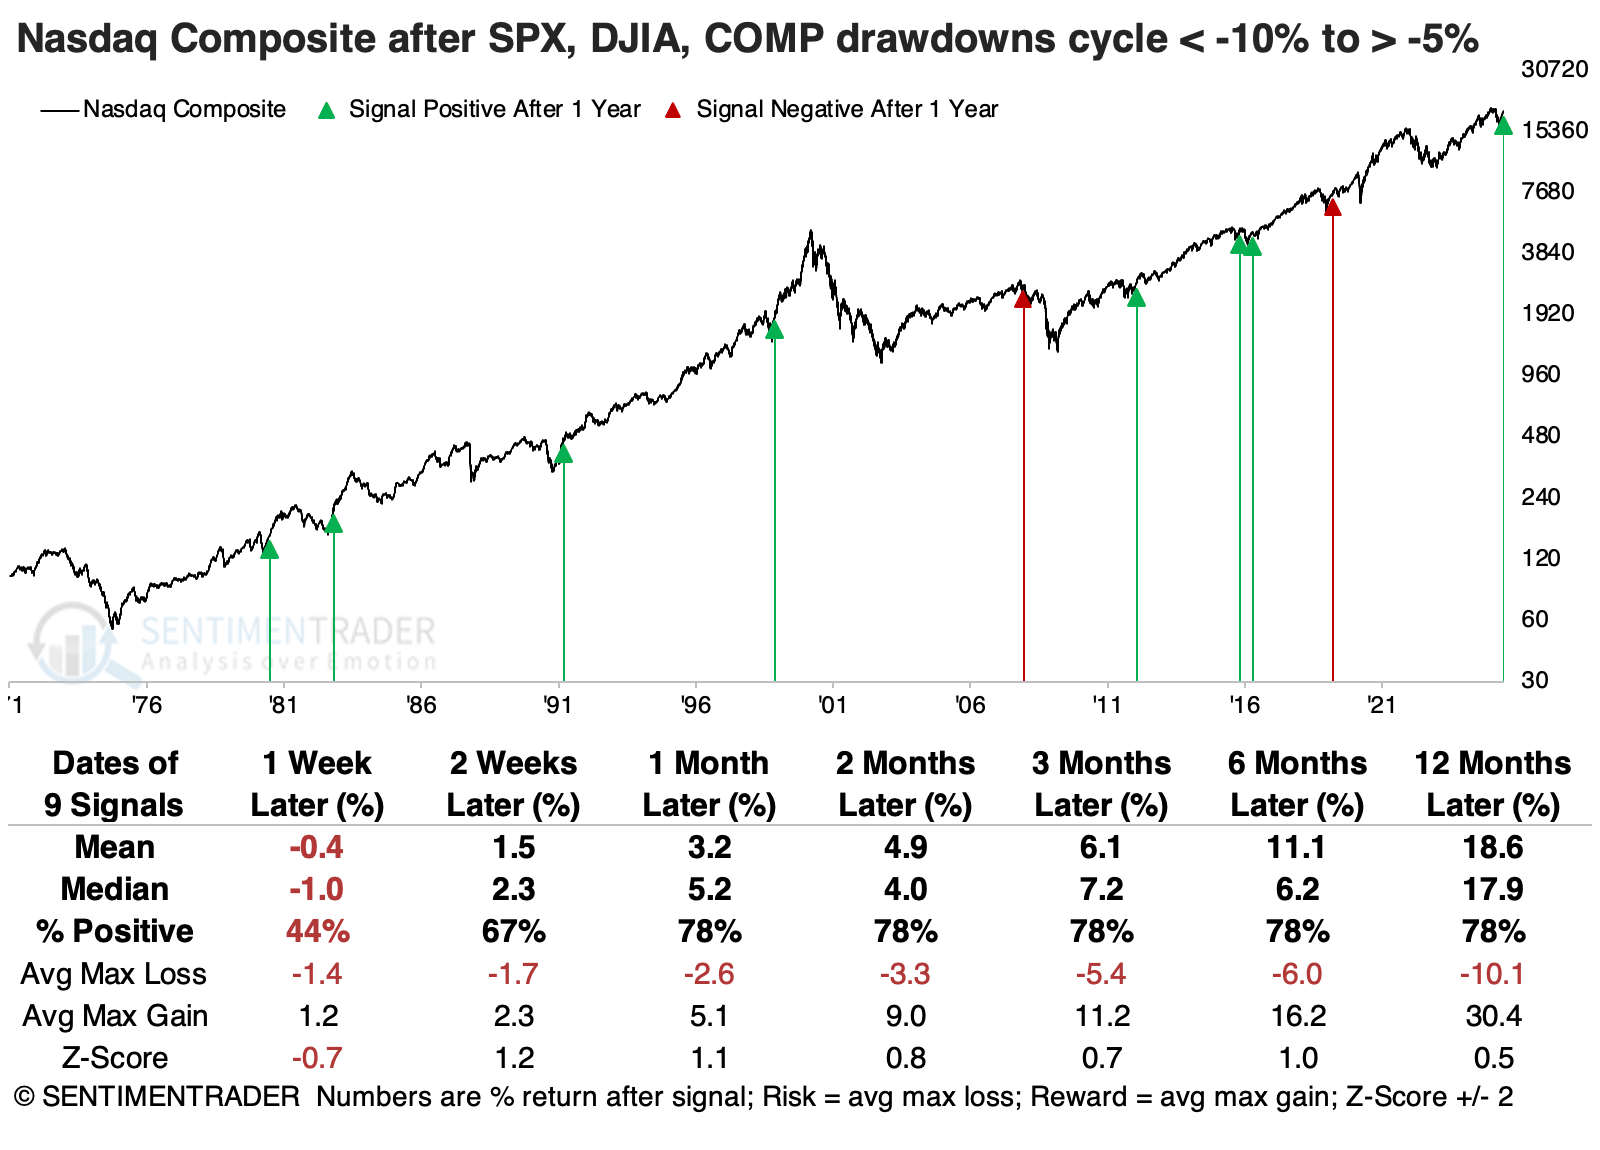
It's difficult to have high conviction with such a small sample, so the table below lessens the drawdown needed before the recovery for all three indices. That nearly doubles the sample size, but it's still small because we're dealing with exceptional and coordinated behavior.
The S&P still did very well over the following six months, with a single loss. Unfortunately, that date was one of the absolute worst times to increase exposure to stocks, as it was on the cusp of the global financial crisis. Still, there were only two times when the S&P lost more than -4.5% at any point within the following six months.
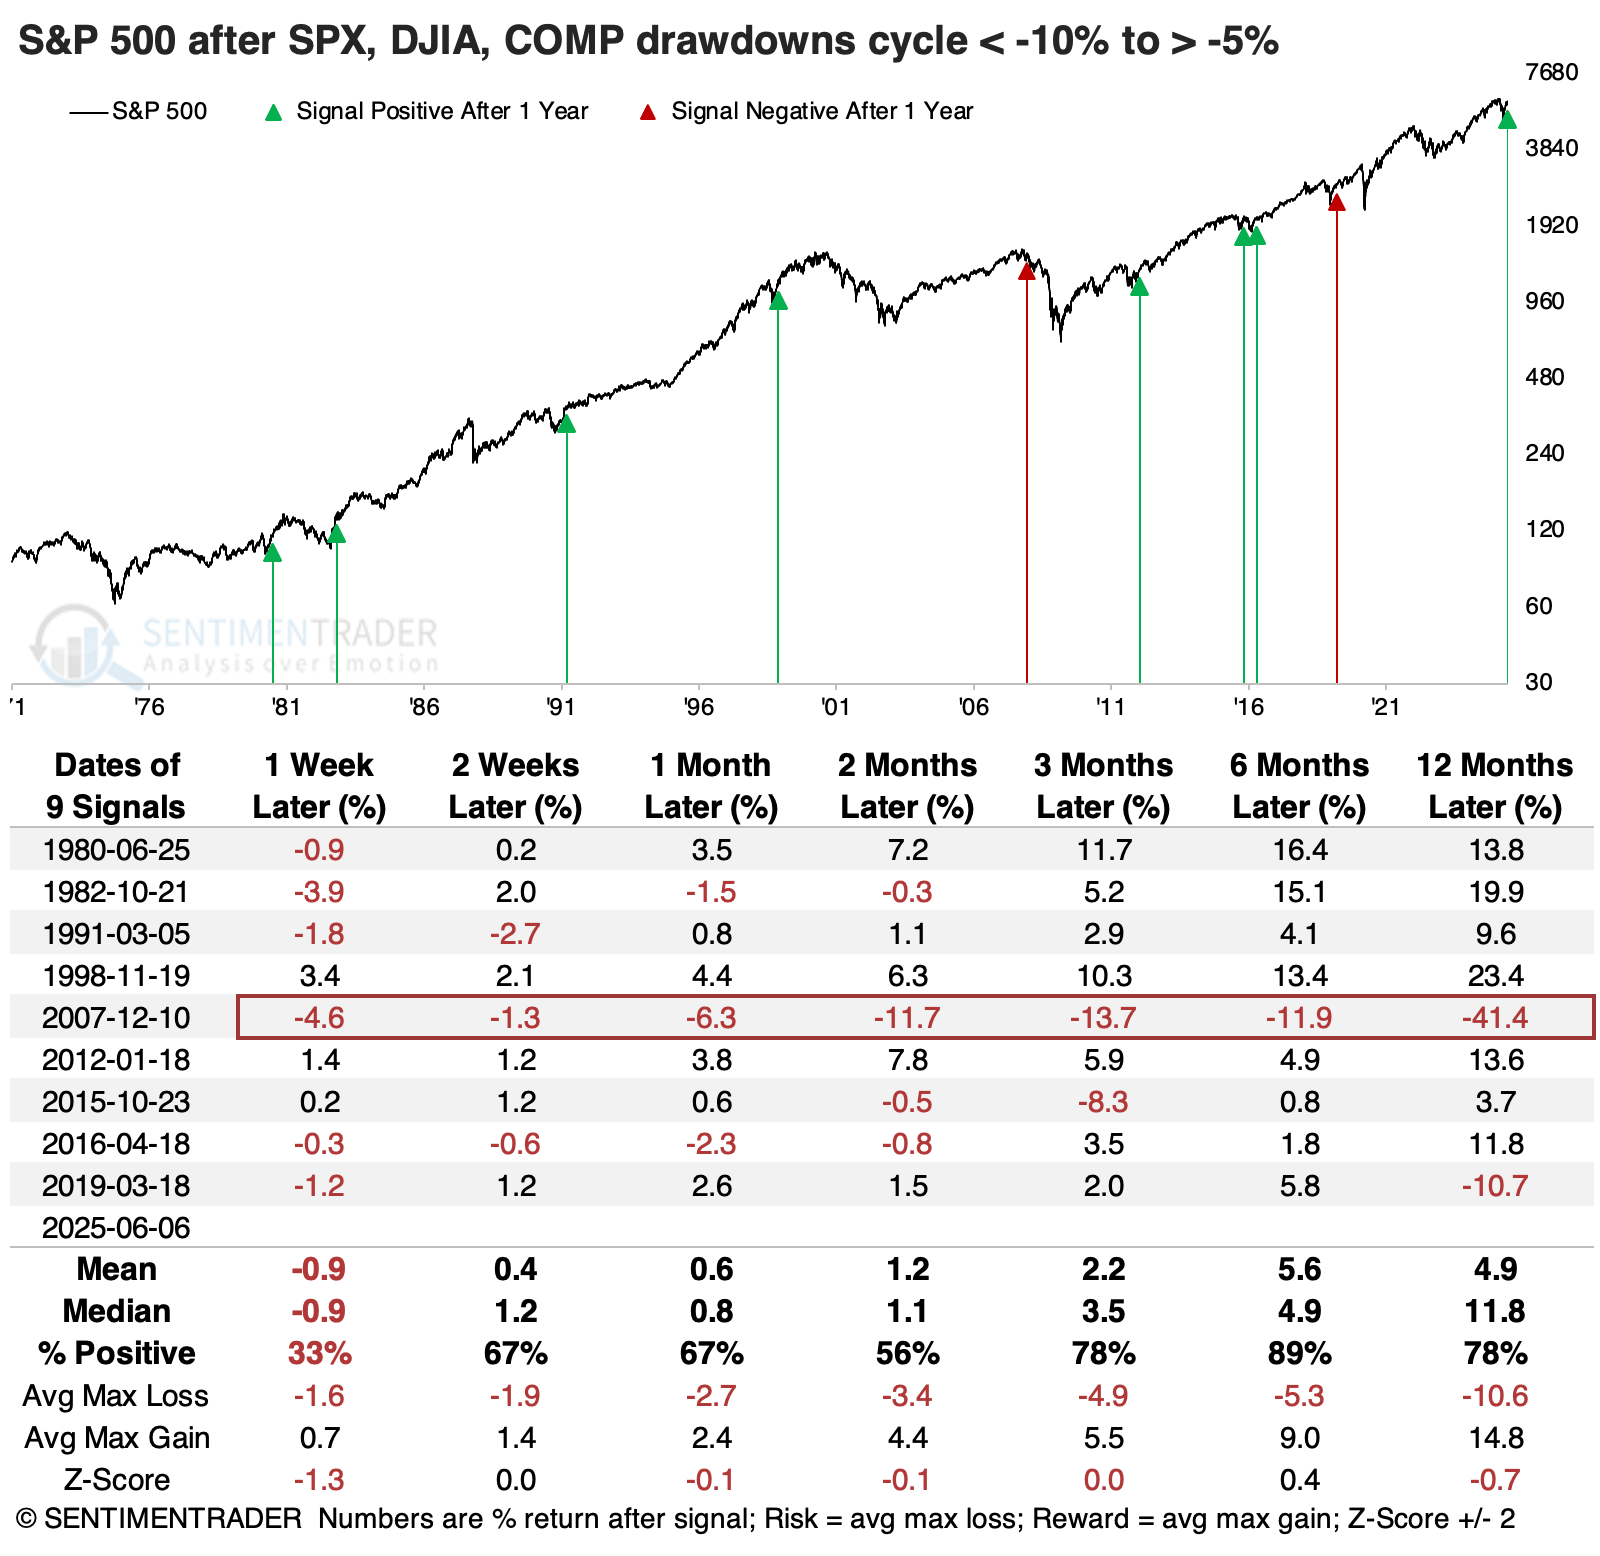
The summary table below shows that once again, the Dow witnessed poor returns, even up to two months later. While it recovered in the months following, except in 2007, it showed a poor risk/reward profile on the way there.
Once again, the Nasdaq proved to be a generally better place to be among the three indices, with a higher win rate, greater average return, and better ratio of reward to risk up to three months later.
What the research tells us...
Small-cap stocks have been among the biggest laggards for a while, which is dampening some longer-term breadth metrics. As Dean showed in a recent note, however, there are signs that this is changing for the better, which is an excellent sign for the broader market.
The fact that three of the most widely followed and benchmarked indices have already recovered most of their modest-to-serious drawdowns is also a positive sign. There haven't been many times in the past 50 years when all three major indices recovered so quickly from such heavy selling pressure, which limits us. But the times it happened, it boded well for a further recovery. It was an especially good sign for the tech-heavy Nasdaq, reinforcing some of the other studies we've published in recent weeks.