
Three more indicators on the bullish side of the ledger

Key points:
- Every major industry group in our database of 23 groups was recently oversold
- Put option trading in the largest of companies has given some clear indications in recent months
- These indicators are flashing signals that have typically seen stock prices rise over the following twelve months
Industry groups are oversold
Selling pressure has been widespread, and it's been enough to push every industry into a correction.
This breadth indicator shows the percentage of 23 industries that are trading more than 10% below their 52-week highs. Extreme readings often mark exhaustion for a particular price move.
The chart below displays those times when every industry was in a correction for at least three days, per the Backtest Engine. The table shows that the S&P 500's returns were excellent going forward, as this only triggered near major lows.
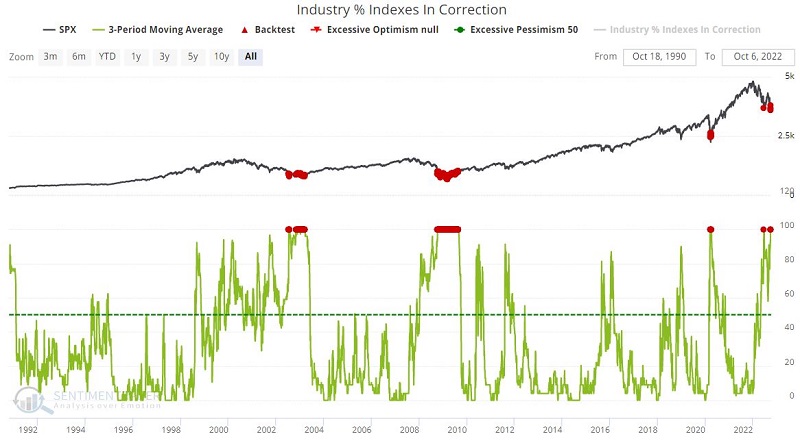
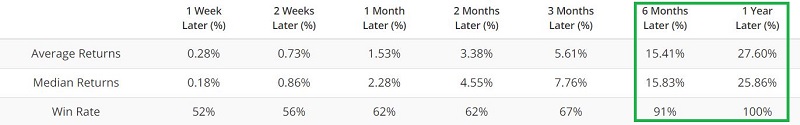
This particular indicator signal tends to give signals in clusters, and an actual price bottom typically takes some time to form - accompanied by some not-insignificant volatility. Nevertheless, 6-month and 12-month results are pretty compelling.
S&P 100 open interest gives a tell
OEX is shorthand for the S&P 100, an index of the 100 largest companies in the S&P 500. The OEX Open Interest Ratio takes the total put open interest and divides it by the total call open interest.
The chart below displays all dates when this indicator was below 0.70, and the table summarizes subsequent S&P 500 Index performance.
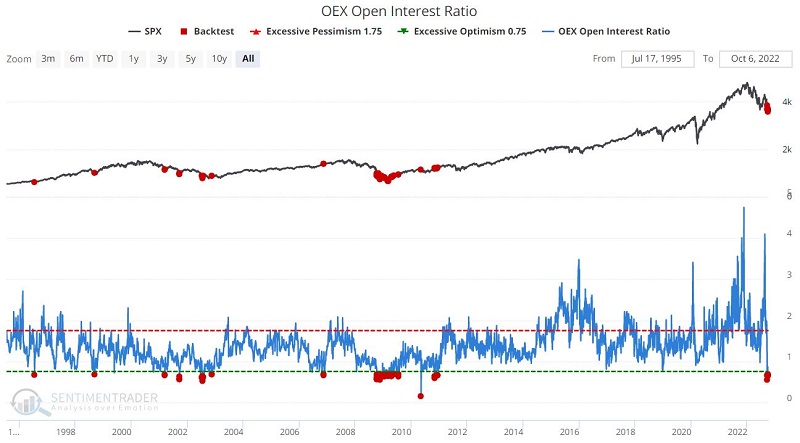
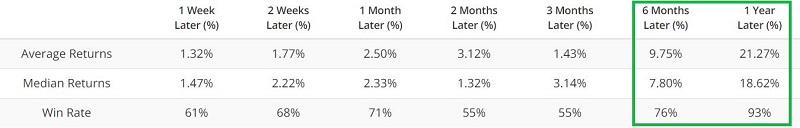
This is another example of an indicator that should not be relied upon as a standalone timing model but offers essential clues regarding market behavior six to twelve months out. The recent cluster of signals suggests a bottoming-out period for stocks.
Options on major companies signaling too much bearishness
The SPX Aggregated Put/Call Ratio analyzes the aggregated option data for constituents' stocks comprising the S&P 500 Index. Elevated readings indicate heavy put trading relative to call trading activity, typically a bullish contrarian signal.
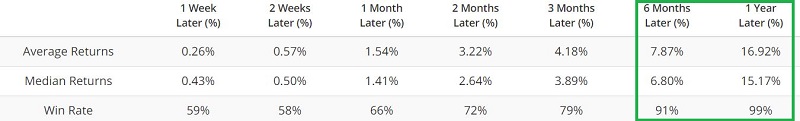
The chart below highlights days when the 20-day moving average of this indicator was above 0.80, and the table summarizes performance for the S&P 500 Index following previous signals.
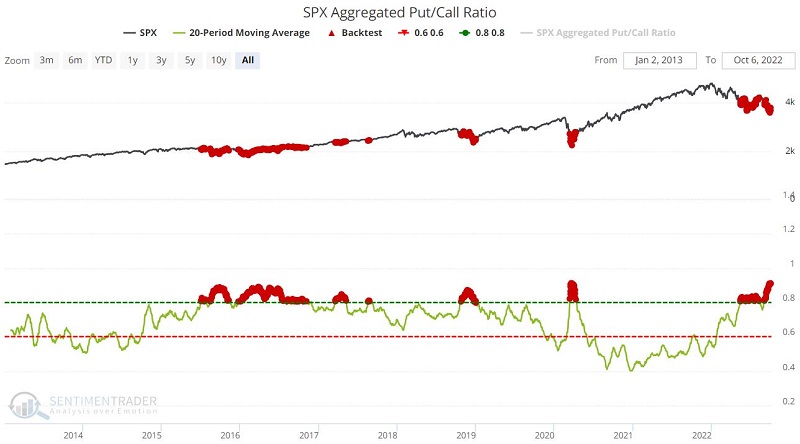
This is another indicator that a) tends to give signals in clusters and b) often flashes before a bottom is in place.
The key here is not to consider the first signal as a screaming buy signal. It's better if we see other confirming signs of a bottom after this indicator crosses above 0.80. As messy as some of the market action may be within clusters of signals, the six- and twelve-month forward results are hard to argue with.
What the research tells us…
Stock market bottoms are messy affairs. Declining stock prices create great angst. By the time the market bottoms, many investors have already thrown in the towel. The indicators above do not necessarily qualify as automatic buy signals. But when they give a signal - especially when they are all flashing green as they are now - investors should focus their attention on looking for buying opportunities and specific stocks or ETFs of interest.