
Three more indicators on the bullish side of the ledger

Key points:
- Fewer than 5% of S&P 500 stocks are holding above their 50-day moving averages
- The McClellan Oscillator has plunged, and almost all stocks are oversold
- Readings like this have preceded gains in the S&P 500 over the next year every time
Few stocks are now in medium-term uptrends
With further declines on Monday, few stocks in the S&P 500 are trading above their 50-day moving average. Extreme readings often mark exhaustion for a particular price move - but not always.
The chart below displays those times when the percentage of stocks in the S&P above their 50-day average was below 5%. The Backtest Engine shows that the SPDR S&P 500 Trust (SPY) had middling performance immediately afterward but then climbed.
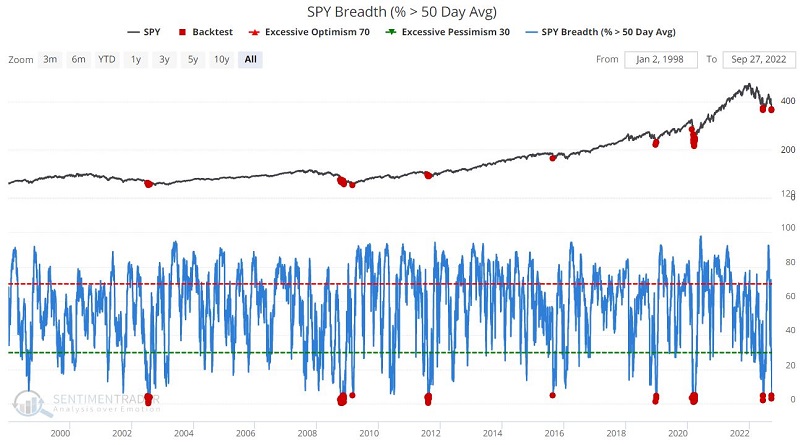
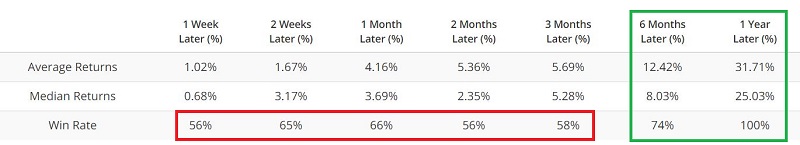
This particular indicator signal tends to be early (2002, 2008, 2020, and June 2022), and the results during the first two months after previous signals are little better than a coin flip. But 6-month and 12-month results are pretty compelling. This suggests that investors be actively looking for a buying opportunity in the next several months, hoping to see higher prices in the year ahead.
The selling has been broad-based and severe
Investors haven't just been selling S&P 500 stocks. It has been spread across the wider NYSE exchange, and has been quick and severe.
The McClellan Oscillator tracks the difference between NYSE advances and declines and, at times, highlights seriously oversold situations - like now. The chart below displays those dates when the McClellan Oscillator dropped to -128 or lower for the first time in a month, and the table summarizes subsequent S&P 500 Index performance.
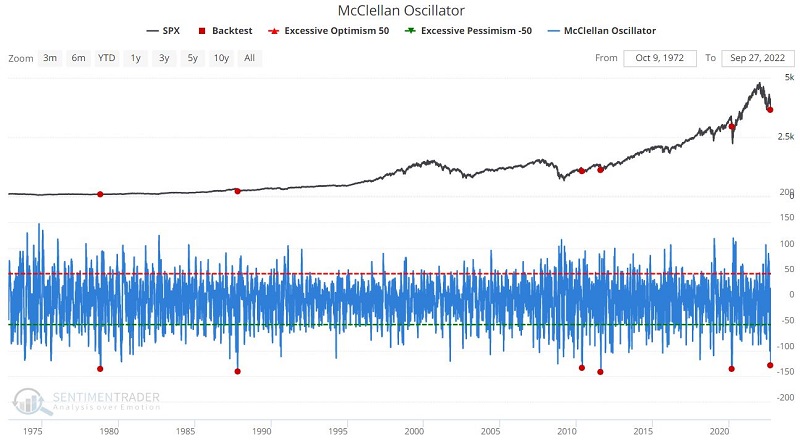
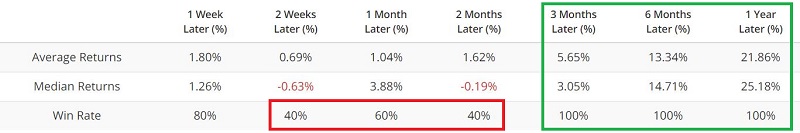
The sample size is small. However, that is simply a function of the fact that the market rarely reaches as oversold of a level as it just did. Like the previous indicator, signals tend to be early (note the 40% Win Rate two months after previous signals).
But here, too, the implication is that a bottom is forming. Things could get highly volatile in the next several months. Nevertheless, the message is to keep one's eyes open to the possibility of a terrific buying opportunity.
A large majority of stocks have hit oversold levels
On a very short-term basis, the last few sessions have been rough. It was enough to push a large majority of stocks in the broad S&P 1500 index down to oversold levels.
This indicator is also designed to highlight exceptionally oversold situations, which may help to identify buying opportunities. As the name implies, the indicator measures the percentage of S&P 1500 constituent stocks showing a 2-day RSI value below 30 at a given time.
The chart below displays those times when this indicator was above 90%, and the table summarizes performance for the SPDR S&P 500 ETF Trust (ticker SPY) following previous signals.
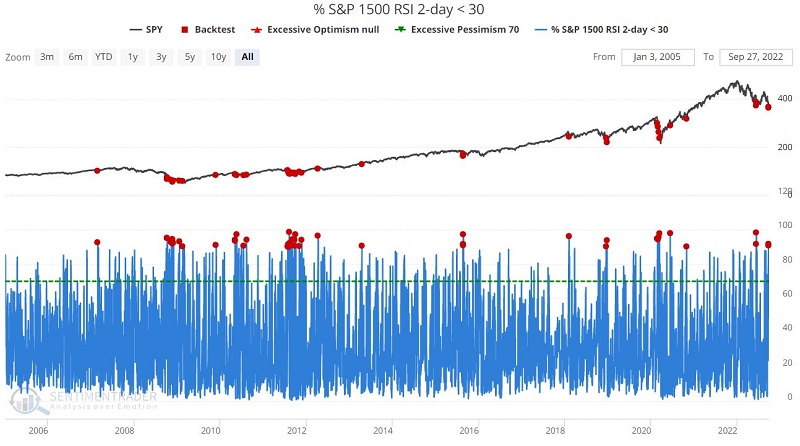
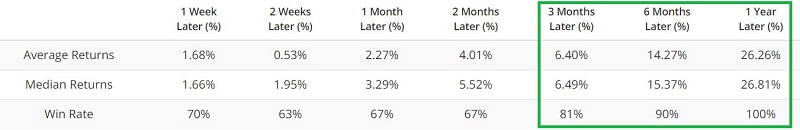
Like many oversold indicators, this one can be early and create a cluster of signals during a decline as the market attempts to form a bottom. The key is not to view each signal as some automatic buy signal but to note the historical six and 12-month returns and remain focused on looking for a buying opportunity.
What the research tells us…
Stock market bottoms are messy affairs. Declining stock prices create great angst. By the time the actual bottom is reached, many investors have already given up.
Using indicators like those above is similar to flying a plane at night in the clouds using instruments only. If you simply look around, it is easy to become disoriented. Focusing on the instruments - the weight of evidence - is the only way to get an accurate picture. The indicators above argue that investors should be, at the very least, preparing to buy.