
Three more indicators land on the favorable side of the ledger

Key points
- Bullish behavior within the consumer discretionary sector is generally considered favorable for the overall market
- Corporate insider's activity in the discretionary sector recently flashed a subtly favorable signal
- A measure of industry performance flashed a favorable signal
- Gamma exposure just crossed one favorable level and appears headed for another
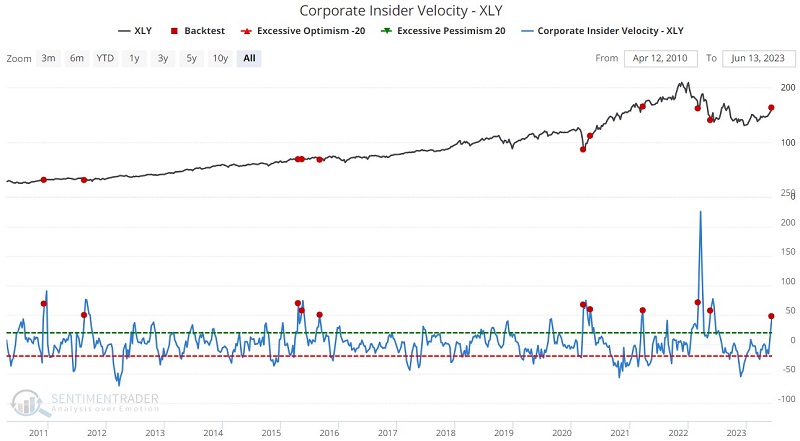
Consumer discretionary corporate insiders turning bullish
A subtle shift in the actions of corporate insiders in the consumer discretionary sector - a short-term pickup in buying combined with a continued low level of selling - just flashed what has historically been a favorable signal.
The red dots in the chart below highlight when our Corporate Insider Velocity - XLY indicator crossed above 48. The table summarizes the subsequent performance of the Consumer Discretionary Select Sector SPDR Fund (XLY).
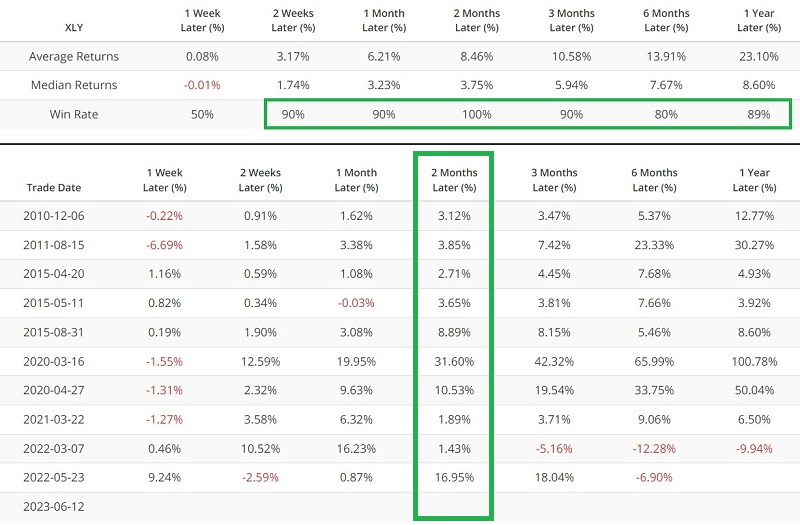
Shorter-term traders should take note of the historically high Win Rates during the two weeks to 3 months following previous signals.
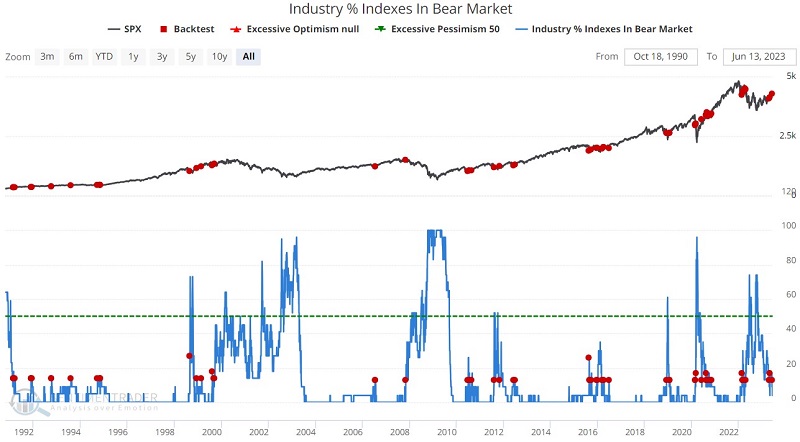
Industries in Correction % suggests a buying opportunity
Our Industry % Indexes in Correction indicator shows the percentage of 23 industries that are trading more than 10% below their 52-week highs. A low number is best in a perfect world, as that would suggest widespread bullish trends among industry groups. Likewise, a declining trend would also intuitively be favorable for stocks. Still, in an interesting twist, a rise from a low level often coincides with ordinary pullbacks in an uptrend. That is what we just saw recently.
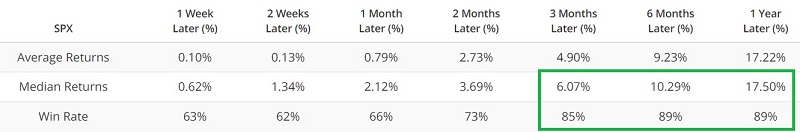
The red dots in the chart below highlight when this indicator's daily reading for crossed above 10%. Intuitively, this would seem like a bad thing - i.e., like something you would see near or shortly after a market top. And sometimes it is (note bad signals in late 2007 and early 2022). But remember, this indicator merely adds weight (or not) to the bullish side of the ledger and is not intended to be used as a mechanical trading system.
Overall, historical results have been favorable, as most crosses above 10% occurred during a normal pullback within a more significant uptrend. The hope is that the recent signal in early June will be one of the latter, not the former.
Gamma exposure crosses a significant threshold
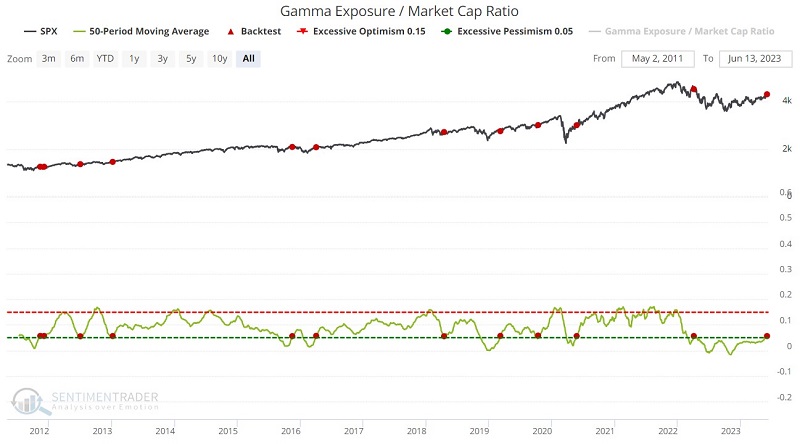
Gamma exposure refers to the sensitivity of existing options contracts to changes in the underlying price of the S&P 500. A raw gamma exposure value of 6 billion implies that if the price moves +/-1%, 6 billion shares will come to market to push price in the opposite of the prevailing direction. The Gamma Exposure / Market Cap Ratio indicator expresses the raw gamma exposure value as a percentage of total stock market capitalization.
Technical jargon aside, the highest values tend to occur as prices peak and the lowest values as prices bottom. A helpful way to apply this data for trading is to watch for a rise from a low value as a sign of a potentially favorable stock market trend.
The red dots in the chart below highlight those dates when the 50-day average of the Gamma Exposure / Market Cap Ratio indicator crossed above 0.05. The table summarizes the subsequent S&P 500 Index performance.
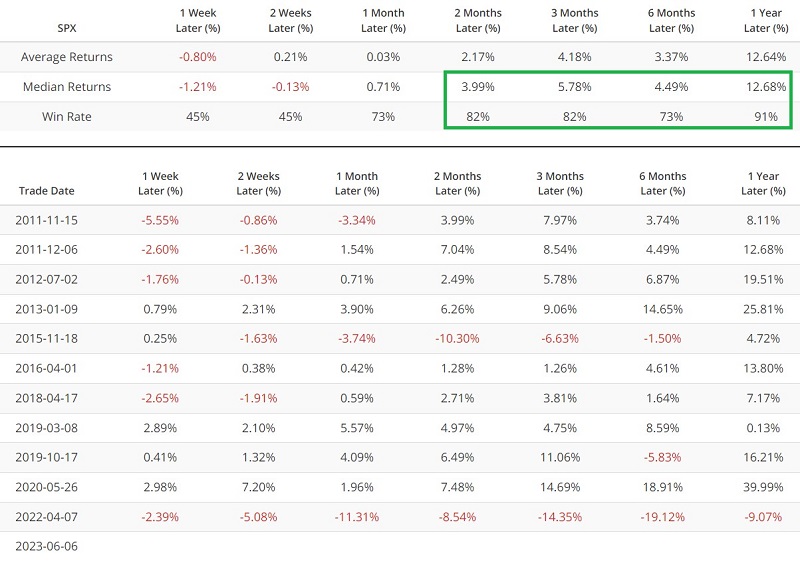
The signal in April of 2022 was wrong. Because of recency bias, the first thought of many traders will be to wonder if "maybe it doesn't work anymore?" The truth is that only time will tell. Nevertheless, it is essential to long-term success in the markets to recognize that there are no "perfect" indicators and that shying away from something after one wrong signal is typically a knee-jerk reaction that can cause a trader to miss out on the next good signal.
Again, time will tell. By itself, the most recent signal above may or may not be meaningful. As part of a confluence of indicators lining up on the favorable side of the ledger, it would seem to add weight.
What the research tells us…
The stock market has enjoyed a good run of late. Eventually, all rallies are followed by pullbacks and/or price consolidation. The market certainly appears due. Nevertheless, investors and traders need to focus on the bigger picture. The indicators above suggest continuing to give the bullish case the benefit of the doubt.