
Three more indicators for the favorable side of the ledger

Key points
- Market breadth continues to improve, and bread thrusts continue to fire off fresh signals
- The relative performance of High Beta stocks relative to High-Quality stocks has triggered another favorable signal
- Our Risk Appetite Index also gave a signal recently
- While none of the indicators detailed below may qualify on their own as a standalone trading model, when taken together, they paint a favorable picture
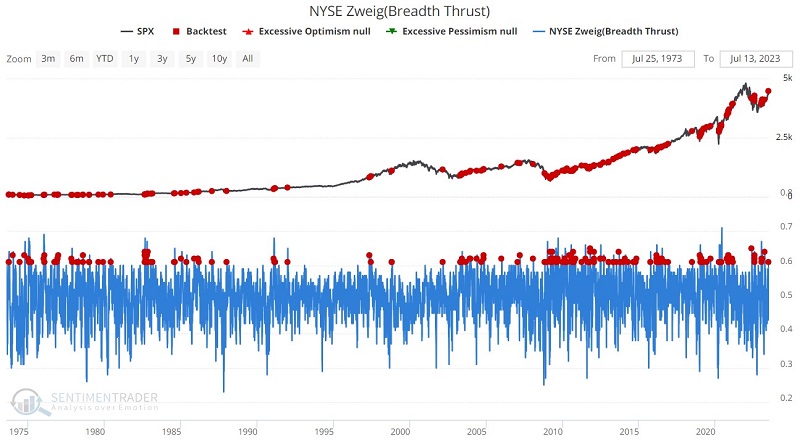
The NYSE Zweig Breadth Thrust indicator tops its critical level once again
The Breadth Thrust Indicator is a technical indicator used to identify market momentum. It is computed by calculating the number of advancing issues on an exchange, divided by the total number of issues (advancing + declining) on it, and generating a 10-day exponential moving average of this percentage.
A "classic" Zweig Breadth Thrust The indicator signals the start of a potential new bull market when it moves from below 40% (indicating an oversold market) to above 61.5% (indicating an overbought market) within any 10-day period. However, even if we apply a less stringent rule - i.e., any cross above 61.5% by the EMA - the signals tend to be favorable.
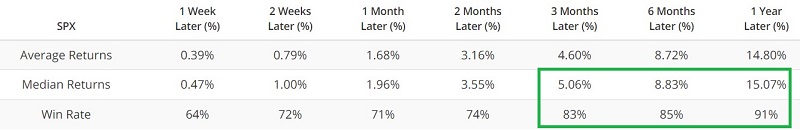
The chart below denotes a red dot every time this percentage's 10-day exponential moving average crossed above 61.5% (regardless of how low it went since the last cross above 61.5%). The table summarizes S&P 500 performance. The most recent signal occurred on 2023-07-12.
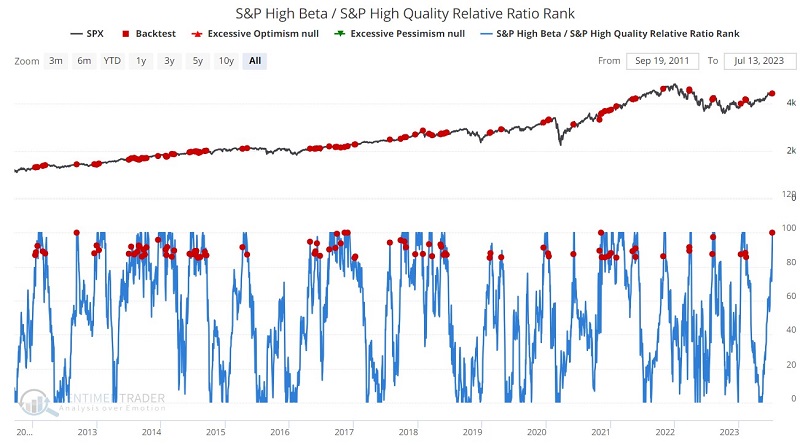
The S&P High Beta / S&P High-Quality Relative Ratio Rank reaches a high level
The S&P High Beta / S&P High-Quality Relative Ratio Rank indicator chart shows where the ratio is relative to its range over the past four months. When the relative ratio is high, investors are showing risk-on behavior. When the ratio drops to a low level, they exhibit risk-off behavior.
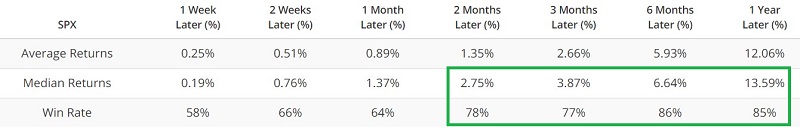
The chart below denotes a red dot every time this indicator crosses above 85, including all overlapping signals. The most recent signal occurred on 2023-07-10.
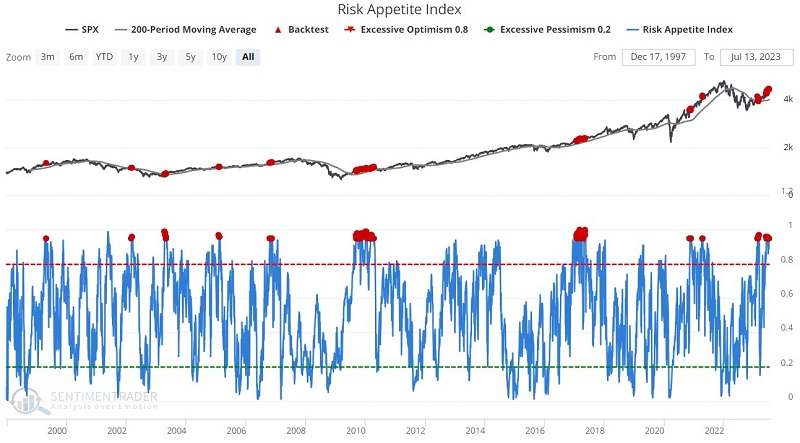
The Risk Appetite Index flashes another "risk on/trend up" signal
Like the previous indicator, the Risk Appetite Index measures risk-on, risk-off behavior. As the index rises, it means that investors are becoming more risk-seeking. An index reading of 1.0 would mean they are the most risk-seeking possible. As the index falls, investors are becoming more and more risk averse. An index reading of 0 would mean that everyone has gone into a bunker and stored canned goods for the next apocalypse.
The chart below denotes a red dot every time this indicator crossed above 0.95 while the S&P 500 Index exceeded its 200-day moving average. The most recent signal occurred on 2023-07-12.
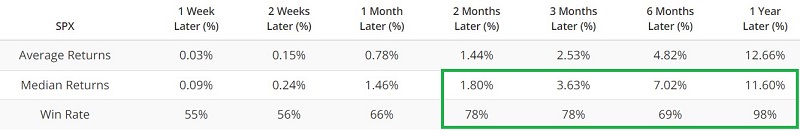
What the research tells us…
It is not recommended that any of the signal rules highlighted above be used as a standalone trading model or investment strategy. Still, because of the consistently strong Win Rates and returns, they are each potentially helpful as part of a broader weight of the evidence approach. As always, there are no guarantees, but when all three indicators flash signals within a short period, history suggests that long-term investors continue to give the bullish case the benefit of the doubt.