
Three More Indicators Flash Favorable Signals

Key points:
- We prefer a weight-of-the-evidence approach to assessing the trend of the stock market
- Risk on behavior (i.e., aggressive buying on the part of investors) is essential to sustaining a bull market
- Major Sector Breadth, IPO / S&P 500 Relative Ratio Rank, and the Intermediate Term Optimism Index have all recently added weight to the favorable side of the weight of the evidence ledger
Major Sector Breadth touches a significant level
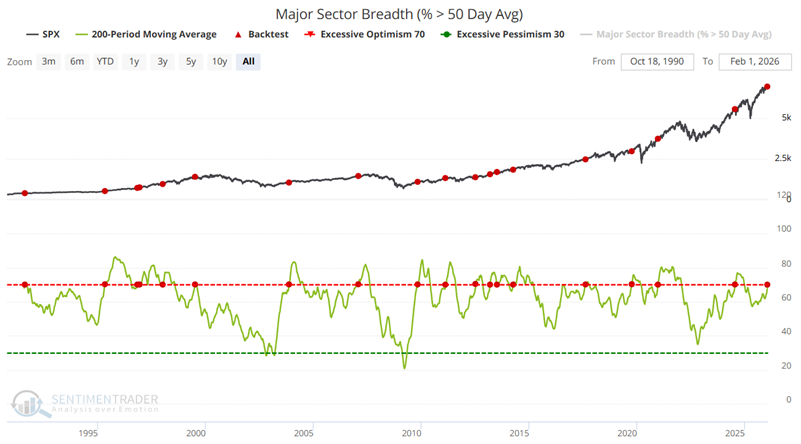
As the name implies, our Major Sector Breadth (% > 50-day average) indicator shows the percentage of the 11 major sectors trading above their 50-day moving averages. It includes technology, energy, financials, health care, utilities, consumer discretionary, consumer staples, industrials, communications, materials, and real estate. One application of this indicator uses a long-term moving average to create a trend-confirming indicator.
The chart below highlights all dates when the 200-day moving average for the Major Sector Breadth (% > 50-day average) indicator crossed above 70. As we can see below, this tends to occur during market uptrends and more often than not has seen further follow-through to the upside. The most recent signal occurred on January 30th.
The tables below summarize subsequent S&P 500 Index performance and results on a signal-by-signal basis.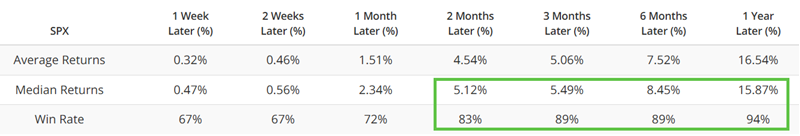
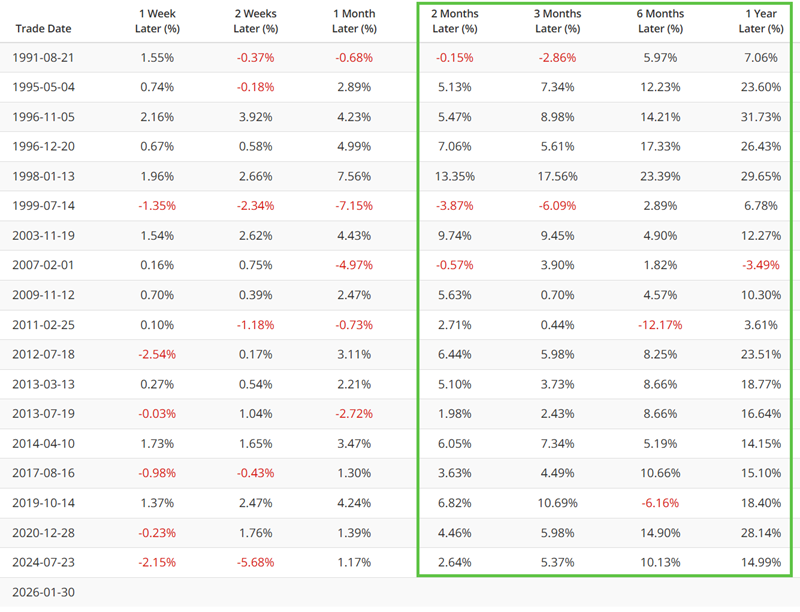
The key thing to note above is the high Win Rates from two months to twelve months.
IPO / S&P 500 Relative Ratio Rank bounces off a low
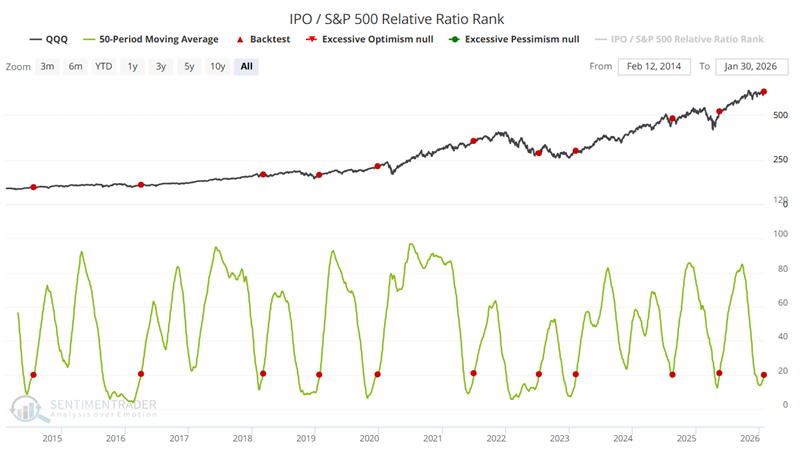
The IPO/S&P Relative Ratio Rank indicator measures the performance of Initial Public Offerings relative to the S&P 500, and where the ratio is relative to its range over the past four months. Standard interpretation holds that when the relative ratio is high, investors are exhibiting risk-on behavior. When the ratio drops to a low level, they are exhibiting risk-off behavior.
However, here is another instance where applying a longer-term moving average creates a de facto trend-reversal confirmation tool. The chart below highlights all dates when the 50-day average of the indicator crossed above 20. For this test, we use the Invesco QQQ Trust (QQQ) as the benchmark index. The most recent signal occurred on January 29th.
The table below summarizes QQQ performance following the dates highlighted in the chart above.
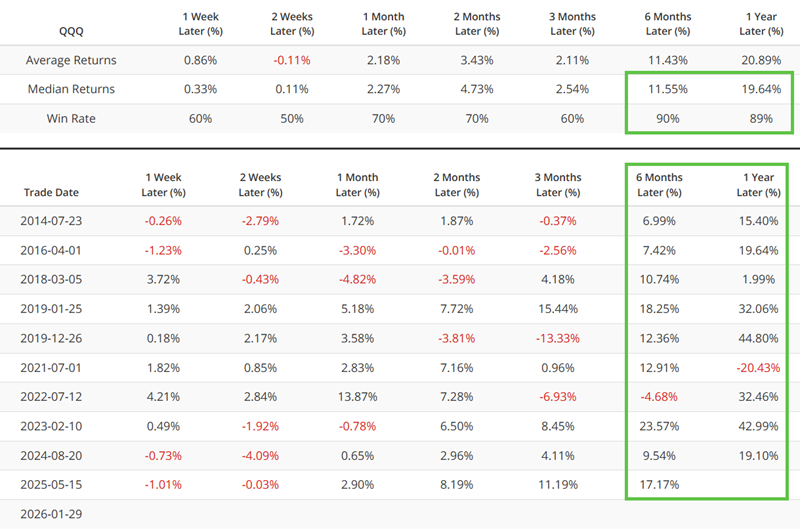
Intermediate Term Optimism Index signal Risk On
Note: The text below first appeared under Tools | Intraday Notes on January 29th. It is being re-published here as it dovetails with the other indicators noted above.
The chart below highlights the dates when the 200-day average of the Intermediate Term Optimism Index crossed above 65 for the first time in 12 months. The most recent signal occurred on January 28th.
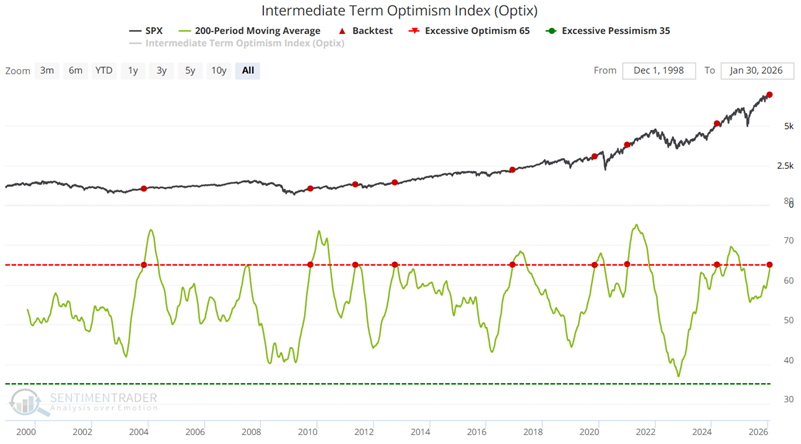
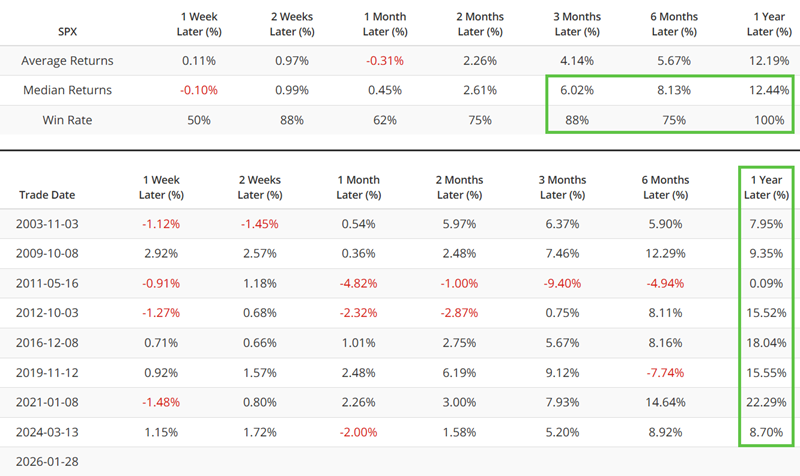
The table below summarizes subsequent S&P 500 index performance.
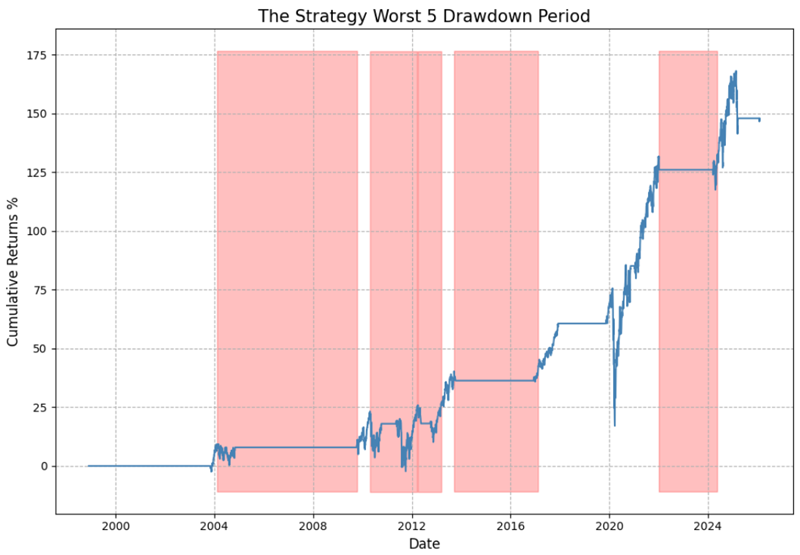
The chart below displays the hypothetical cumulative % +(-) from holding the S&P 500 Index following the signals shown above.
 What the research tells us…
There are plenty of caveats to apply to favorable indicator signals at the moment. The Dow Jones Industrial Average has closed higher for nine straight months, and the S&P 500 has closed higher for eight of the last nine. So it is fair to argue that the stock market is "due" for a consolidation/correction at any time, and that such a move should come as no surprise. Likewise, midterm election years are known for significant corrections within the first nine months of the year. Adding to all this is the standard reminder that no given signal from any single indicator should be viewed as proof positive of what will happen next in the market.
With all of these concerns firmly in mind, there are two key points to consider. First, it takes aggressive buying to sustain an ongoing bull market. Therefore, when we see multiple signs of significant risk-on behavior among investors as detailed in this note (see also here, here, and here), it is typically helpful for longer-term investors to give the favorable case the benefit of the doubt until market action gives a specific reason to do otherwise.