
Three Key Growth and Cyclical Sectors Dominate New Highs List

Key points
- Broad participation is driving the S&P 500 to record highs, with the proportion of stocks hitting 52-week highs simultaneously breaking above 12% in the Technology, Industrials, and Real Estate sectors.
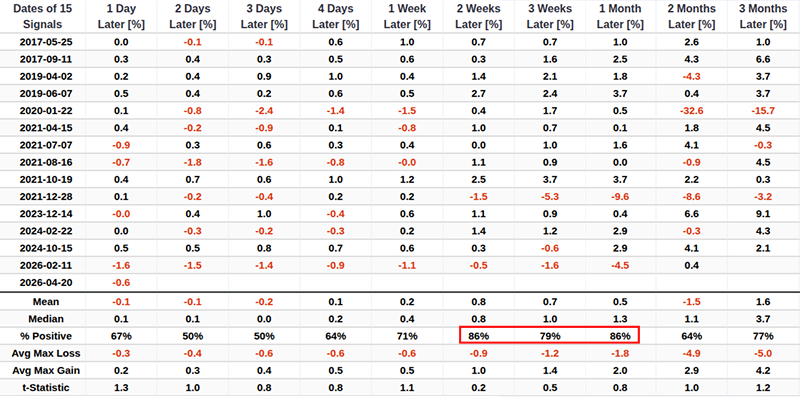
- Historically, this rare confluence of peak trend strength and expansive breadth yields an 86% win rate for the S&P 500 over the subsequent two-week and one-month windows.
- The extreme readings from the Stock/Bond Ratio reflects massive risk-on capital flows
A bullish market message confirmed by broad participation and trend strength
Cyclical stocks continue to flash bullish breadth signals, reflecting strong investor confidence in the broader economic growth outlook.
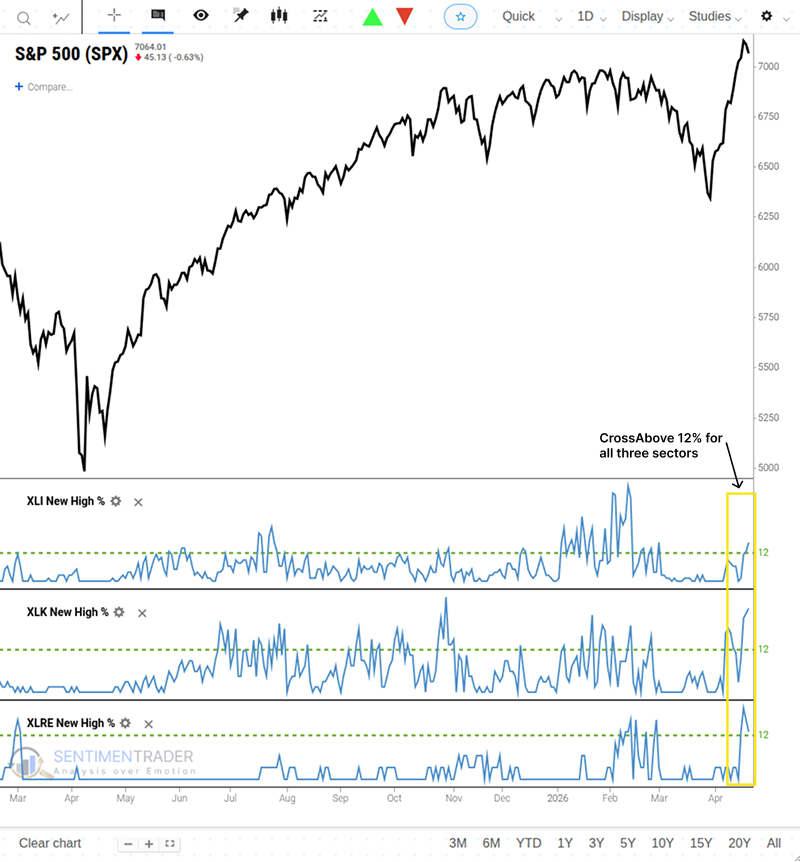
As the S&P 500 closed at a record high, the number of stocks printing new 52-week highs surged across key leading sectors. The proportion of stocks reaching 52-week highs simultaneously exceeded 12% in three critical areas: Technology (XLK), Industrials (XLI), and Real Estate(XLRE).
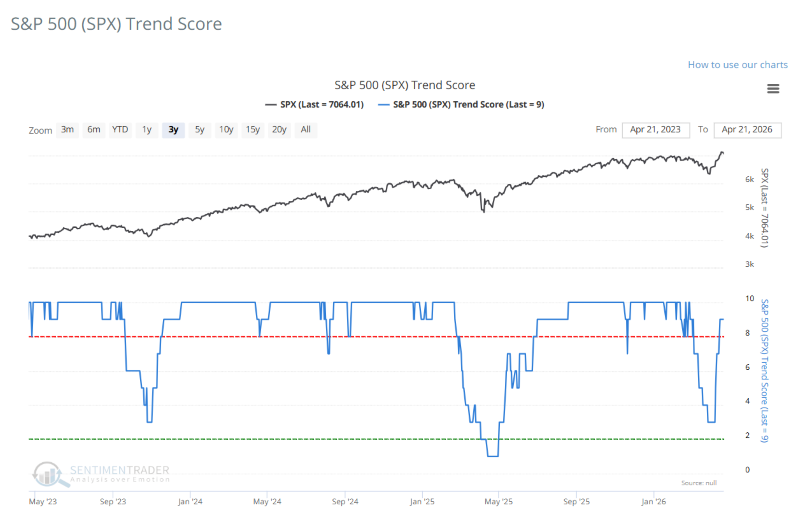
The S&P 500 Trend Score hit a 9, confirming this bullish internal setup. A score this high indicates that the majority of components within the model-which evaluates trend health across multiple timeframes-are firmly in positive territory. Seeing highly elevated trend readings align with major sectors hitting new highs paints a picture of a market firing on all cylinders.
This kind of confluence-broad participation paired with highly elevated trend scores-forces us to ask a key question: is this sustainable momentum or late-stage exhaustion? For the related backtest, click here.
Similar confluence of breadth and trend strength suggests the uptrend is sustainable
When broad participation and elevated trend strength align near record highs, the forward outlook for the S&P 500 is overwhelmingly bullish. The most compelling edge appears in the short term-specifically the two-week and one-month windows-where the index boasts an 86% win rate following these signals.
Current Sector Trend Scores and Leading Stocks
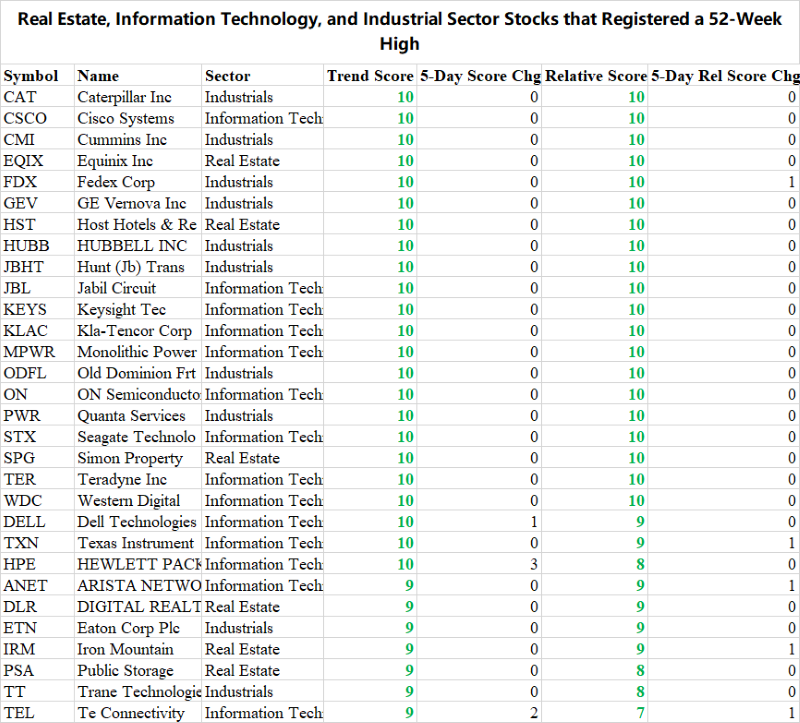
The table below lists every stock across the Real Estate, Information Technology, and Industrials sectors that reached a 52-week high, along with its absolute and relative trend scores. All of these names have positive scores, with the majority clearing the bullish threshold of 8 or higher.
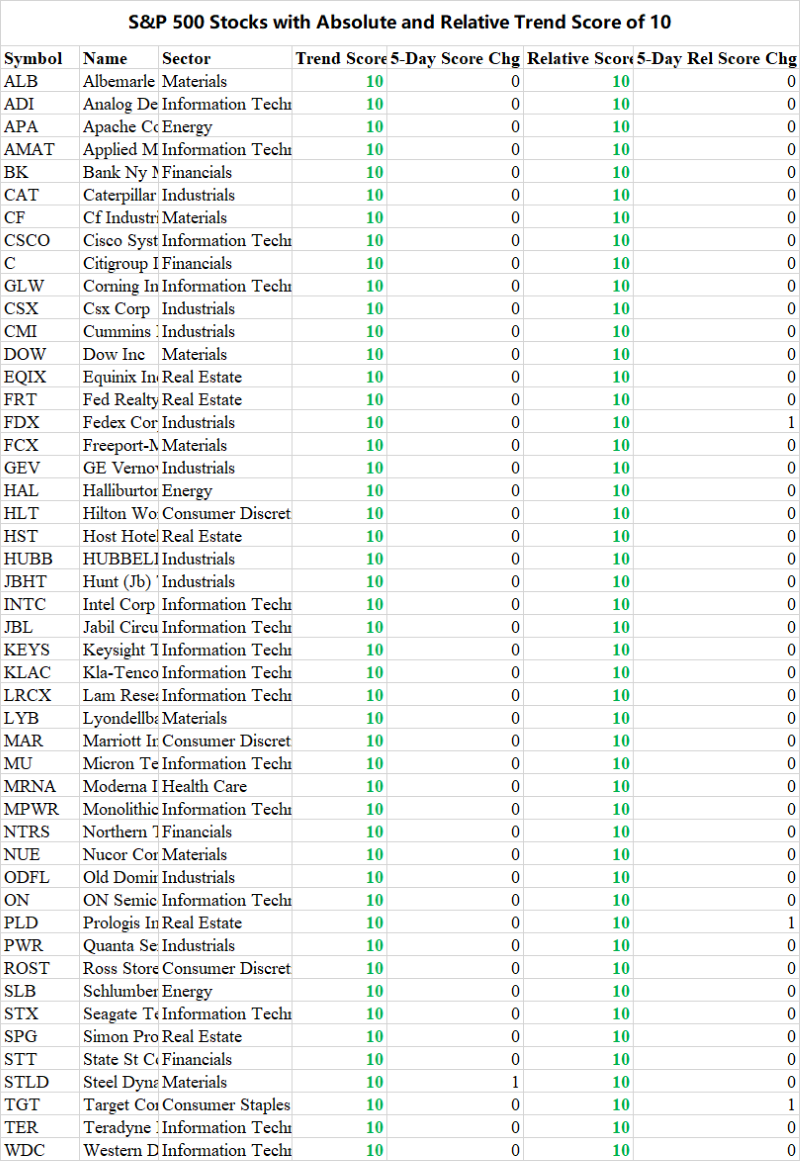
The following table contains all S&P 500 stocks with a perfect absolute and relative trend score of 10. While cyclical and growth names clearly dominate the list, investors running a more balanced book can still uncover tactical opportunities in other sectors.
Additional context
The Stock/Bond Ratio measures whether equities are undervalued or overvalued relative to fixed income; it also serves as an excellent gauge for institutional risk appetite. Right now, the ratio's elevated levels reflect a highly confident, risk-on environment.
Last Friday, the ratio broke out to 2.53. From a trading perspective, we want to rely on a systematic approach to accurately weigh risk versus reward across different time horizons.
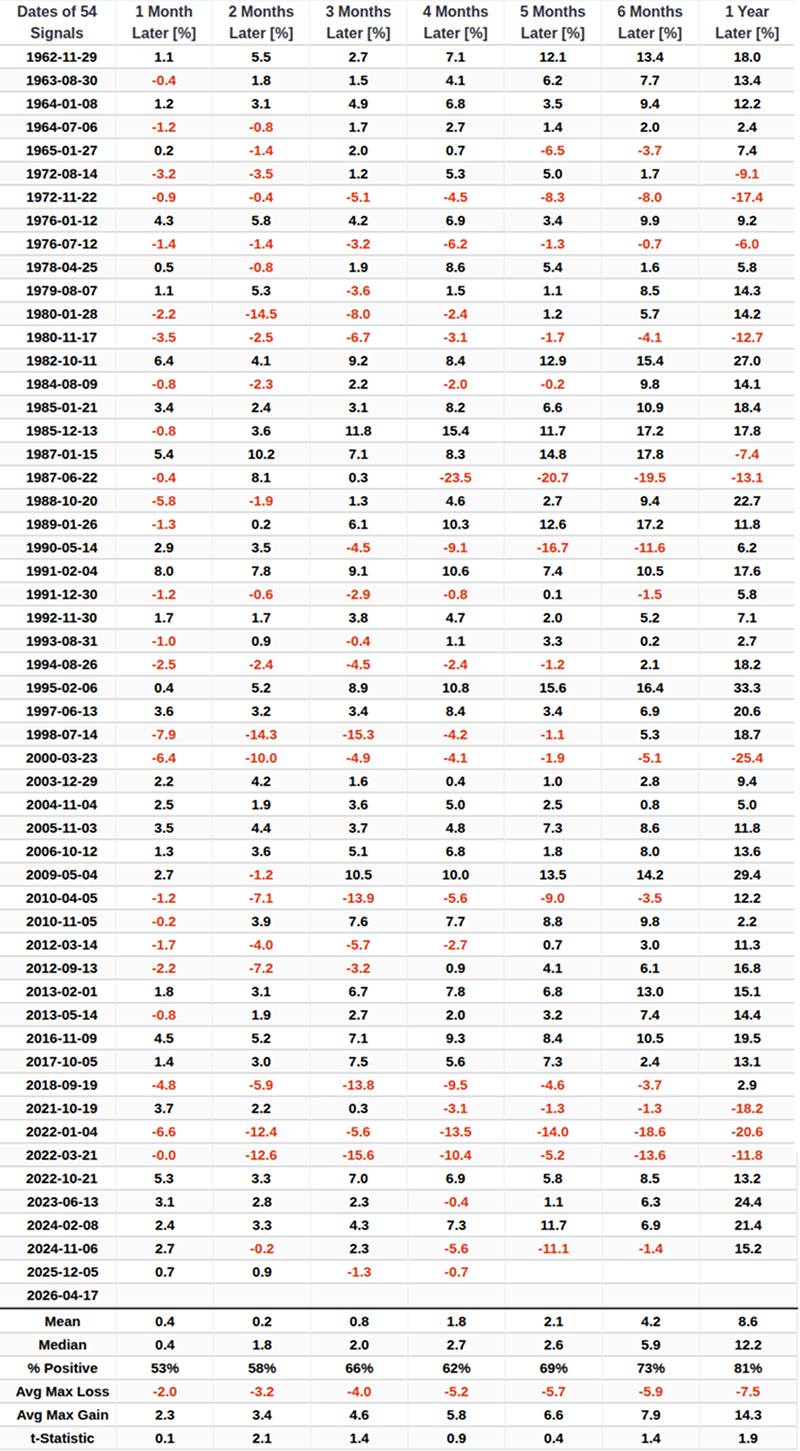
With that in mind, here is the forward outlook for the S&P 500 after the Stock/Bond Ratio crosses the 2.5 threshold (incorporating a reset below 0 to filter out clustered signals).
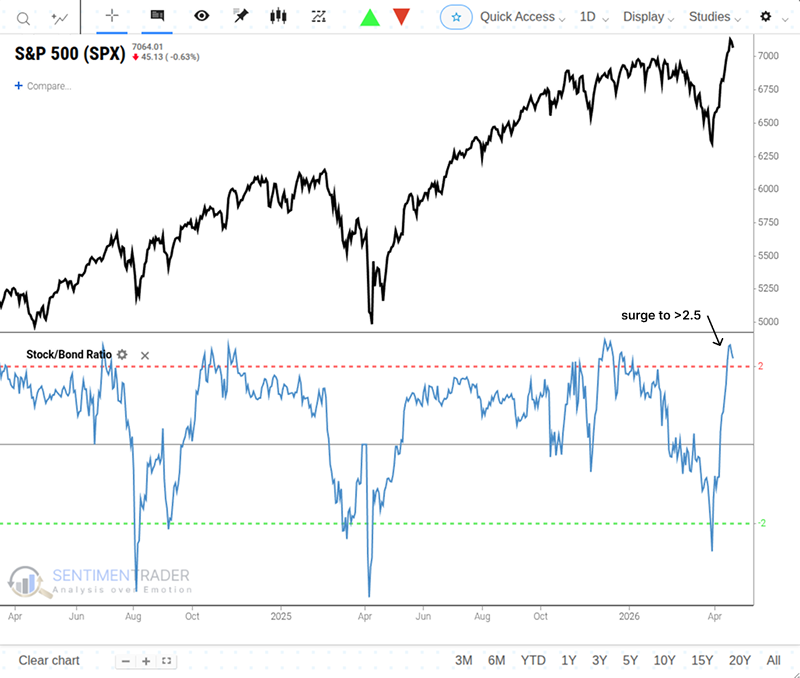
Historically, the ratio surges to the 2.5 level mark a climactic shift of capital out of bonds and into equities. Looking out a year later, the S&P 500 trades higher 81% of the time, showing a statistically significant edge over random market returns.
What the research tells us...
The underlying market structure remains exceptionally strong, led by cyclical and growth names rather than defensive proxies. A simultaneous breakout in 52-week highs across Tech, Industrials, and Real Estate-paired with a positive S&P 500 trend score-points to a sustainable uptrend rather than late-stage exhaustion. Add in the extreme readings from the Stock/Bond Ratio, which reflects massive risk-on capital flows. Broad-based strength combined with favorable Stock/Bond Ratio has historically been indicative of a sustainable uptrend.
It is important to note, however, that the expansion of key sectors should not be viewed as a "set it and forget it" buy signal, but rather as weight of the evidence. There is absolutely no guarantee that the recent broadening of market breadth will continue this trend.