
Three Indicators that have Flashed Continuation Signals Recently

Key points
- Not every indicator is intended to serve as an automatic "Buy/Sell" signal generator or standalone trading system
- Some indicators add value by acting as "continuation" signals, which confirm an ongoing trend
- Microcap and high volatility stocks have led the recent advance - a "risk on" signal which suggests that the advance is broadening out to previous underperforming market sectors
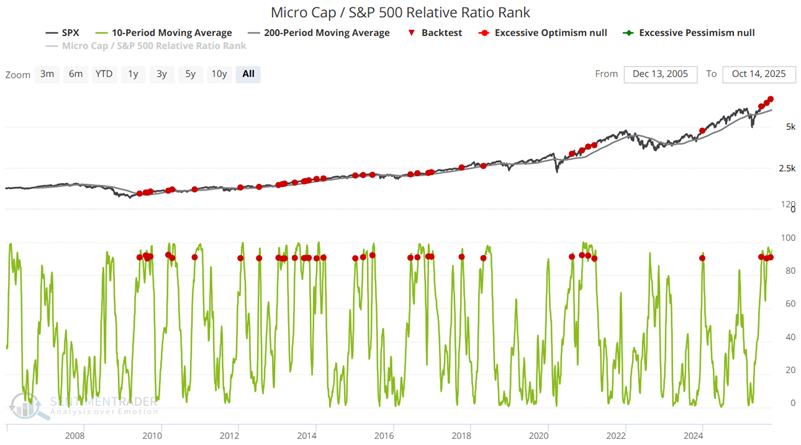
Indicator #1: Microcap / S&P Relative Ratio Rank
It is typically a good sign for an ongoing bull market if participation expands and more stocks participate. Microcap stocks finally appear to have joined the party recently. The Microcap / S&P Relative Ratio Rank indicator compares the performance of the smallest capitalized stocks relative to the largest and shows where the ratio is relative to its range over the past four months. When the relative ratio is high, investors are showing risk-on behavior. When the ratio drops to a low level, they exhibit risk-off behavior.
The chart below highlights all dates when the 10-day average of the Micro Cap / S&P Relative Ratio Rank indicator crossed above 90% while the S&P 500 index was above its 200-day moving average. The 200-day index average filters for an uptrend in the broader market, while the cross above 90% for the indicator average indicates that small companies are showing greater strength relative to large ones.
The most recent signals occurred on July 9th, August 27th, and October 3rd. Before that, the most recent signal was in December 2023. So, it has clearly been a while since micro-cap stocks have shone. Historically, this has tended to be a sign that the market will continue to run.
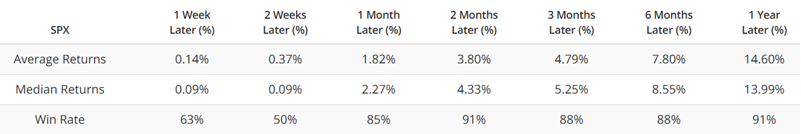
The table below summarizes S&P 500 performance following the signal dates highlighted above.
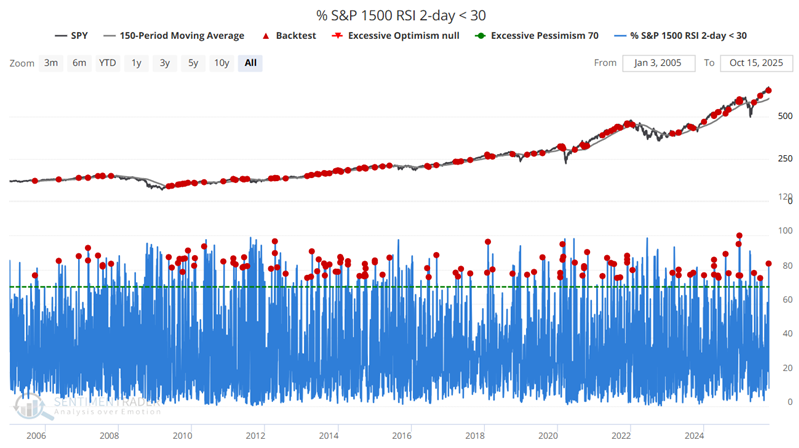
Indicator #2: Percentage of S&P 1500 stocks with 2-day RSI < 30
As the name implies, this indicator reports the percentage of S&P 1500 index stocks showing a 2-day RSI reading below 30%. The chart below highlights all dates when the value was greater than 75% and the S&P 500 index is above its 150-day moving average.
This test is intended to identify an oversold situation (a lot of stocks with 2-day RSI below 30%) within the context of a broader market advance (S&P 500 above its 150-day average). The most recent signal occurred on October 10th.
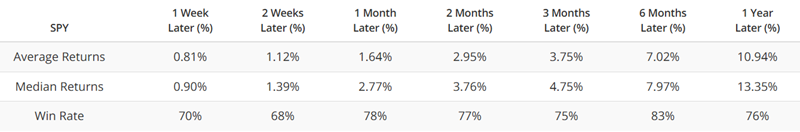
The table below summarizes S&P 500 performance following the signal dates highlighted above.
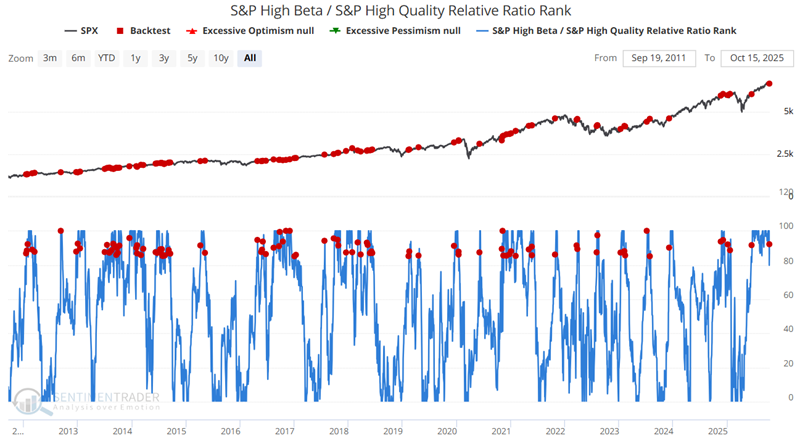
Indicator #3: S&P High Beta / S&P High Quality Relative Ratio Rank
This indicator compares the performance of an index of more volatile stocks to an index of less volatile stocks and then reports where the ratio is relative to its range over the past four months. When the relative ratio is high, investors are showing risk-on behavior. When the ratio drops to a low level, they exhibit risk-off behavior.
The chart below highlights all dates when the indicator crossed above 85%. The most recent signal occurred on October 13th.
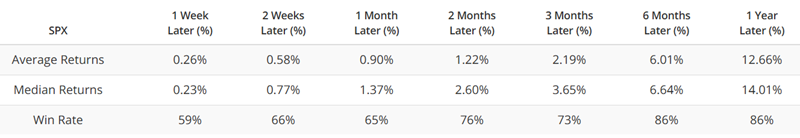
The table below summarizes S&P 500 performance following the signal dates highlighted above.
What the research tells us…
The stock market tends to perform well when buyers are aggressive, i.e., when adopting a "risk-on" posture. All three of the indicator signals highlighted above should be thought of not as "trading signals" but as "weight of the evidence." Each offers a different glimpse into investors' mindsets in terms of how willing they are to accept risk. Taken together, these signals strongly suggest that the bull market in stocks in still in force.