
Three indicators that flashed favorable signals (and one dose of reality)

Key Points
- The Economic Surprise Index recently reversed higher from a low reading, suggesting that the economy may be doing better than analyst's extremely unfavorable expectations
- ROBO Put/Call Ratio recently reached an elevated level, suggesting that bearish sentiment among small traders reached an extreme (a contrarian bullish sign)
- In addition, the SPY Breadth (50-day avg) just flashed a widely reported thrust signal; below, we take a look at twelve-month returns and the associated equity drawdowns experienced along the way
Economic Surprise Index
This Economic Surprise Index (ESI) indicator measures economic surprises for the U.S. market based on various economic indicators. It looks at the standard deviation of the actual release versus economists' estimates. When the ESI turns up from a low level, it often suggests a favorable turning point in investors' perception of the economy. The chart and tables below display all dates when the 5-day average for the ESI crossed above -50. The most recent signal occurred on 2022-08-05.
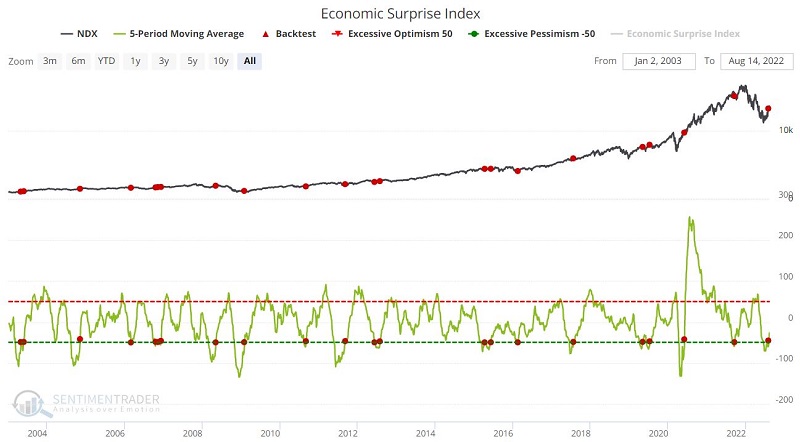
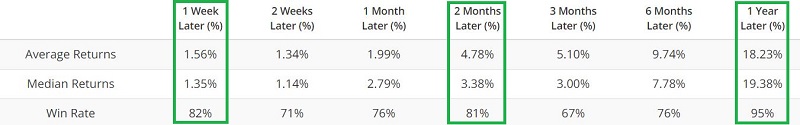
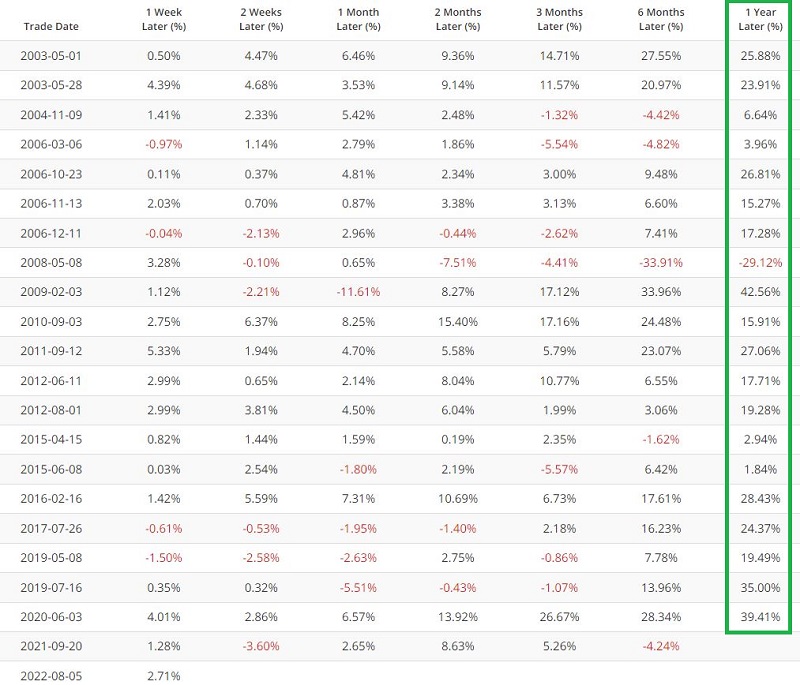
This type of indicator is best used not as a standalone indicator but as part of a "weight of the evidence" approach. If we focus on one-year returns, note that a significant decline at some point followed the May 2008 and May 2019 signals during the next twelve months (the 2008 signal was followed by the bulk of the Great Financial Crisis decline in late 2008 and early 2009 and the May 2019 signal rode the Covid panic from top to bottom and back up again).
I view the latest signal from this indicator as another brick in the (potentially) bullish wall and not as a table-pounding buy signal.
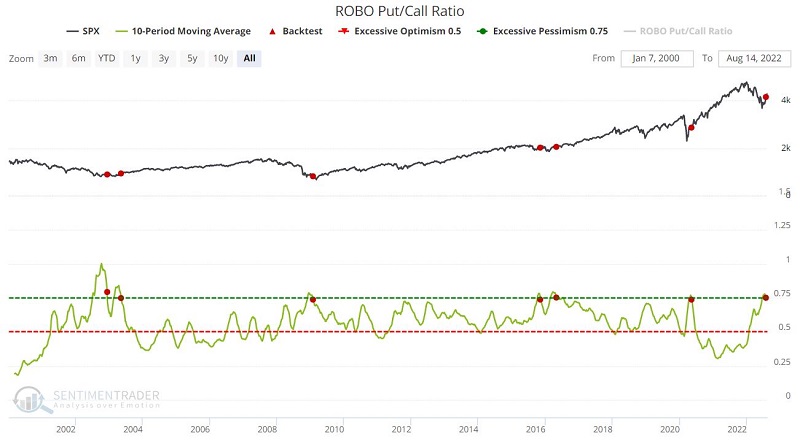
ROBO Put/Call Ratio
ROBO is an acronym we coined for Retail-Only, Buy-to-Open. This ratio looks only at buy-to-open option transactions of 10 contracts or less. As a result, this indicator measures the emotions of the smallest traders and should be interpreted in a contrary manner.
When ROBO reaches an extremely high level, it indicates that small traders are buying put options heavily - typically out of fear of a further stock market decline. When the indicator rises sharply, it is impossible to predict exactly how high it will go, so I prefer waiting for this indicator to reverse lower from a high level before deeming it favorable.
The chart and tables below display all dates when the 10-day average for ROBO crossed below 75. The most recent signal occurred on 2022-08-05.
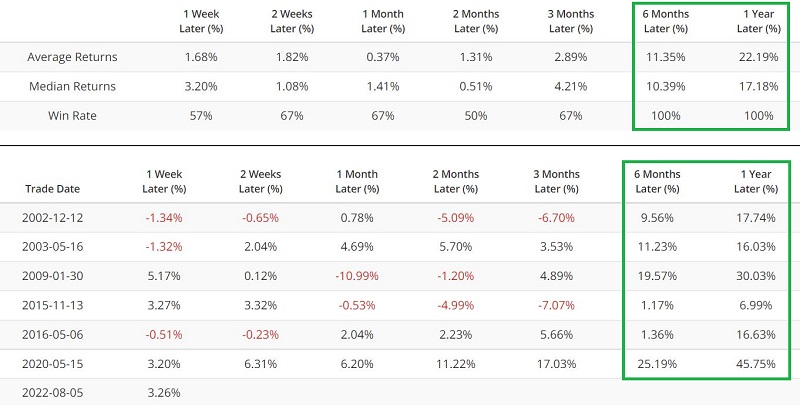
SPY Breadth (50-day Avg) - and a dose of reality
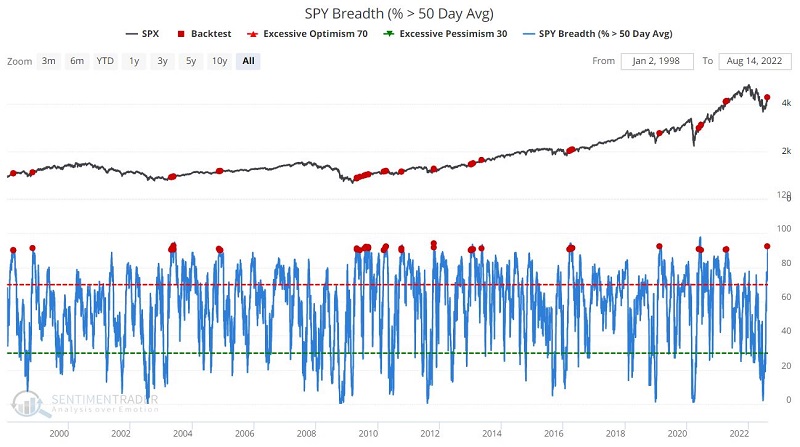
This widely followed indicator measures the percentage of S&P 500 Index constituent stocks above their respective 50-day moving averages. This is an interesting indicator in that extremely low and extremely high readings can both be favorable for stocks. Low readings indicate an oversold and often washed-out market due for a bounce (see here and here). An extremely high reading typically occurs when there is a powerful thrust higher in the market. Breath thrusts are generally one of the most reliable (though not perfect) signs of a sustainable rally.
The chart and tables below display all dates when the SPY Breath (50-day Avg) indicator crossed above 90. The 10-day average for ROBO crossed below 75. The most recent signal occurred on 2022-08-12.
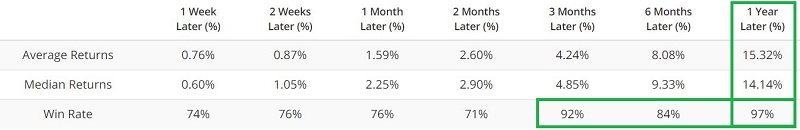
Like the other two indicators discussed above, this is the type of indicator best used not as a standalone indicator but as part of a "weight of the evidence" approach. While one-year forward returns are compelling, it is also important to look under the hood and acknowledge that a high one-year Win Rate does not guarantee easy money, low-risk, low volatility returns.
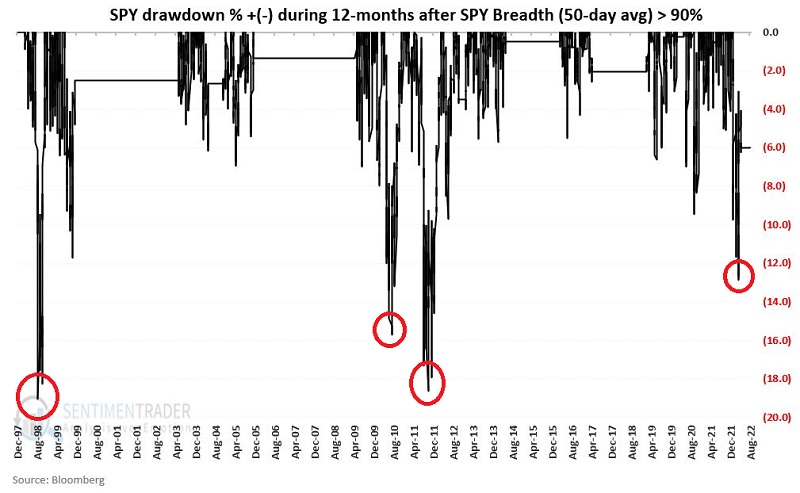
The chart below displays the cumulative % +(-) for the S&P 500 if held for twelve months after each signal, including overlaps (i.e., if a new breadth thrust signal occurs within twelve months of a previous signal, then the holding period is extended another year).
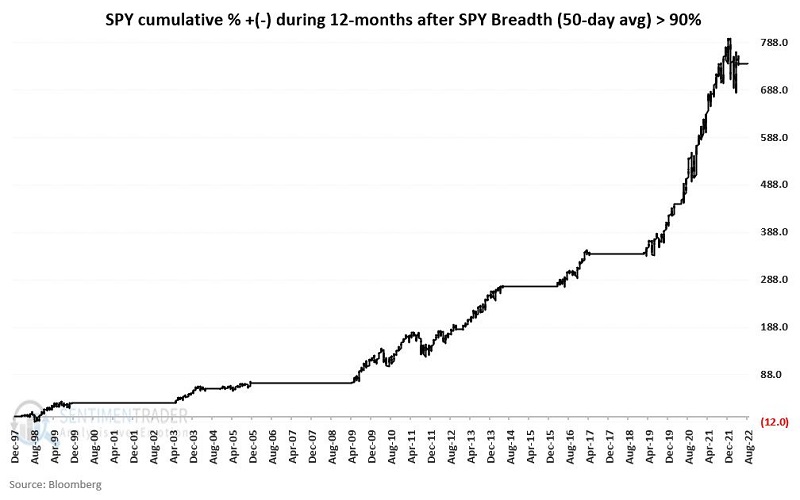
Just as importantly, the chart below displays the % drawdowns that occurred within twelve months of each signal. Note that those declines were in the -18% range on several occasions. The bottom line: to reap the benefits shown in the chart above, you would need to endure the volatility and equity declines shown below.
What the research tells us…
Using any one indicator as a standalone model provides clarity. However, it also increases risk since no one indicator is perfect. Even indicators with decidedly favorable results can exhibit significant volatility along the way (as we just saw with the SPY breath indicator). By employing a weight of the evidence approach, an investor can get a better sense of when the market may be turning "for real."
The upside reversal in the Economic Surprise Index suggests that investors' perceptions regarding the economy may take a turn for the better. The ROBO put/call signal tells us that small traders reached an excessively bearish extreme - which is typically a favorable contrarian signal for stocks. Finally, the SPY 50-day breath indicator just touched a level that has typically signaled better days ahead for stocks - albeit not without occasional drawdowns large enough to shake out low commitment investors.