
Three for the bulls...

Key points
- A variety of trend, risk on/risk off, and sentiment indicators have flashed favorable "continuation" signals recently
- While none of those detailed below should be used as a standalone trading model, taken together, they add meaningful weight to the favorable side of the "weight of the evidence" ledger
- Before getting too enthralled, please note that Part II of this two-part series is titled "Three for the Bears"
A trend-following confirmation signal fires again
Our Percentage of sectors with a 50-day average > 200-day average indicator measures the percentage of S&P 500 sectors with a 50-day moving average above their 200-day moving average. The chart below highlights all dates when this indicator crossed above 90. This signal tends to serve as a useful "continuation" signal.
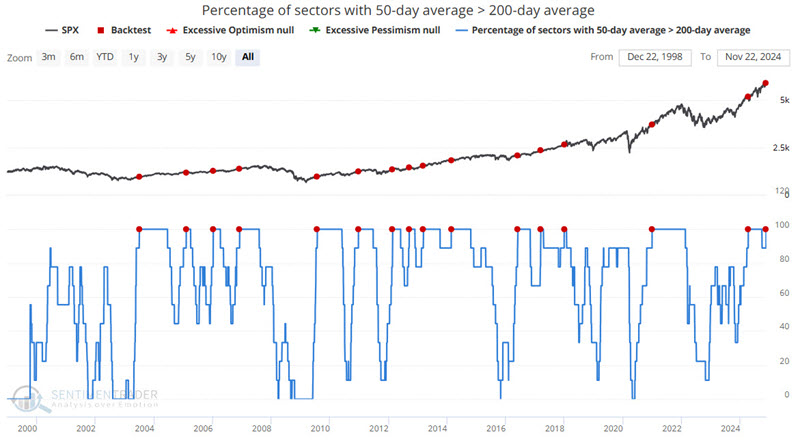
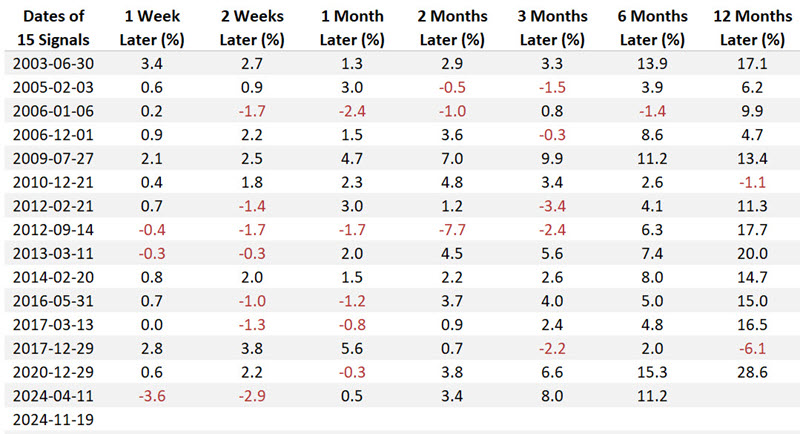
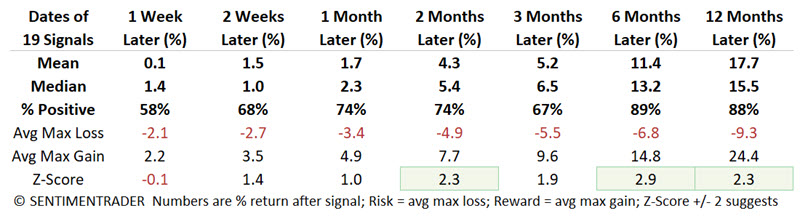
The table below displays signal-by-signal performance for the S&P 500. The most recent signal was fired on 2024-11-19.
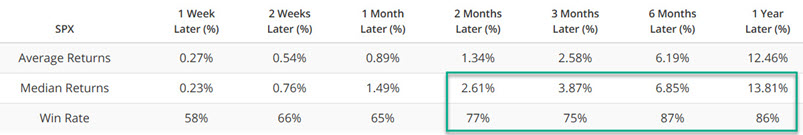
The table below summarizes post-signal performance for the S&P 500.
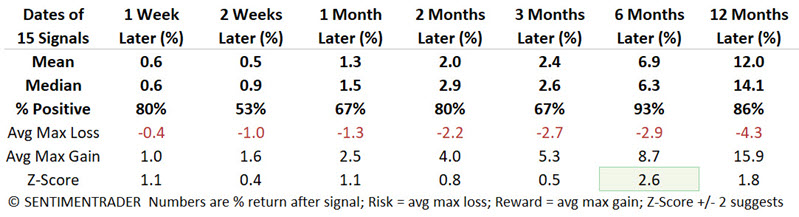
This is a classic "weight of the evidence" indicator. The occurrence of a new signal never "guarantees" that the market will continue to head higher. Still, the numbers above suggest that that is the way to bet over the next six to twelve months.
High beta versus high quality gives another risk on signal
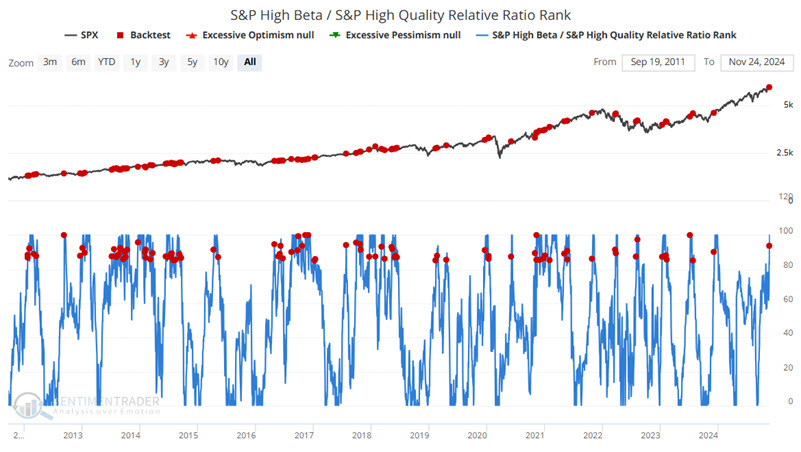
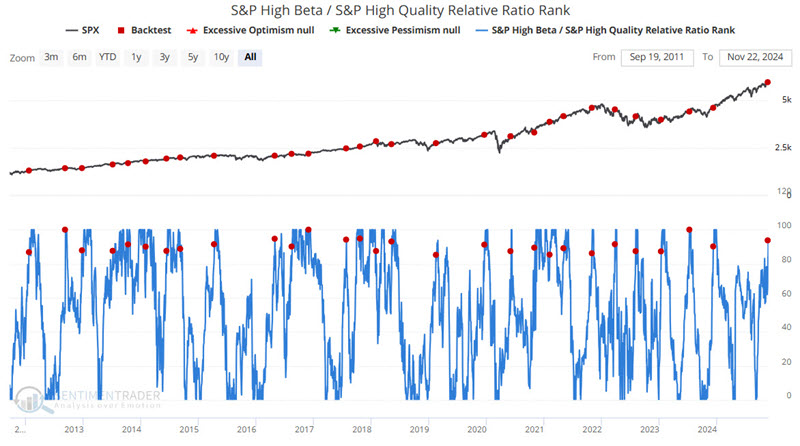
Our S&P High Beta / S&P High-Quality Relative Ratio Rank indicator compares the performance of an index of high beta (volatile) stocks versus an index of high quality (typically low volatility) stocks. This indicator shows the ratio relative to its range over the past four months. When the relative ratio is high, investors show risk-on behavior. When the ratio drops to a low level, they exhibit risk-off behavior.
The chart below highlights all dates when this indicator crossed above 85. The most recent signal was fired on 2024-11-21.
The table below summarizes S&P 500 performance following all signals, including a number of overlapping signals.
To "thin the herd" of signals a bit, the chart below highlights only those signals that occur for the first time in three months.
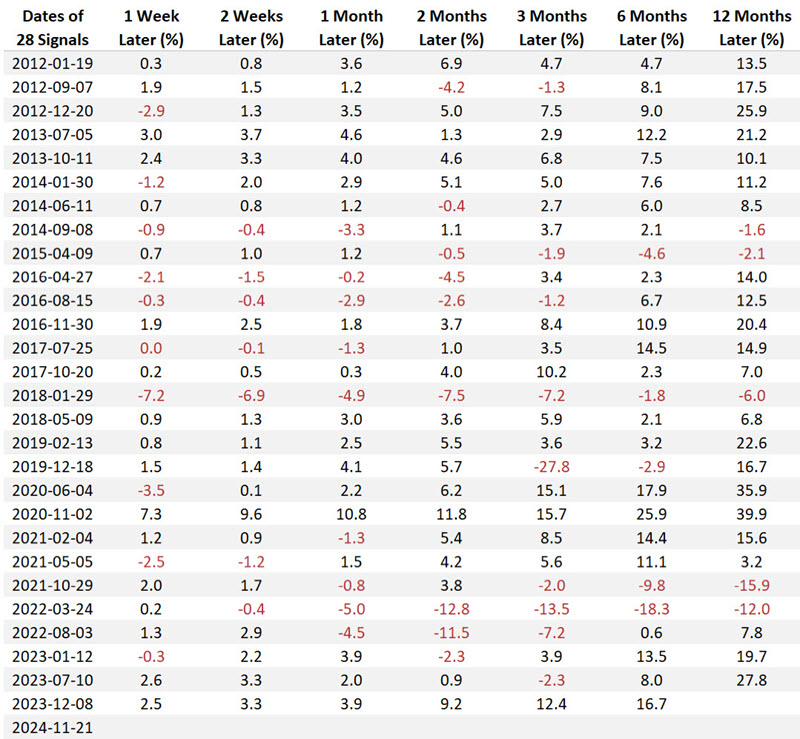
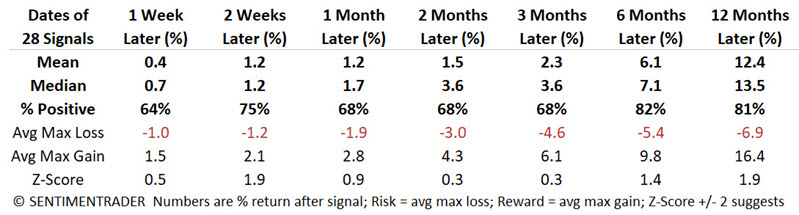
The tables below display subsequent S&P 500 performance following the first signal from this indicator in three months.
This is another example of a signal that should not be used as a standalone trading model, but which does offer weight to the favorable side of the stock market ledger.
Option traders offer a sentiment clue
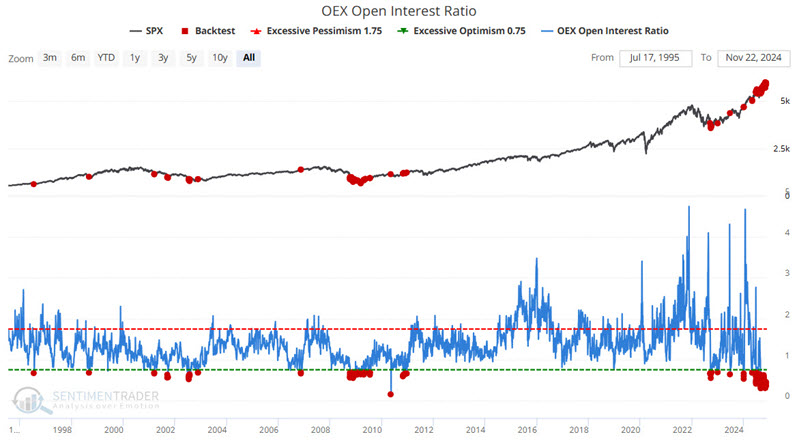
Next, let's look at our OEX Open Interest Ratio indicator. OEX is shorthand for the S&P 100, an index of the 100 largest companies in the S&P 500. Open interest is defined as the total number of option contracts outstanding. Open interest is increased by opening transactions and decreased by closing transactions. Someone buying a call to open (a bullish position) would increase open interest by one, and someone selling a call to open (a bearish position) would also increase open interest by one.
The open interest indicator takes the total put open interest and divides it by total call open interest - as more put contracts are opened (and/or call contracts closed), the indicator rises; as put contracts are closed (and/or call contracts opened), the indicator falls.
The chart below highlights all dates when this indicator crossed below 0.70, including overlaps. The most recent signal was fired on 2024-11-21.
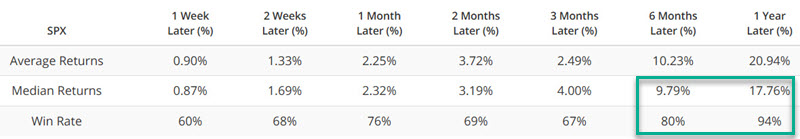
The table below summarizes S&P 500 performance following all signals, including a number of overlapping signals.
To once again "thin the herd" of signals, the chart below highlights only those signals that occur for the first time in three months.
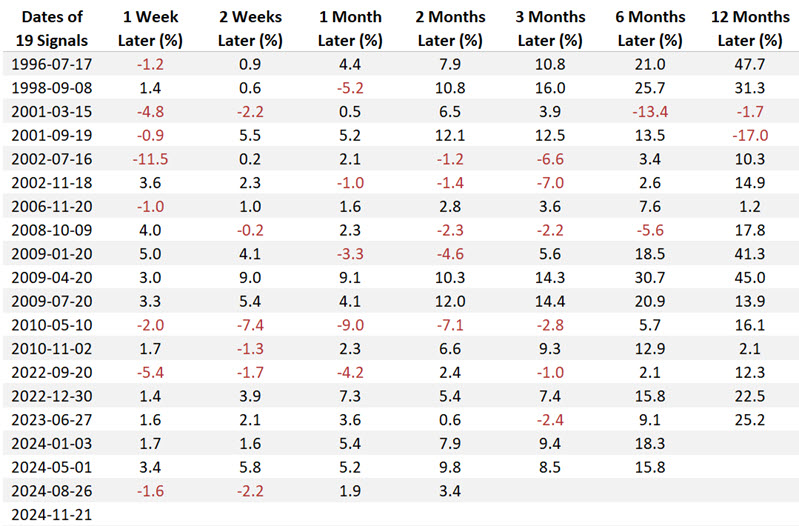
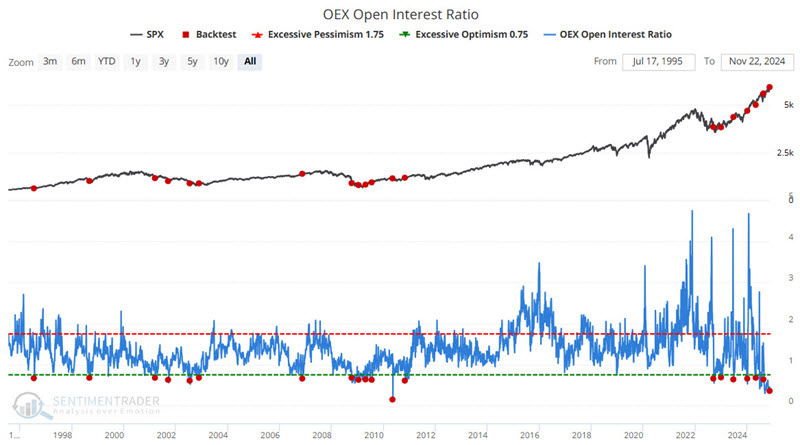 The tables below display subsequent S&P 500 performance following the first signal from this indicator in three months.
What the research tells us…
It is helpful to remember my three rules about indicators:
- Not every indicator is meant to serve as a standalone trading system
- Not every "squiggle" of every indicator value "means something"
- Not every "signal" from every indicator is meant to be an "automatic" buy or sell signal
These rules apply well to the two indicators highlighted above. The recent signals do not guarantee that the stock market will continue to rally or that the S&P500 will automatically be trading higher six to twelve months from now. However, they do add significant weight to the favorable side weight of the evidence ledger.
All that said, remember to pay attention to Part II, titled "...Three for the Bears."