
Three "continuation" signals still flashing green

Key points
- Indicators are best used as weight of the evidence rather than as standalone trading models
- Weak seasonality is an overarching concern in the near-term
- Short-term concerns aside, a handful of indicators have recently pointed to better times ahead
- Dumb Money Confidence, OEX Open Interest Ratio, and the % of S&P 1500 stocks with a 2-day RSI < 30 have all given favorable signals
The threat of seasonal weakness overhangs the market
As I have written about lately, the concern of seasonal weakness presently overhangs the stock market (see here, here, and here). As another reminder, the chart below displays the annual seasonal trend for the S&P 500 Index.
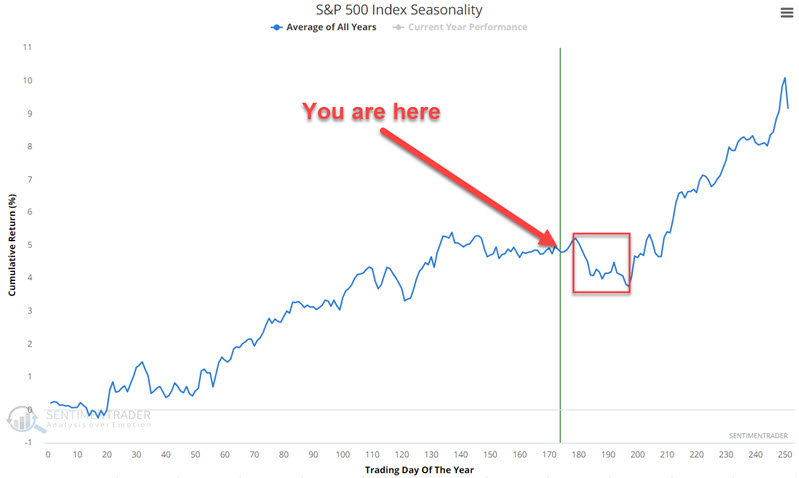
Two reminders:
- The bad news is contained in the chart above that suggests potential weakness for the market in the month ahead
- The good news is that seasonality is "climate, not weather" - so there is no guarantee of lower prices in September and/or October
Will the market succumb to more weakness in the month or so ahead? The reality is that it is impossible to predict with any certainty. So, the real question for investors and traders is, "What should investors and traders do about this possibility?" The list of possible responses is long and can range from:
- A long-term investor might choose to do nothing, i.e., gird their loins and prepare to ride out any short-term decline in hopes of better days ahead
- To an investor who chooses to hedge some of their portfolio, perhaps by either raising some cash or buying stock index put options
- To a short-term trader who might establish a short position in stock index futures or an inverse stock index ETF
This piece will highlight a recent few indicator readings that might comfort investors in the first category above, i.e., long-term investors looking for reassurance that the market will ultimately work its way higher.
Dumb Money Confidence as a trend-following indicator
Intuitively, it is a potential negative for the stock market when Dumb Money Confidence reaches a high extreme. Interestingly, however, while it is often wrong at the extremes, it can be right in the middle - particularly when it is trending higher.
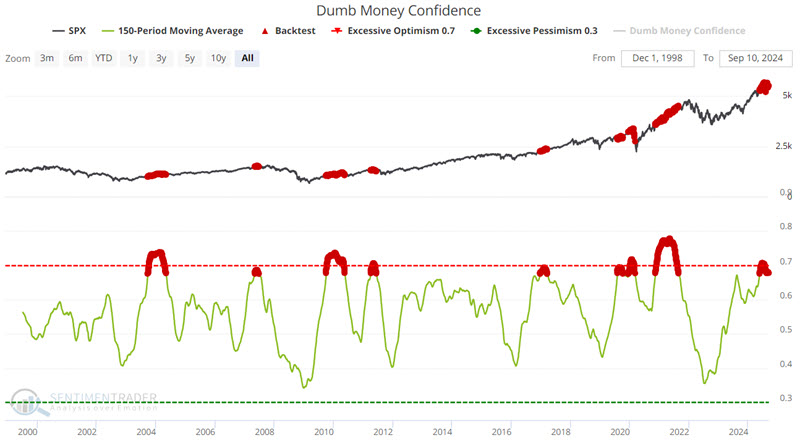
The chart below highlights all dates when the 150-day moving average for our Dumb Money Confidence Index is above 0.67.
The table below summarizes subsequent S&P 500 performance.
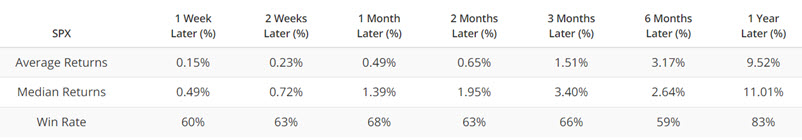
This is clearly not a "world-beater" trading signal. However, note that the 12-month Win Rate of 83% and Median Return of +11.01% outperforms the 12-month Win Rate for all other days (i.e., when the 150-day MA is below 0.67), which is only 72%, with a Median Return of +9.4%.
Again, this does not constitute a "buy" signal. However, it is a favorable piece of evidence for the good side of the weight of the evidence ledger. However, note that once the 150-day MA drops back below 0.67, the potential for a meaningful decline or correction increases.
S&P 100 option traders are sending a message
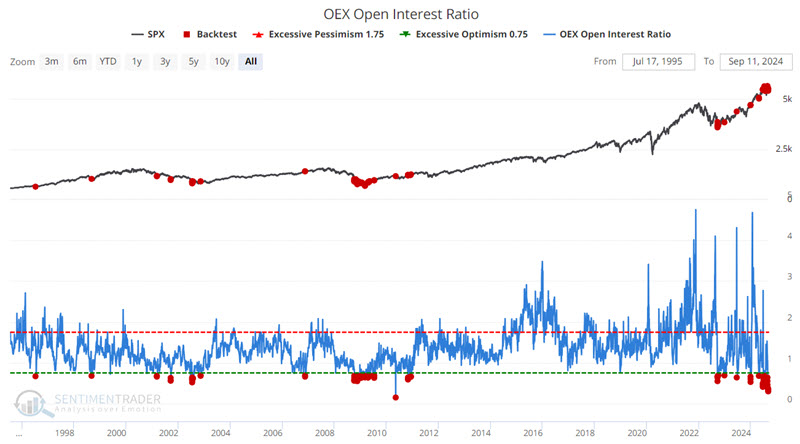
The chart below highlights all dates when the OEX Open Interest Ratio was below 0.70. This indicates excessive bearishness among options traders on this particular large-cap index (S&P 100, i.e., the largest cap stocks among the S&P 500 constituents).
The table below summarizes subsequent S&P 500 Index performance.
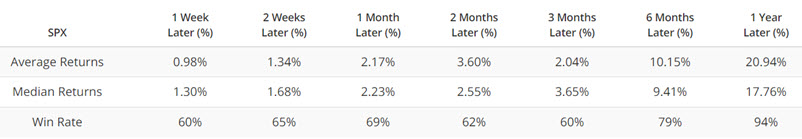
Like the Dumb Money Confidence signal above, this is not intended as a standalone trading model or signal. The critical thing to note here is the 94% Win Rate and 17.76% Median Return for twelve months after previous signals. This lends another item to the favorable side of the weight of the evidence ledger. One caveat is that the 2001-09-19 signal saw the S&P 500 -16.8% lower twelve months later (although it did rally +13.5% during the six months immediately following the 2001-09-19 signal).
A high % of S&P 1500 Index stocks are showing a low RSI - within the context of a bull market
Let's look at a decent "buy the pullback in an uptrend" type of indicator.
The chart below highlights all dates when:
- The % of S&P 1500 Index stocks with a 2-day RSI below 30% crossed above 70%
- And the S&P 500 Index was above its 150-day moving average
The first criteria naturally tend to occur when the market experiences a meaningful pullback and many stocks reach an oversold reading. The second criteria filters for an overall uptrend in the market (i.e., the most followed index above a long-term moving average).
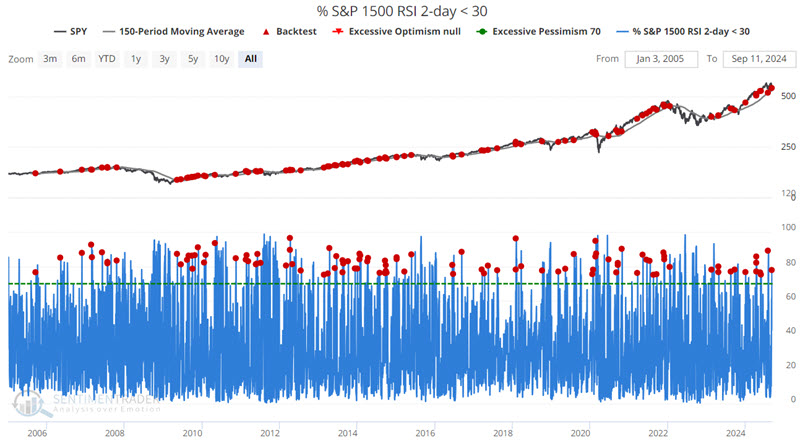
As you can see in the chart above, these signals are common in an ongoing bull market.
The table below summarizes subsequent S&P 500 Index performance.
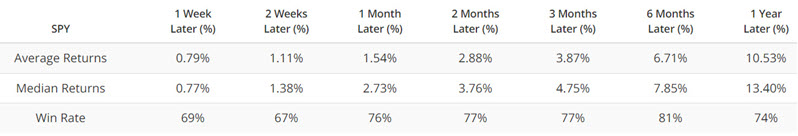
As an aside, this type of signal can benefit investors with cash to invest. It lets them objectively put that cash to work at a potentially good time, i.e., when the odds favor a market rebound.
What the research tells us…
Pullbacks in an uptrend are normal. The problem is that in real-time, it is often difficult to determine if a given pullback is "normal" or "the start of something bigger." It is unhelpful that every pullback - normal or otherwise - is accompanied by gloom, doom, and dire predictions in the financial press and social media. The purpose of using indicators and models is to help us to ignore the "noise" and focus on the probabilities. With the caveat that each of the three indicators above is far from perfect in generating signals, they presently suggest that the current pullback is normal and that the historical probabilities favor a rebound sometime in the year ahead.