
Thoughts on playing natural gas with options

Key points
- Dean highlighted a rare bullish signal for natural gas - and seasonality is about to flip from unfavorable to favorable
- None of this guarantees a rally in natural gas, but it does point to a potential opportunity
- The purest non-futures play on natural gas is ticker UNG; however, Dean highlighted natural gas-related stocks SWN, EQT and RRC
- Options allow traders to make specific dollar-risk bets with limited risk
Factors for options traders to consider
Price is always the most critical factor. Any trader making a bullish bet on natural gas must acknowledge and accept the fact (and associated risks) that they are entering a counter-trend trade, which typically entails a higher degree of risk than trading in the direction of the current primary trend.
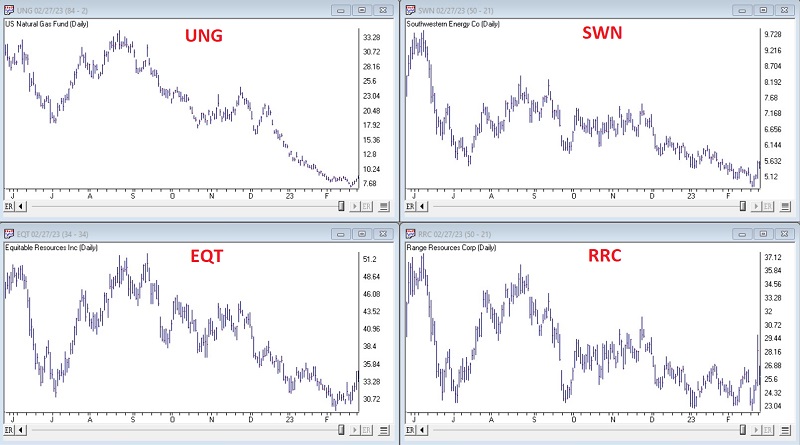
The chart below (courtesy of AIQ TradingExpert) displays the daily charts for the four tickers under consideration. All were beaten down in the last six months and bounced in the last week.
Another essential factor to consider is the amount of options trading taking place. The table below (all subsequent screenshots are courtesy of Optionsanalysis) displays the options trading volume for the four tickers.
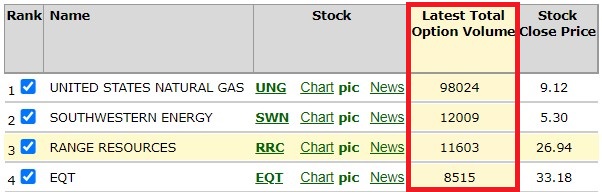
At first blush, UNG looks like the most obvious play, thanks to its much higher trading volume and the fact that it is a more pure play on the price of natural gas. However, the primary advantage of greater options trading volume is the generally tighter bid/ask spreads. Because options tend to be low in price, wide bid/ask spreads can mean a significant difference on a percentage basis.
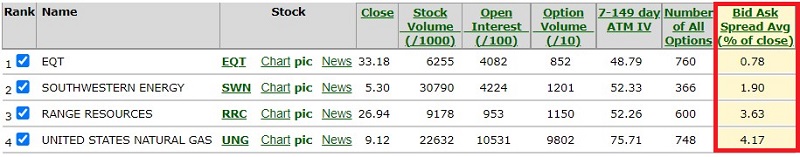
In this case, however, if we look more closely, there is a surprise. The screenshot below displays each ticker's average bid/ask spread for options. Currently, UNG has, by far, the highest bid/ask spreads. Also surprising is that ticker EQT has the tightest average bid/ask spreads despite the lowest overall options trading volume.
So why does heavily traded UNG show the widest bid/ask spreads? It is most likely related to the volatility of the securities' price in general and to the implied volatility of the options on UNG.
Implied options volatility indicates how much time premium is built into option prices
First, a quick-and-dirty lesson in implied volatility. The theoretical price of an option is calculated by passing the following variables to an option model:
- Its strike price
- The price of the underlying security
- Time left until option expiration
- Risk-free interest rate
- Volatility
The model will then use these variables to calculate a theoretical option price.
More beneficial to actual trading is to pass the first four "known" variables above to the model, then also pass the actual price of the option in the marketplace to the model, and then let the model solve for "Volatility." This output is referred to as "implied volatility," i.e., the volatility value implied based on the current market price for the option.
Why does this matter? If we compare the current level of implied volatility to the historical range for that particular security, we can assess whether options are "cheap," "expensive," or somewhere in between. High IV readings mean an above-average amount of time premium built into the option prices, i.e., they are "expensive." Low IV readings indicate a below-average amount of time premium built into the option prices, i.e., they are "cheap."
IV levels can be critically important in options strategy selection and trade management. Ideally, a trader will buy premium when IV is low and sell premium when IV is high. Likewise, if you buy premium when IV is high, then if IV subsequently declines the option you purchased may lose a significant amount of time premium regardless of the price action of the security.
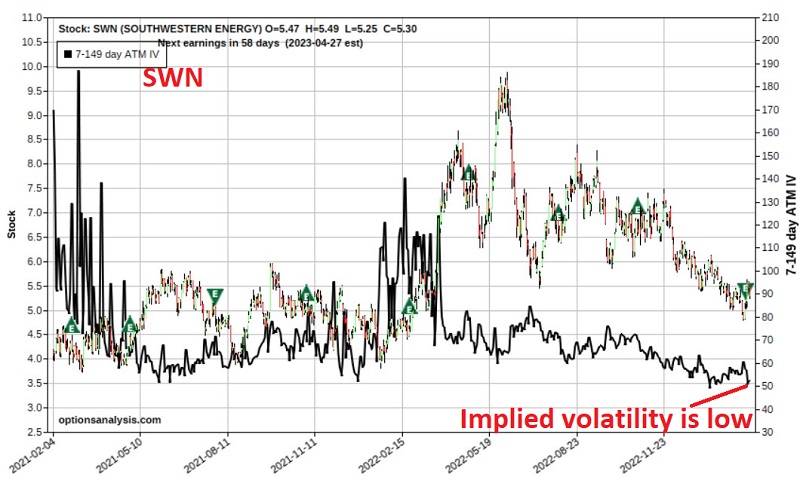
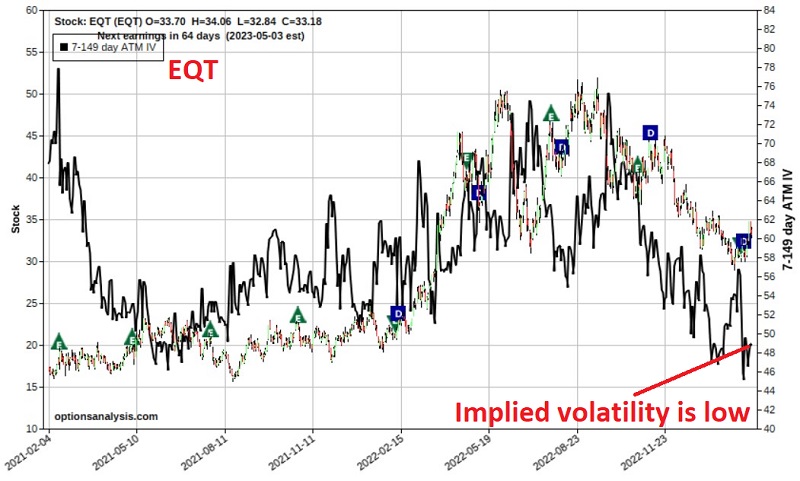
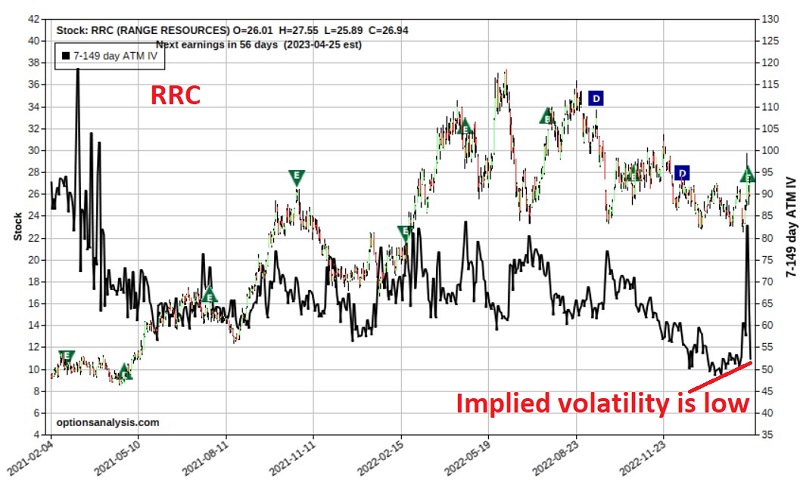
Current IV status for natural gas-related securities
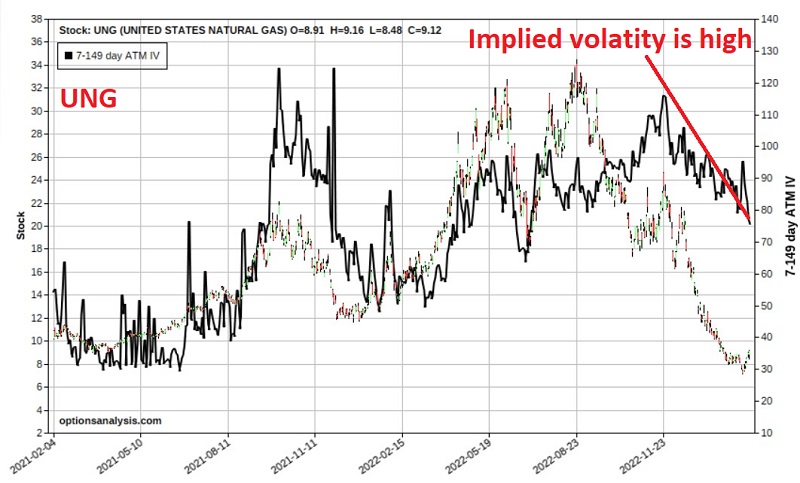
The charts below display a price chart for each security and IV (the black line). What is interesting to note is that IV for UNG is relatively high (i.e., option premiums are "expensive"). In contrast, IV for the three individual stocks is relatively low (i.e., options are "cheap"). This partly explains why UNG options presently have wide bid/ask spreads (market makers are forcing wider spreads to compensate them for taking the risk of writing options on this highly volatility security). This also suggests that individual stocks may offer better opportunities if we are looking simply to buy a call option in hopes of a natural gas rally.
Looking for long calls in the individual stocks
Because implied volatility for UNG is high, we will exclude that ticker as we look for opportunities to buy long-call options. As shown in the screenshot below, we will apply the following parameters:
- Stock price > $1
- Option volume > 10
- Option open interest > 100
- Days to expiration > 60 days and < 150 days
- Option delta > 40
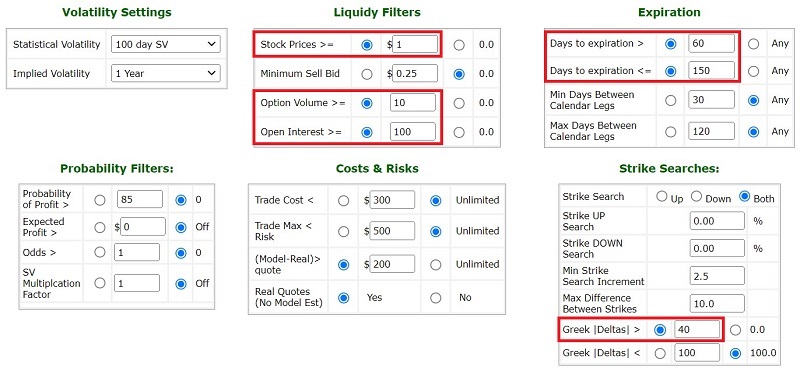
Option delta is arbitrarily set to 40 or higher to avoid buying options that are far out of the money. Note that delta is a Greek option variable that can be viewed in different ways. A delta of 40 suggests that the position is roughly equivalent to holding 40 shares of the underlying security. Delta also offers a rough approximation of the probability that the option will expire in the money (i.e., the likelihood that the underlying security price will be above the option strike price at option expiration).
The screenshot below displays the output screen with results sorted by "Gamma." Gamma is another Greek option variable that tells us how many Deltas the option will gain if the underlying security rises by $1 in price.
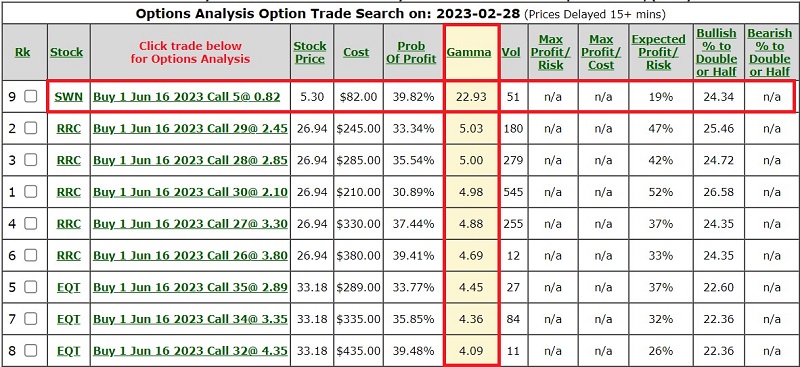
A call option on SWN
According to the parameters set - and with an emphasis on high gamma, the top trade involves:
- Buying the SWM June16 2023 5 call @ $0.82
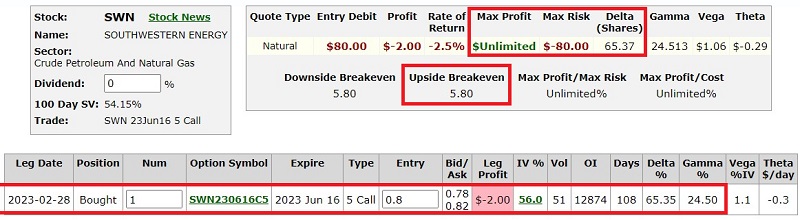
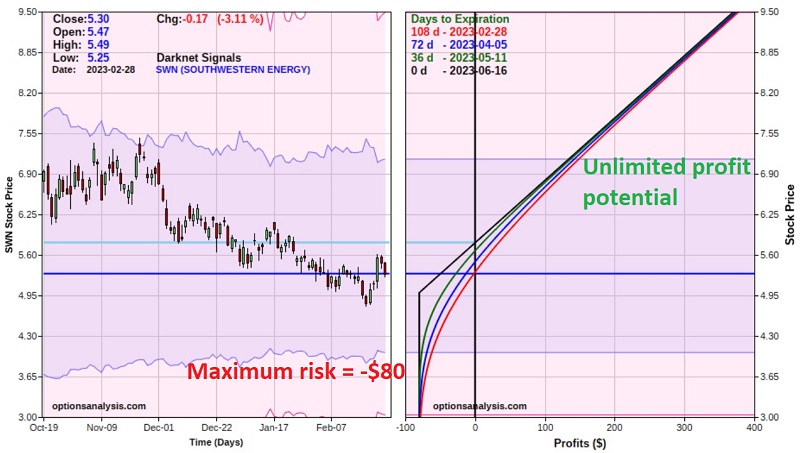
The screenshot below displays the particulars for this trade, and the chart below shows the risk curves (i.e., the expected $P/L at a given price for SWN as of four different dates leading up to options expiration).
Things to note:
- The option has 108 days left until expiration, so there is plenty of time for SWN to make the hoped-for move higher
- The cost to enter the trade - and the maximum risk - $80 for a 1-lot (this is based on the assumption that we use a limit order at the midpoint of the bid/ask spread and that we can get filled at that price)
- A 1-lot has a delta of 65, meaning this position is roughly equivalent to holding 65 shares of SWN (however, to buy 65 shares of SWN would cost $345 instead of $80 to buy the call)
- The break-even price on this trade is $5.80 a share for SWN. Above that price, the option will gain point-for-point with the stock
Thoughts on position management
If SWN does, in fact, rally strongly, a trader must have some plan for taking a profit. If the stock rallies back to the January high of $6.13 a share, the option position will show an approximate open profit of $40 to $60, depending on how soon that price is hit.
If the stock rallies back to the November 2022 high of $7.48 a share, the option position will show an approximate open profit of $175 to $190, depending on how soon that price is hit.
Once a chosen target is hit, a trader can either sell and cash out or adjust the trade to lock in a profit and hold out for more profit potential. One example would be selling the original call and buying a new, less expensive call option with a strike price closer to the price of SWN shares at that time.
On the downside, a trader must decide if they are willing to risk the entire $80 per 1-lot or if they might cut their loss if SWN takes out the recent low at $4.79.
What the research tells us…
As always, the trading discussion above is for educational purposes and not necessarily a specific recommendation. There are many assumptions involved in the process above. For example, one must assume that natural gas (and the related stocks) will reverse meaningfully from their recent - and arguably still ongoing - decline.
Likewise, there is no guarantee that the SWN example trade above will show a gain, nor will it necessarily be the "best" trade to make once we can look back with the benefit of hindsight. One of the other stocks might significantly outperform SWN. However, in considering a variety of potential trades, we selected specific volume, bid-ask, implied volatility, and delta parameters intended to put the odds on our side as much as possible. The SWN example was the "best" choice based on those parameters.