
This Week's Breadth Indicators for the Hang Seng Index

Key Points
- The percentage of Hang Seng Index components trading above their 200-day moving average (DMA) has remained above 70% for 113 consecutive days
- The McClellan Oscillator has completed a cycle from extreme pessimism to extreme greed
- Short-term indicators are overbought, with a year-long breadth lock-up
From "Uninvestable" to "Fear of Missing Out (FOMO)"
The Shanghai Composite Index (SHCOMP) has drawn growing attention from global assets, and alongside it, the Hang Seng Index (HSI) stands out among major global stock indices in 2025-particularly driven by capital inflows from the revaluation of the technology and AI sectors-the narrative in Bloomberg and Financial Times headlines has shifted. The focus now centers on "fear of missing out (FOMO)" and anxiety over the "underweight risk" of Chinese assets.
Nevertheless, recent market volatility has rekindled concerns among conservative media outlets. Debates over "policy sustainability" and "geopolitical risk premium" have led to divergent capital flows.
Currently, more than 70% of Hang Seng Index components trade above their 200-day moving average (a key long-term trend indicator), and this proportion has persisted for an extended period-113 consecutive days and counting.Related Backtest Click Here.
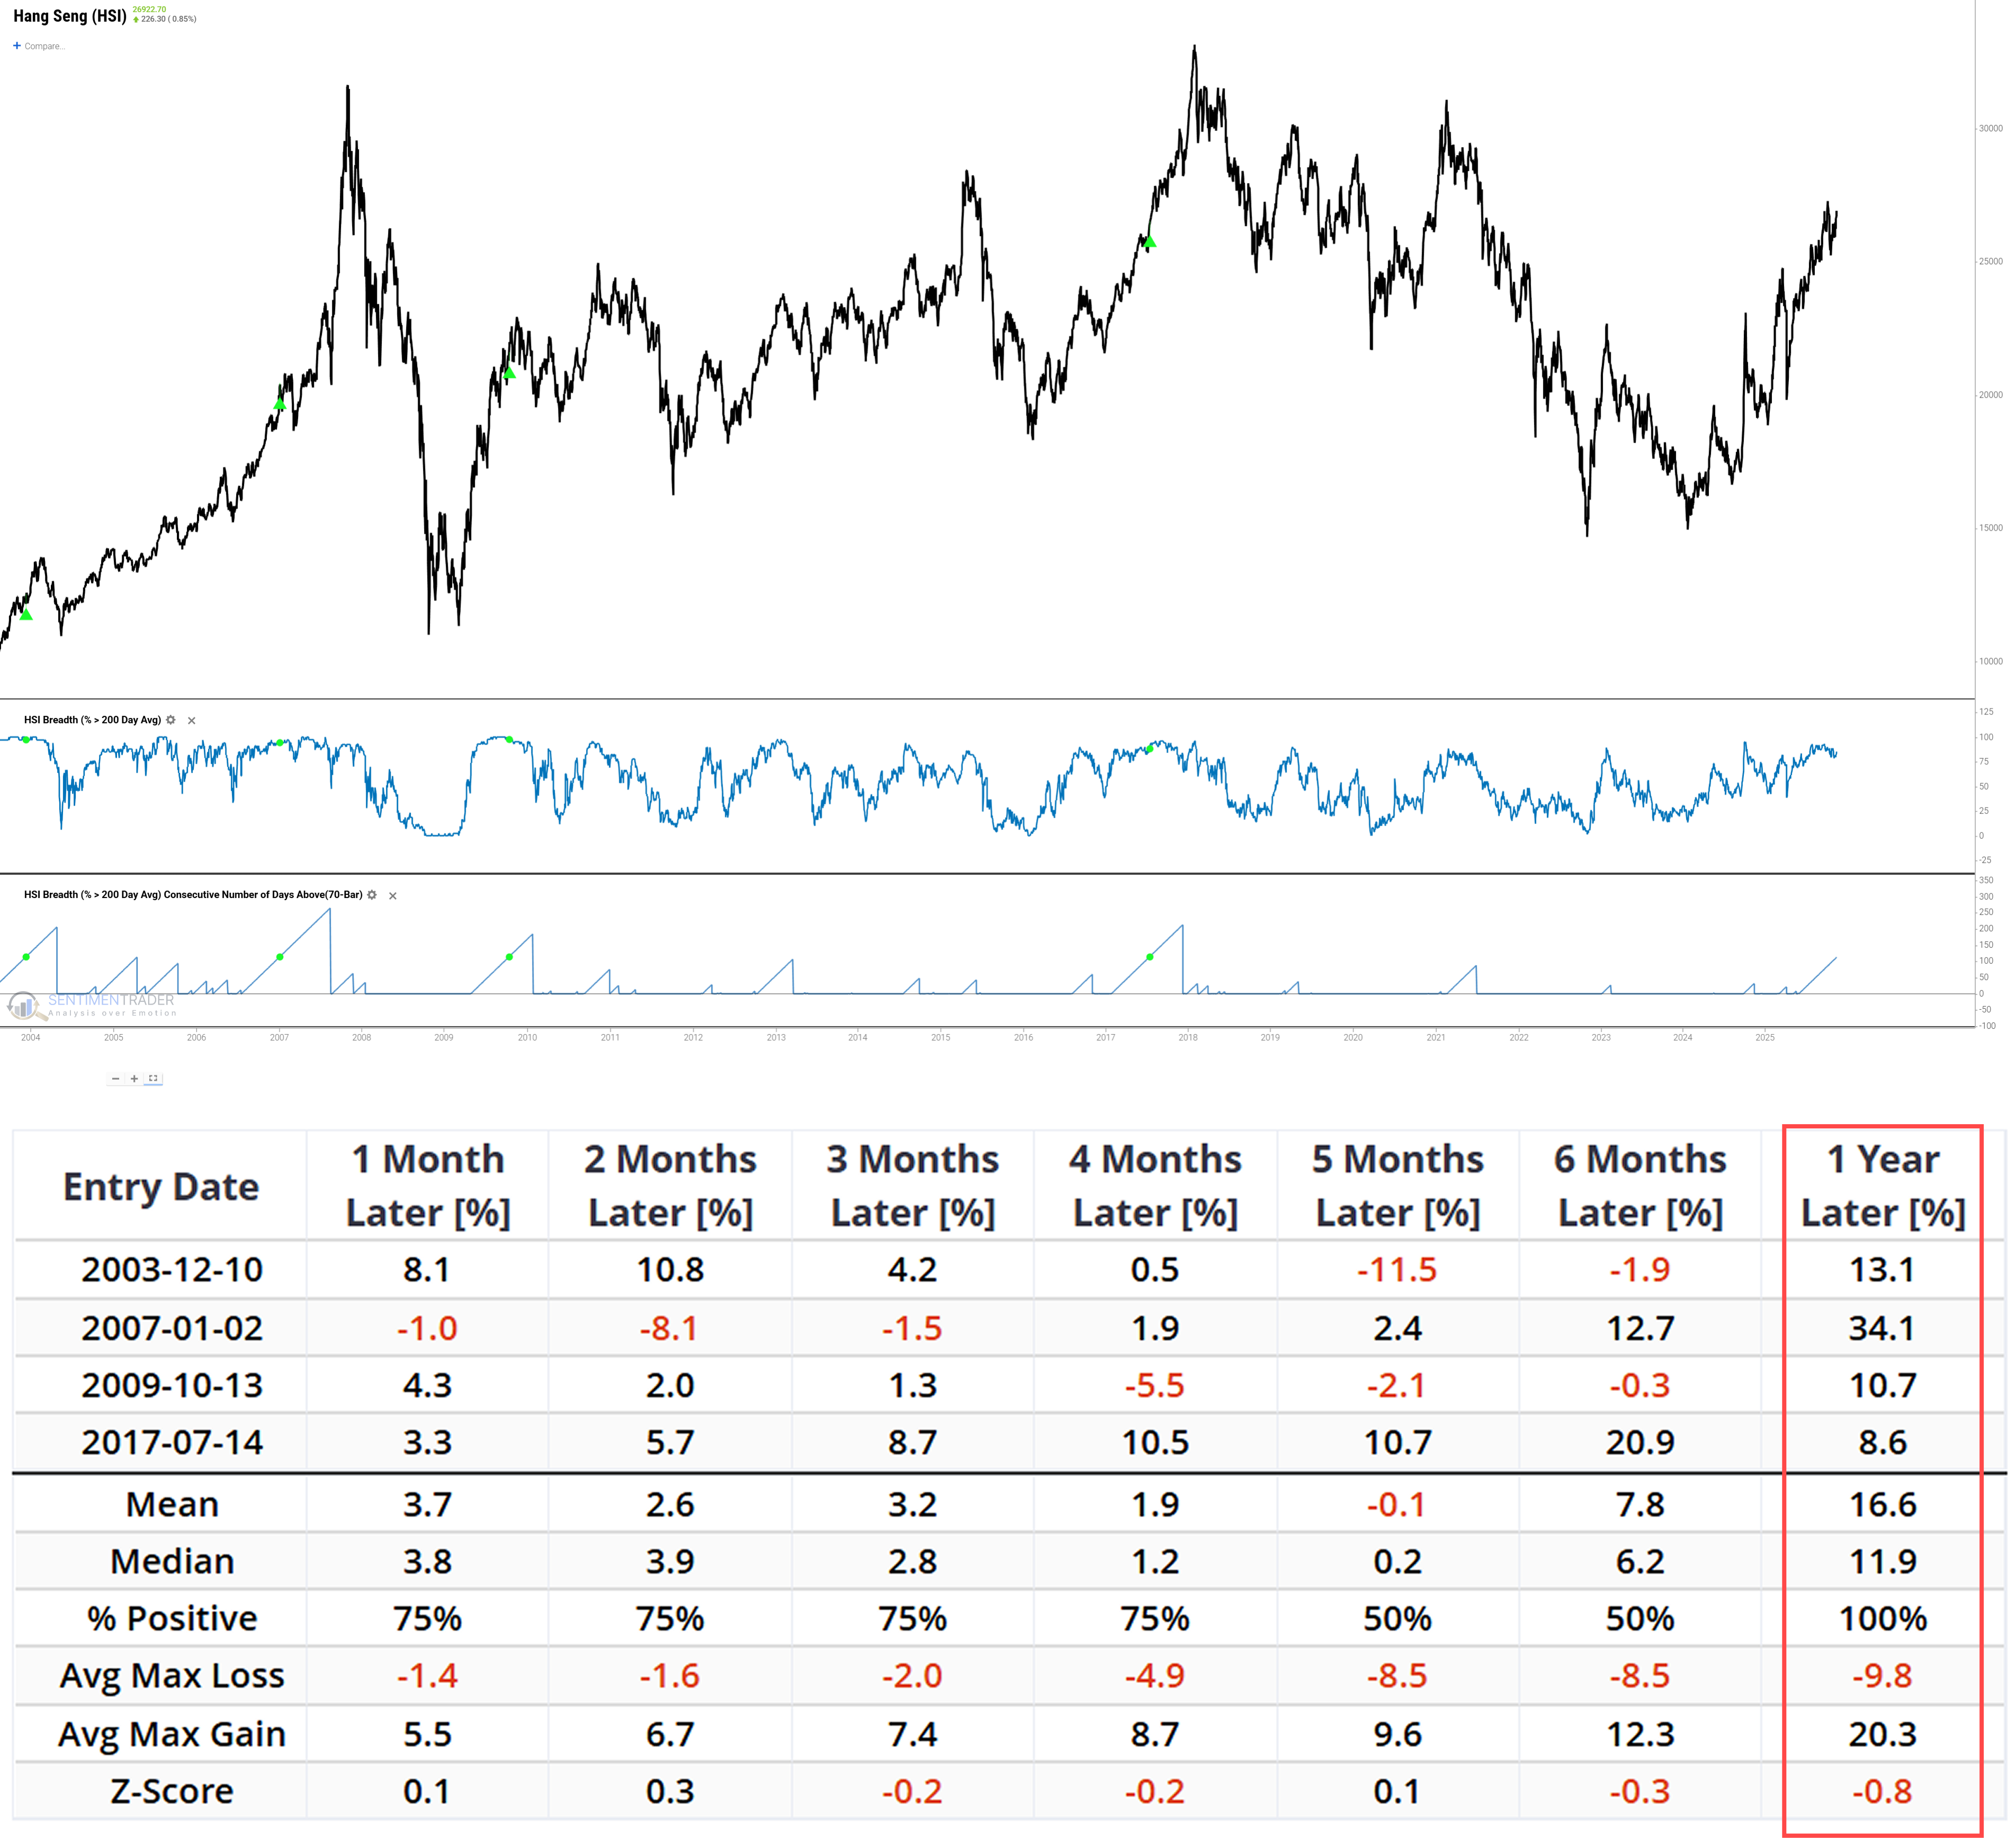
Backtest results show this phenomenon is extremely rare. Since 2000, similar prolonged strength has occurred only 4 times. Following each signal trigger, the market posted positive returns over the subsequent 1-month, 2-month, and 3-month periods. The average 1-year return reached as high as +16.6% with a perfect win rate. However, this rare, low-frequency signal should be viewed as a market narrative rather than a definitive entry signal.
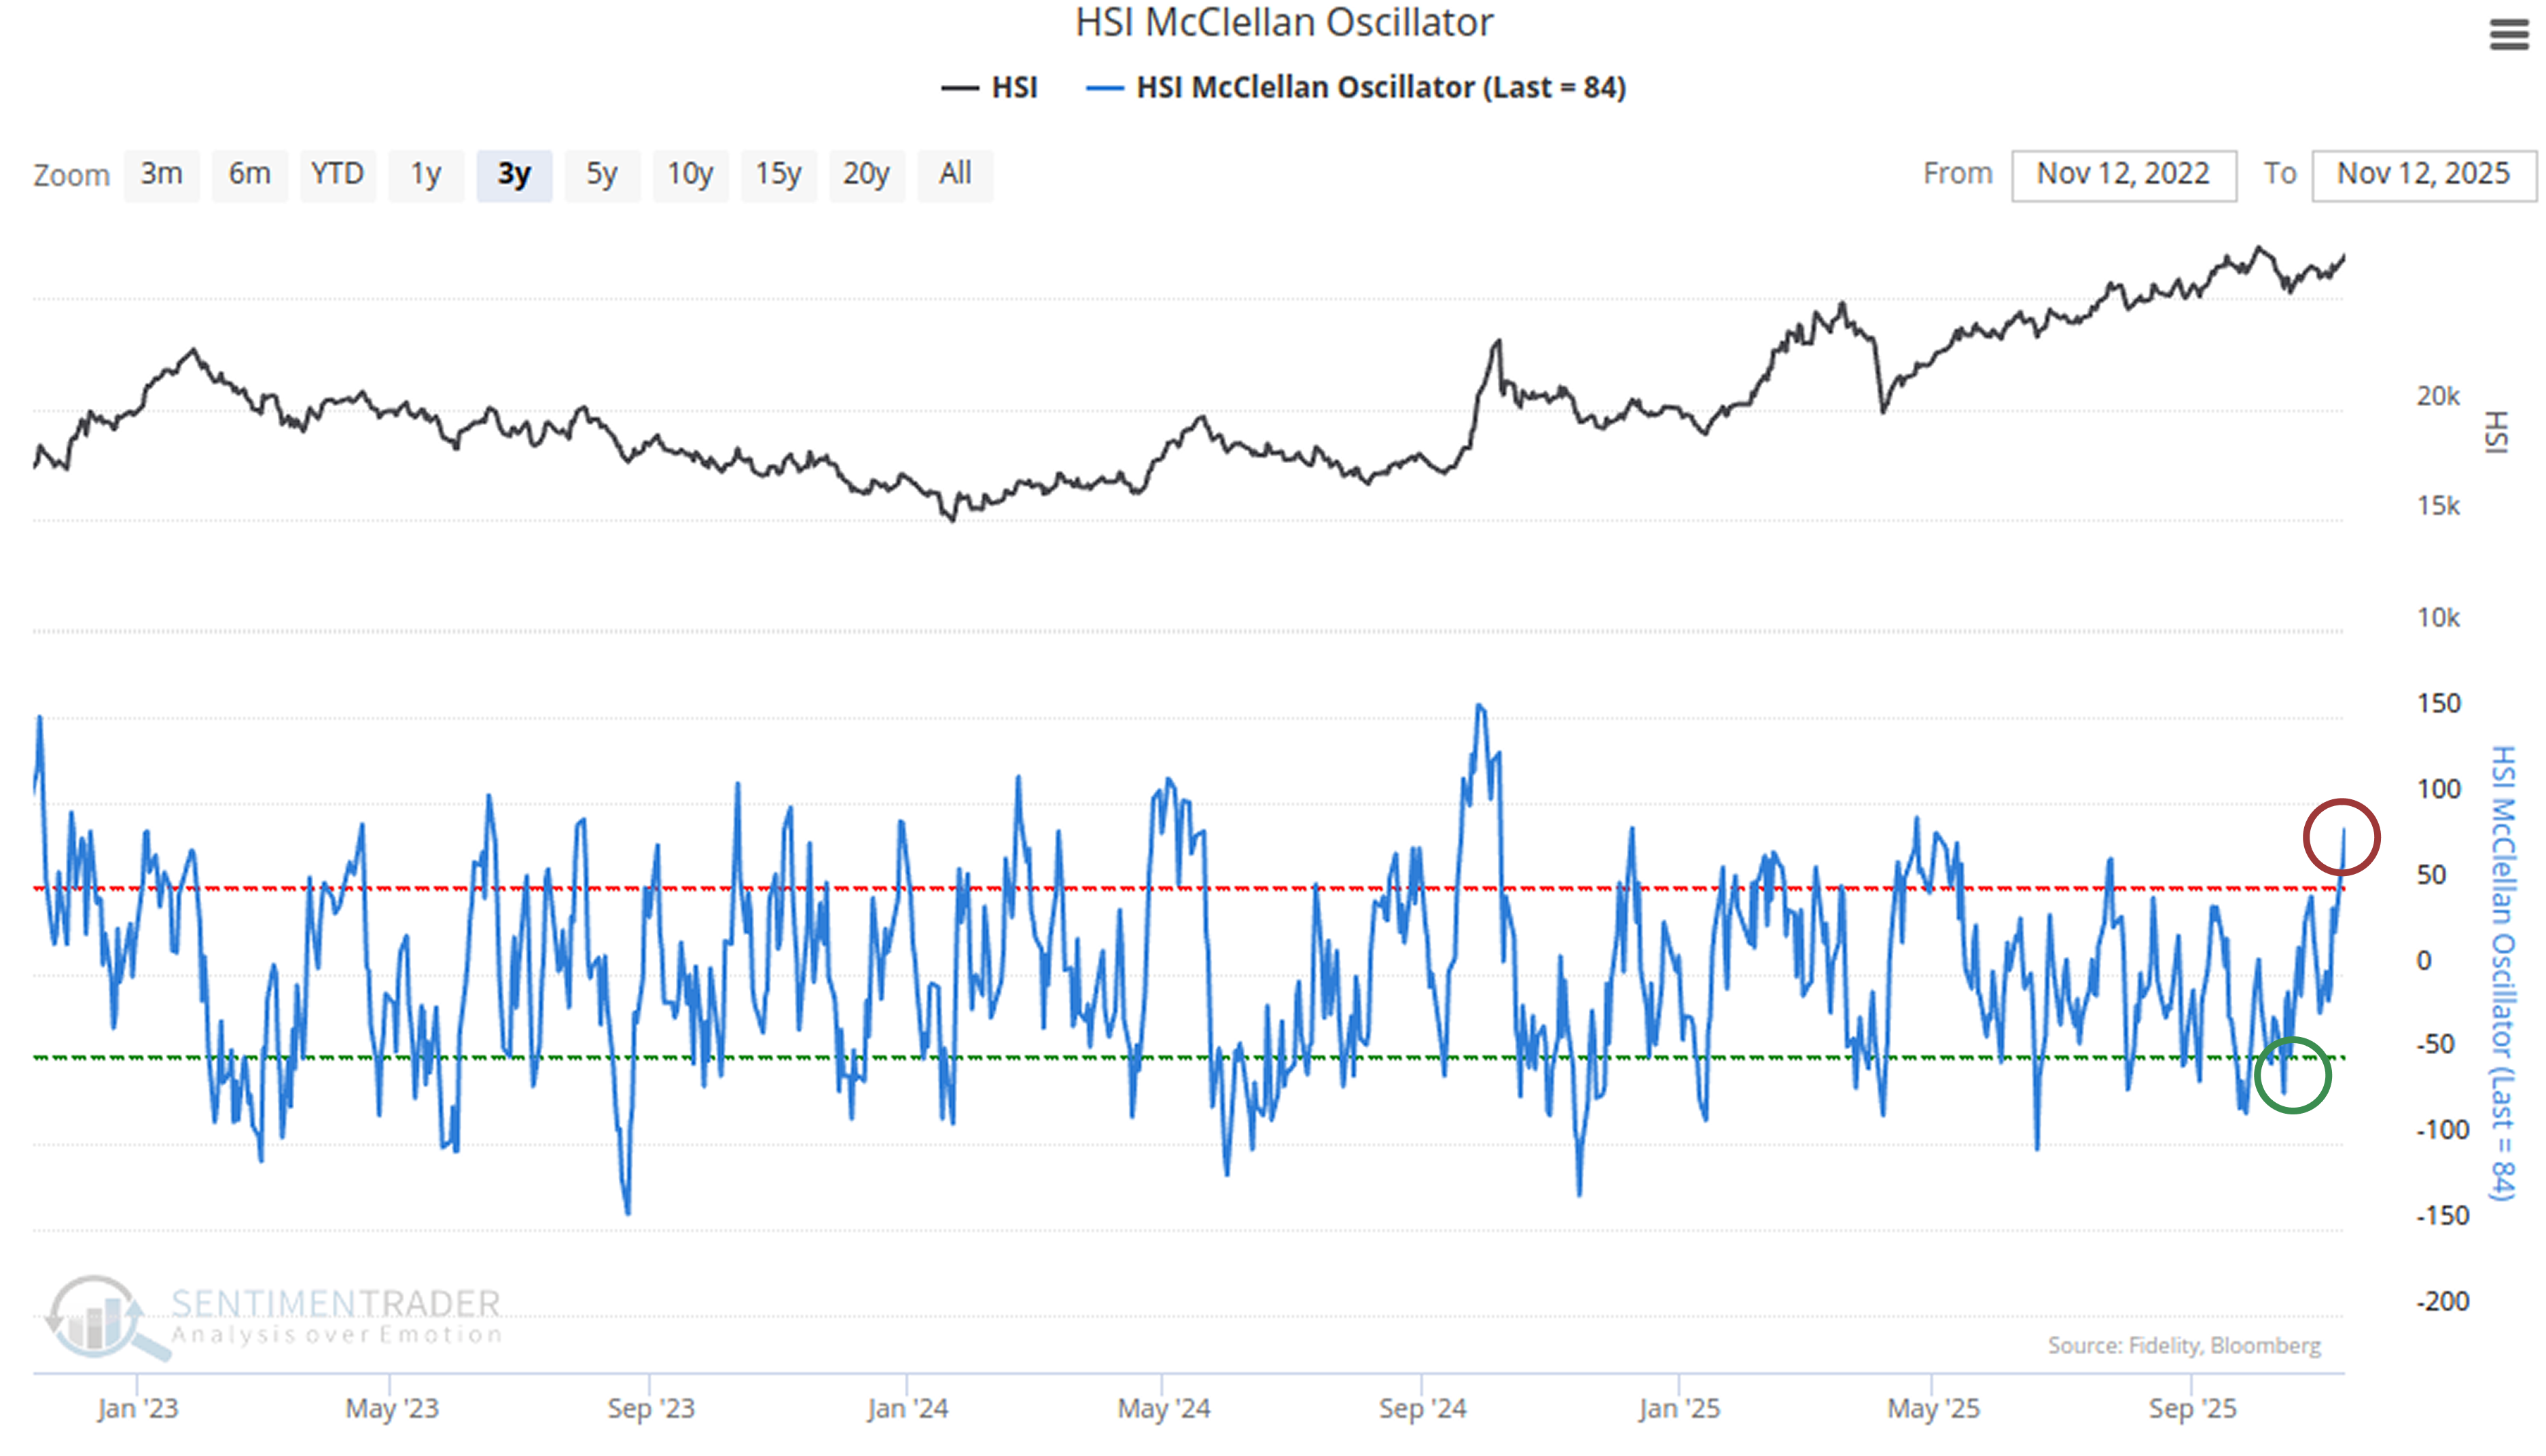
Shifting focus to short-term volatility intensity, the McClellan Oscillator has just completed a staggering "round trip." During the recent pullback, the indicator briefly fell below -70, yet amid this week's rebound, it has surged above 80.Related Backtest Click Here.
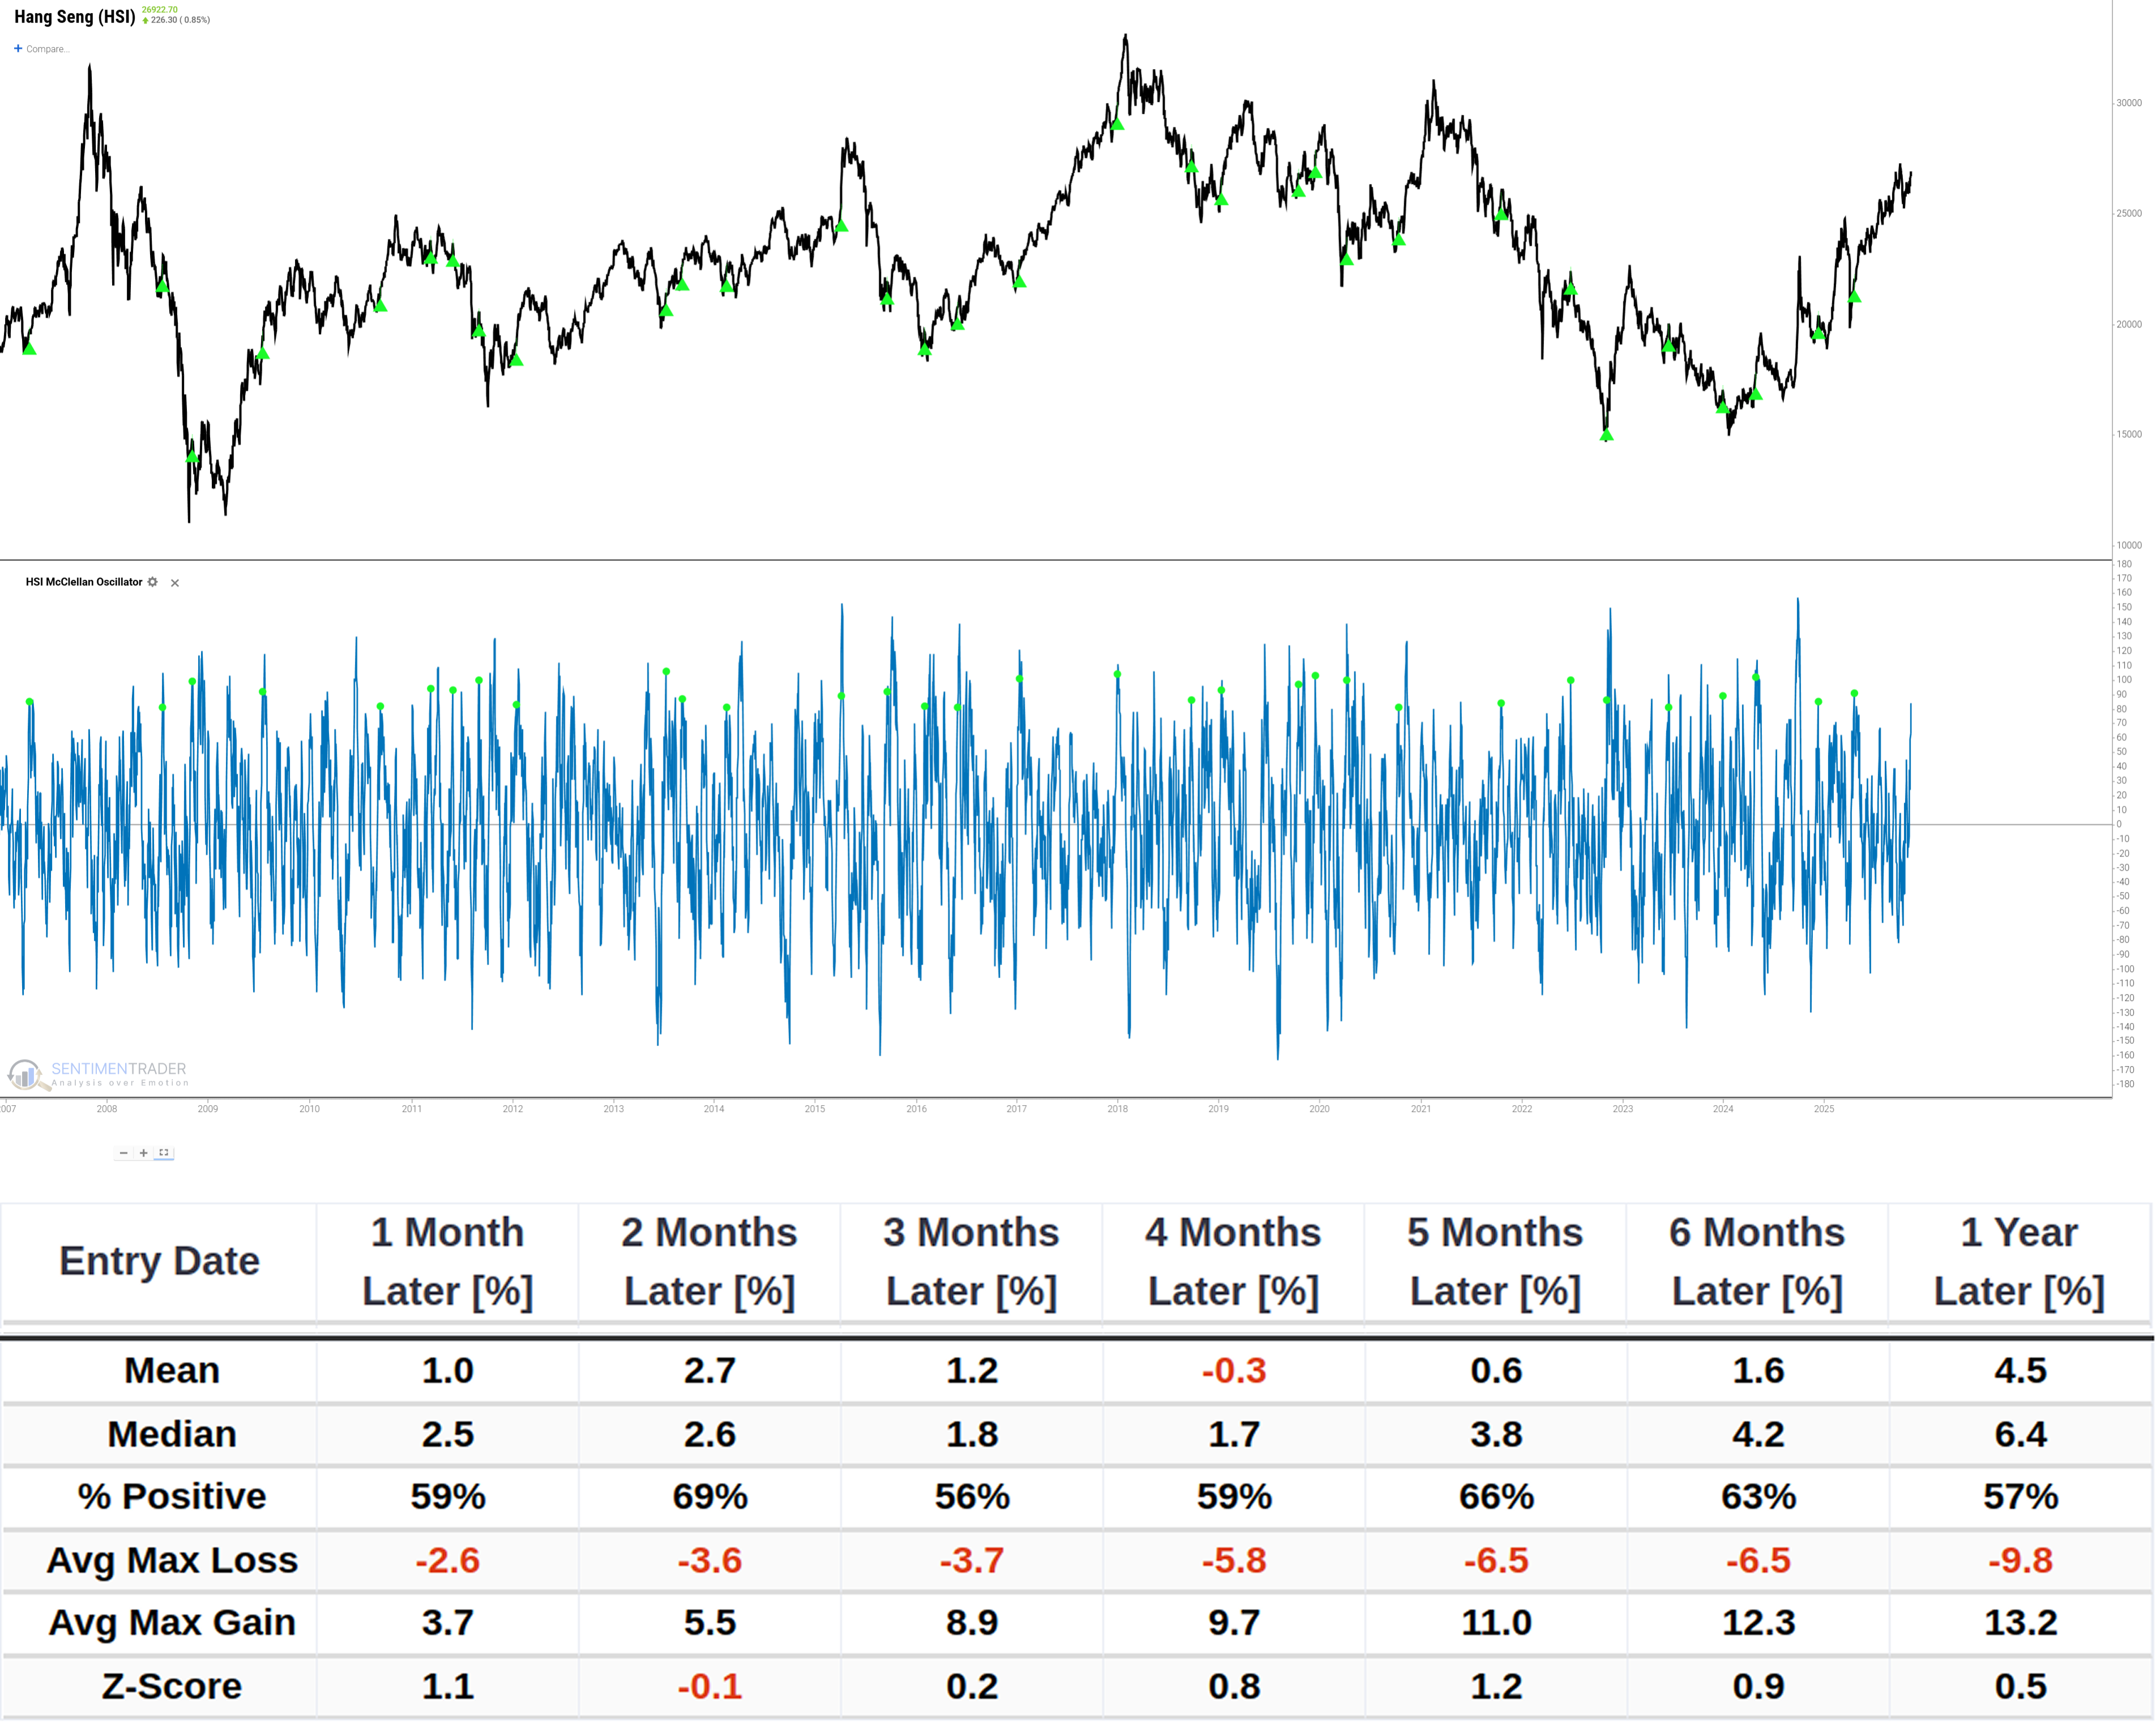
Such sharp fluctuations typically lead to mixed gains and losses in the short term, as the market needs time to digest this "motion sickness." Nevertheless, over the medium to long term, average returns steadily rise.
More Frequent Signals
We examine the breadth of buying momentum: the percentage of stocks rebounding from the lower Bollinger Band (BB) and strongly breaking above the upper band (% Above BB > 30%) has surged from an extremely low level of less than 3%. This shift usually occurs at the start of a new upward wave.Related Backtest Click Here.
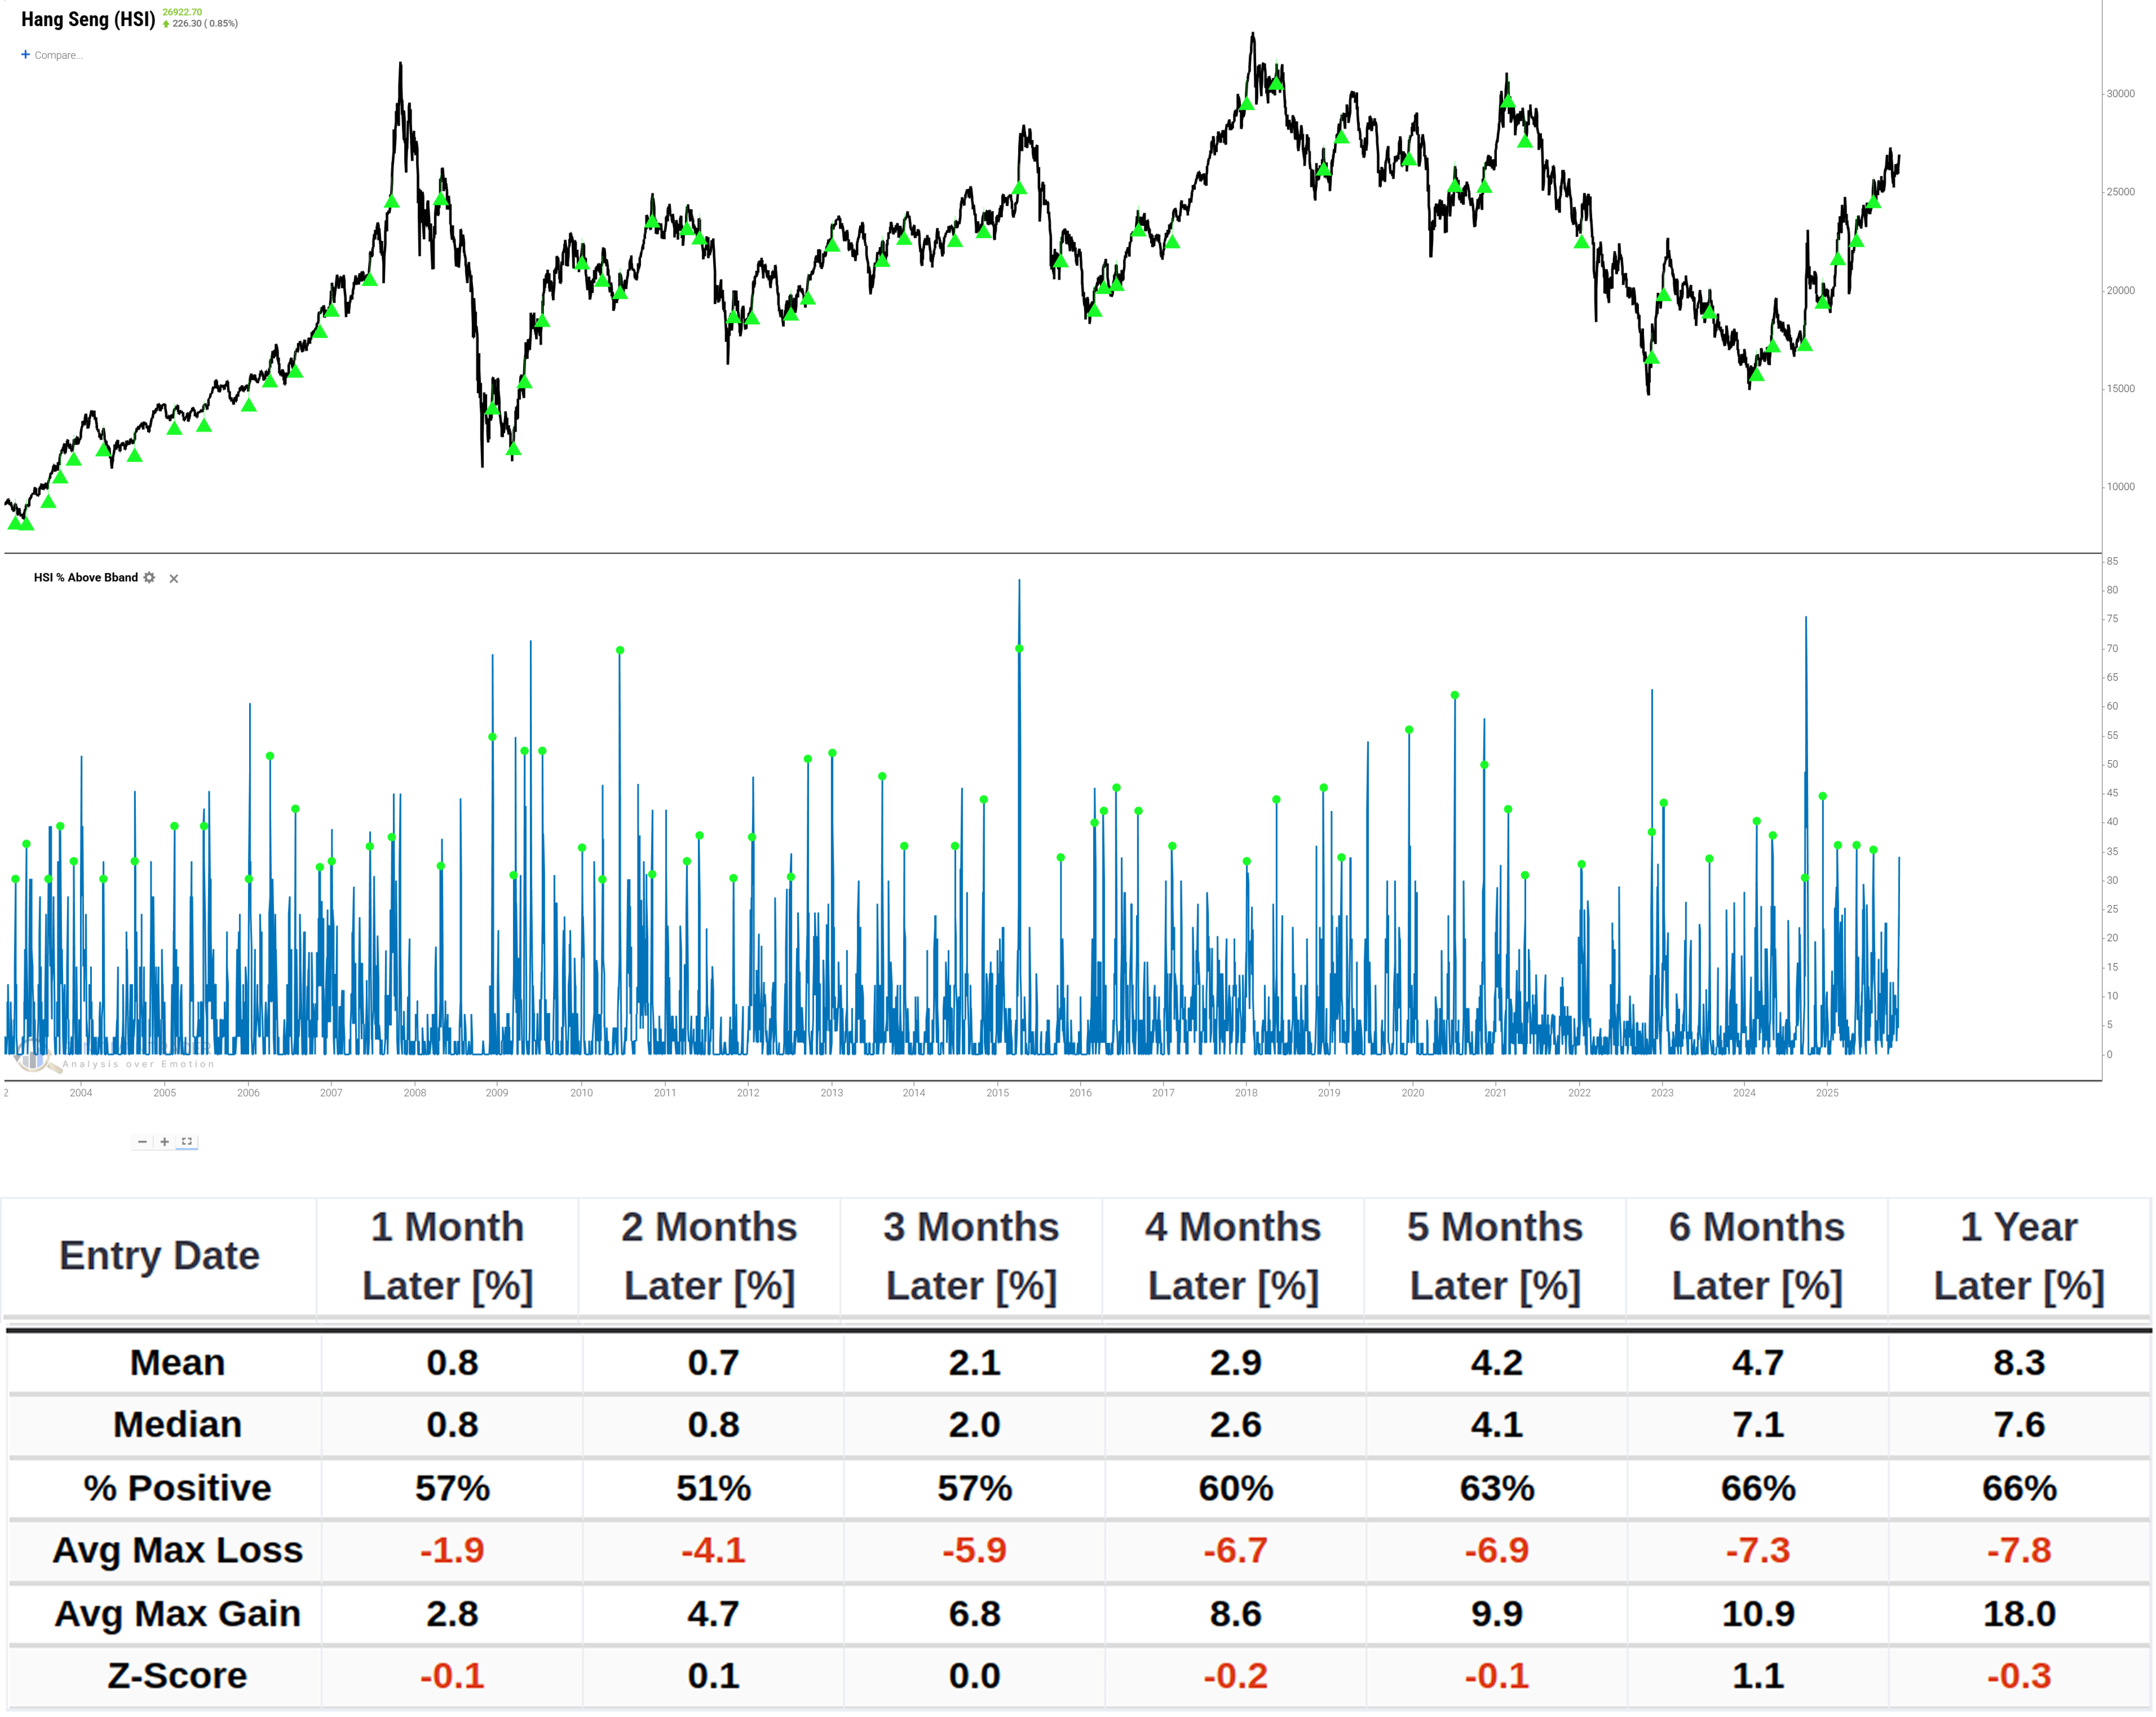
Historical data shows that one year after this signal emerges, the Hang Seng Index delivers an average return of +8.3% with relatively manageable maximum drawdowns.
Similarly, we gain another momentum confirmation when the percentage of Hang Seng Index stocks with a 14-day Relative Strength Index (RSI) above 70 triggers a golden cross breakout (crossing above 30).
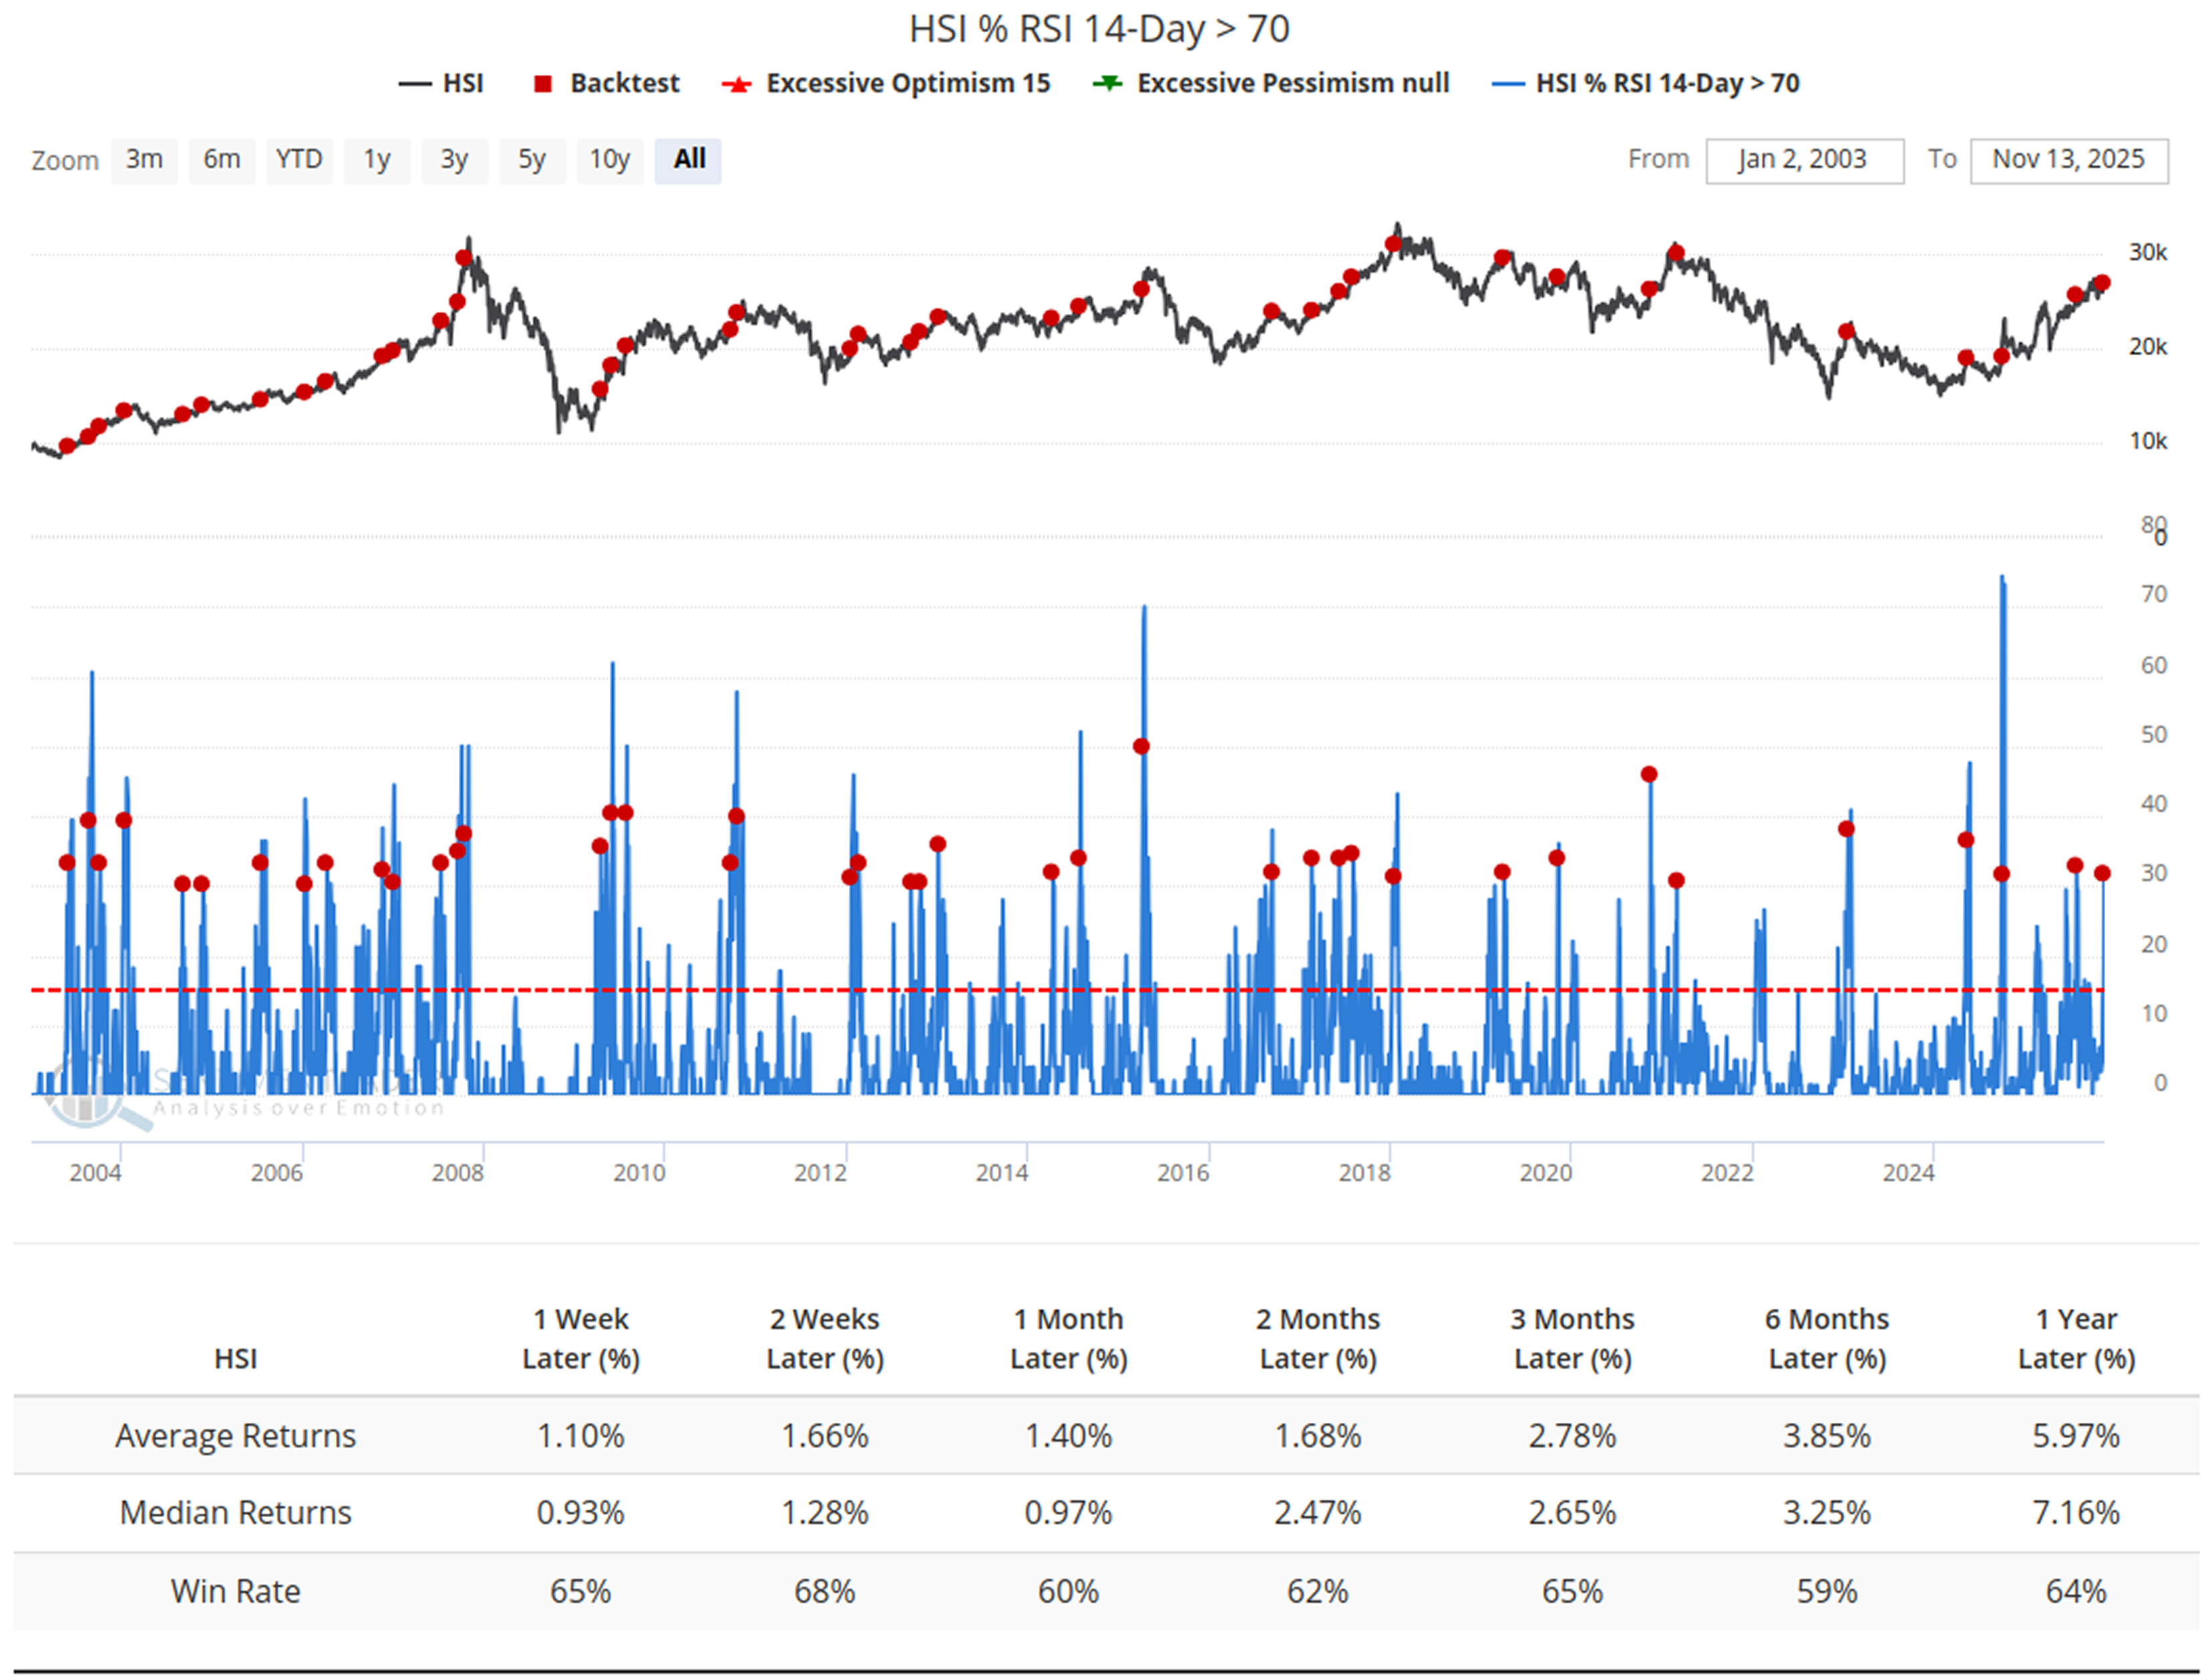
This is a relatively robust signal. While the average short-term (1-week) return is modest-indicating potential consolidation after the initial burst of momentum-the median 1-year return reaches +7.16% with a solid win rate.
Finally, observing short-term moving averages reveals that retail and short-term capital participation has reached a fever pitch.
The 5-day simple moving average (SMA) of the percentage of stocks trading above their 10-day DMA has just broken through 70%. This signifies an extremely broad-based short-term participation in the current rally.Related Backtest Click Here.
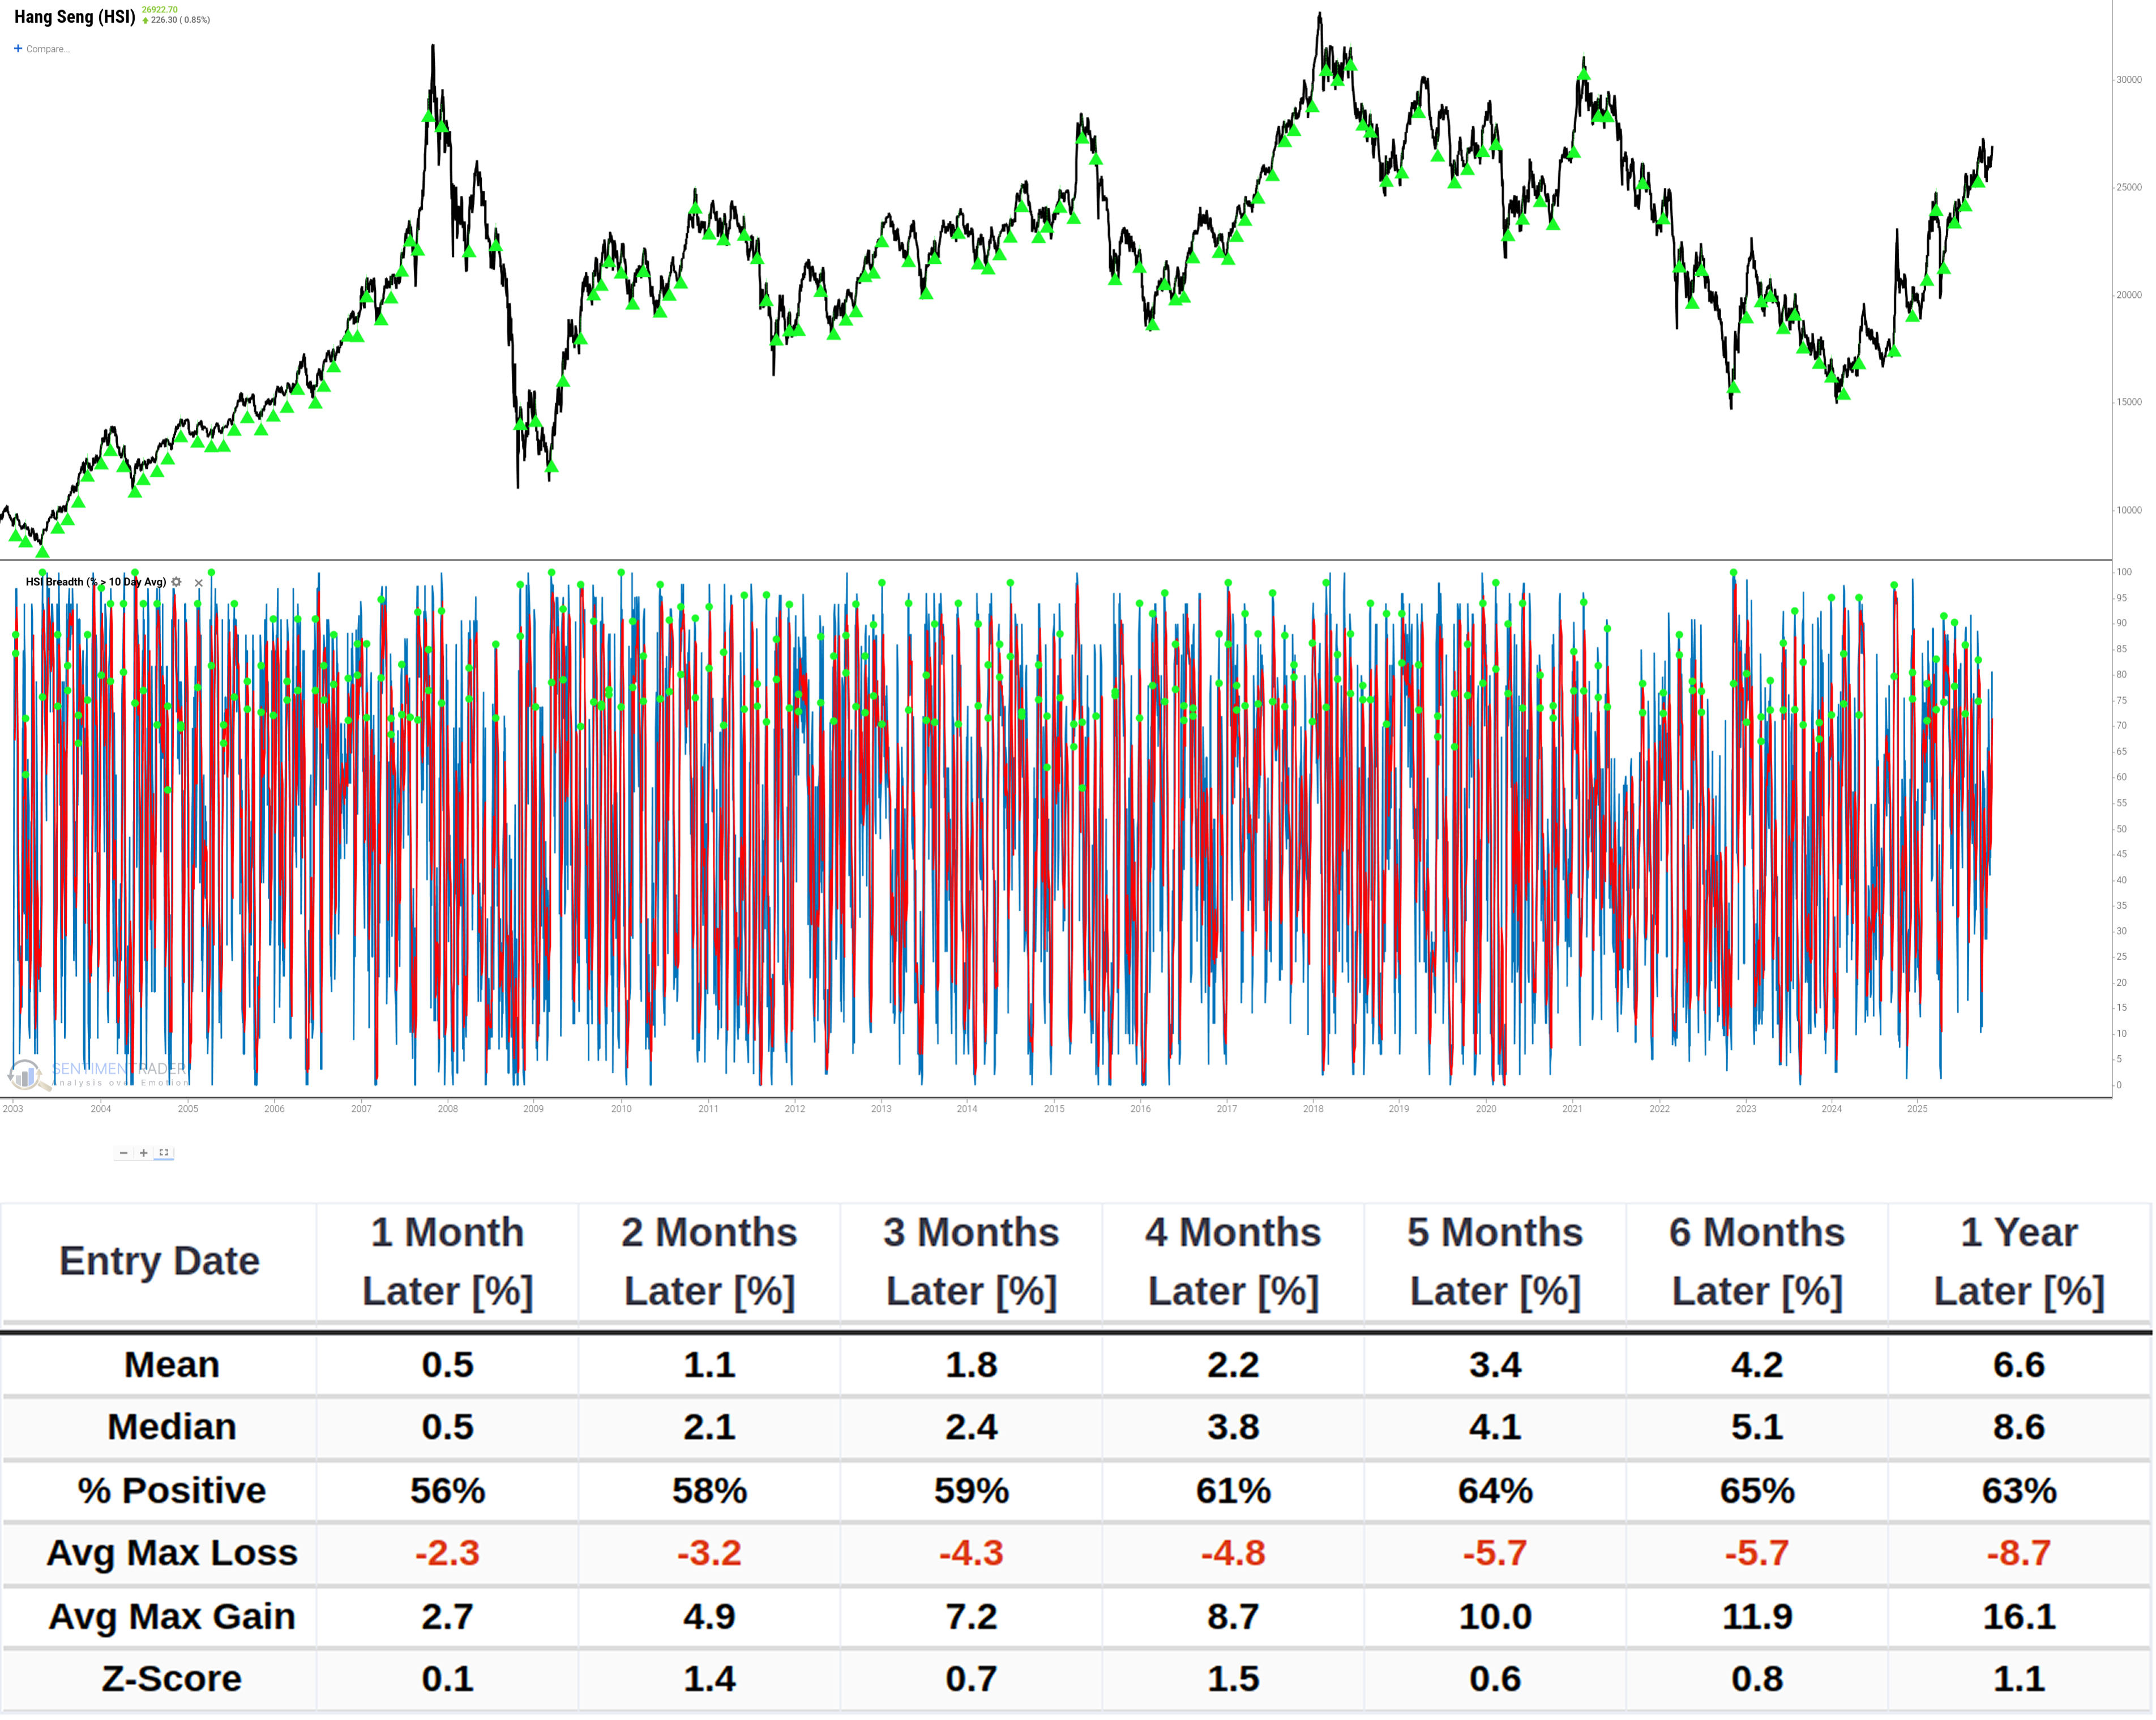
From a data perspective, such widespread short-term participation often exhibits momentum.
What the Research Tells Us...
As we have emphasized repeatedly, Chinese equity markets are distinct from other global markets. Regardless of the index used, Chinese stocks behave significantly differently from those in developed or emerging markets. The most likely explanation is that, unlike the U.S. market-dominated by institutional and passive investors-Chinese markets attract more short-term capital. This makes Chinese equities prone to boom-and-bust cyclical fluctuations, with elusive return patterns.
In the current historical context, the Hang Seng Index's situation resembles a case of fuel combustion. While investors should prepare for potential volatility in the coming weeks (as short-term profits are digested), if history is any guide, the path of least resistance for the Hang Seng Index remains upward. However, investors must remain aware of the risk of pullbacks along the way.