
This type of internal momentum does not happen during bear markets

Key points:
- The NYSE McClellan Summation Index has cycled from extreme oversold to extreme overbought
- We can see similar behavior on the Nasdaq and exchanges and indexes across the globe
- Behavior like this has almost universally occurred after the ends of protracted bear markets
Internal momentum has fully cycled from one extreme to the other
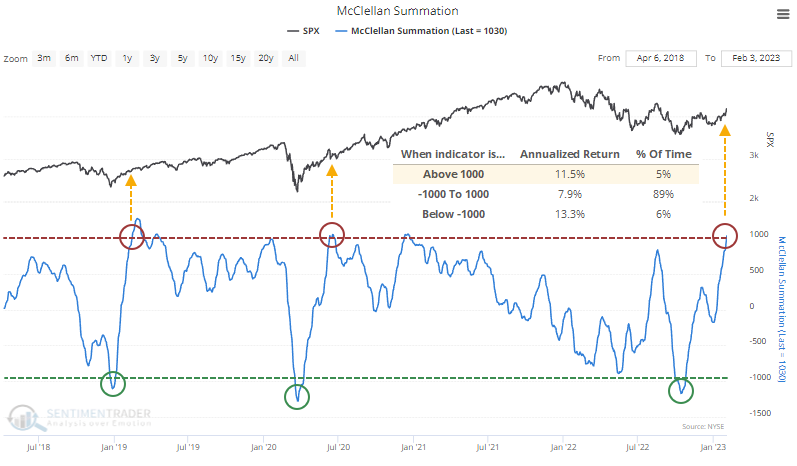
After plunging to one of the worst levels in 30 years, the market's internal momentum has completely reversed. As a result, the NYSE McClellan Summation Index has reached the lift-off stage.
For the first time in two years, the NYSE version of the Summation Index has crossed above +1,000 after declining below -1,000 last fall. The S&P 500's annualized returns tend to be best when the indicator is extremely low (deeply oversold) or extremely high (positive momentum). The recovery in the Summation Index occurred thanks to persistently high readings in the shorter-term Oscillator, as Jay noted earlier.
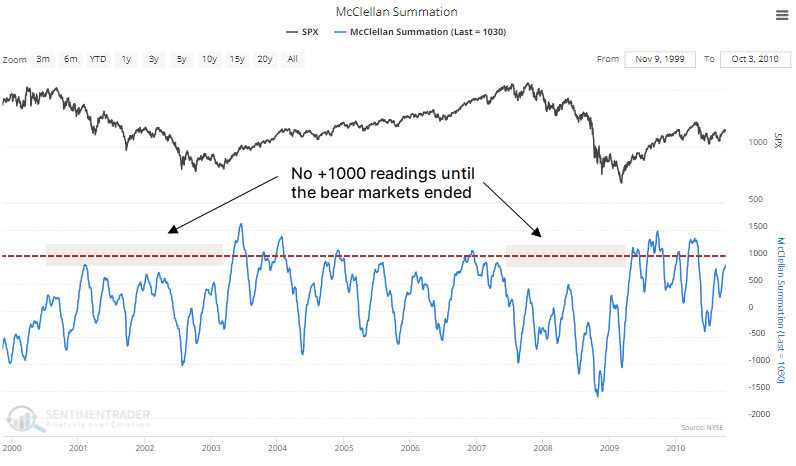
As we saw with uptrends among sectors and industries, these readings are not seen during ongoing bear markets. It did not happen during the last two bears or any before them.
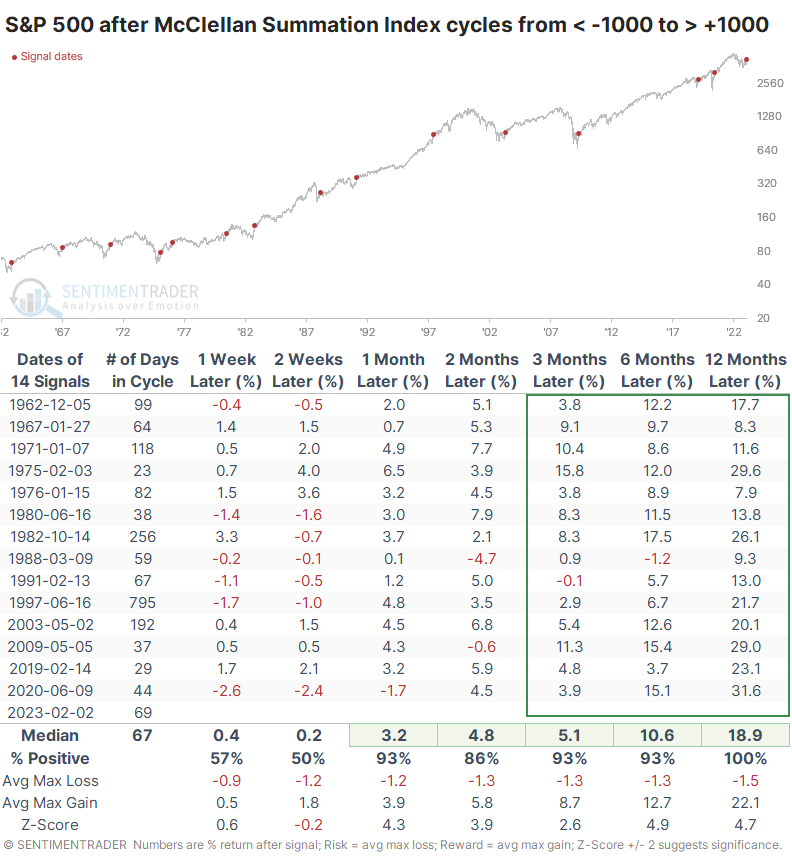
The S&P 500's returns following cycles in the Summation Index from below -1,000 to above +1,000 were pristine. There was a single tiny loss three or six months later, but all showed a positive return over the following year.
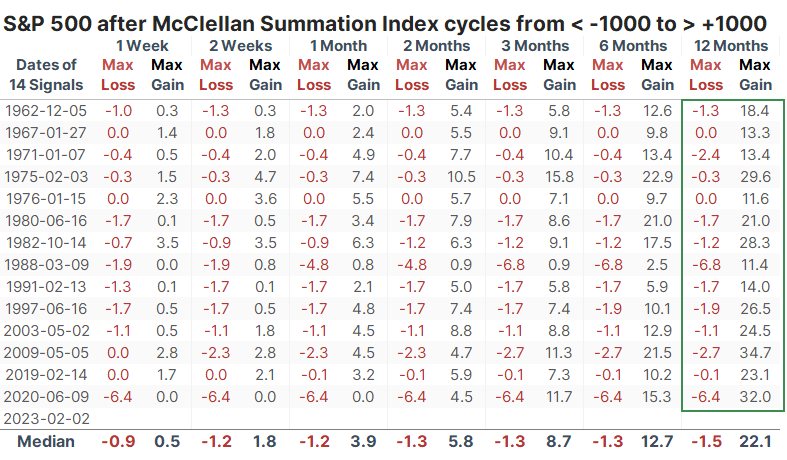
The signals enjoyed an incredible risk versus reward profile. The most significant drawdown among any signal within the next year was a modest -6.8%. At the same time, every signal saw a rally of at least +11.4%. It is rare to see such skewed results, with such consistency, over a base of more than a dozen precedents.
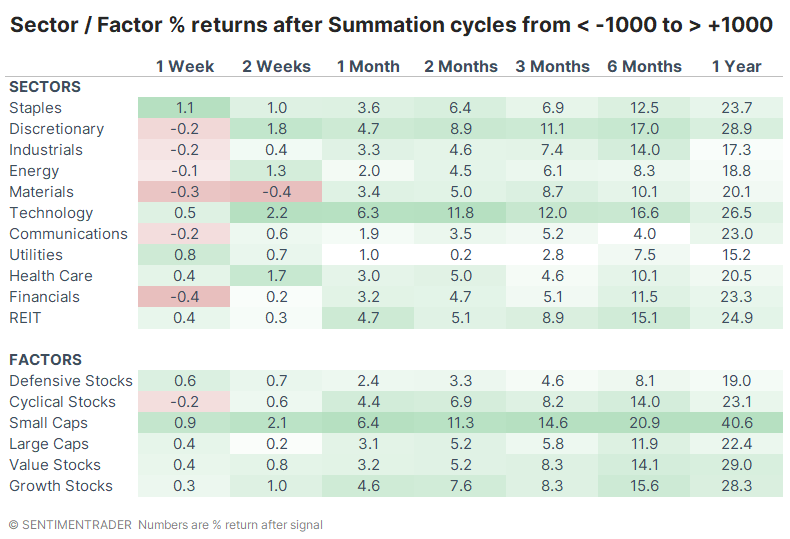
Technology, Discretionary, and Small-Cap stocks enjoyed the highest average returns among sectors and factors. Over the next year, Small-Caps averaged a return of over 40%.
The Nasdaq and other exchanges join the party
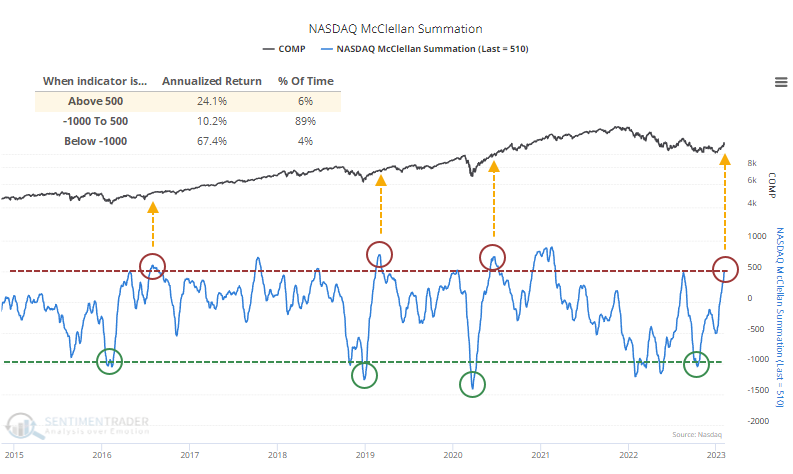
The Nasdaq McClellan Summation Index has similarly cycled from an extreme low to extreme high. There is a lot of junk on the Nasdaq exchange, so it's rare to see any breadth measures for that exchange reach levels as high as on the NYSE.
The last few times the Nasdaq's Summation Index cycled like this, it coincided with the ends of bear markets. The Composite's annualized return when the Summation Index was above +500 is a whopping +24.1% since 1986.
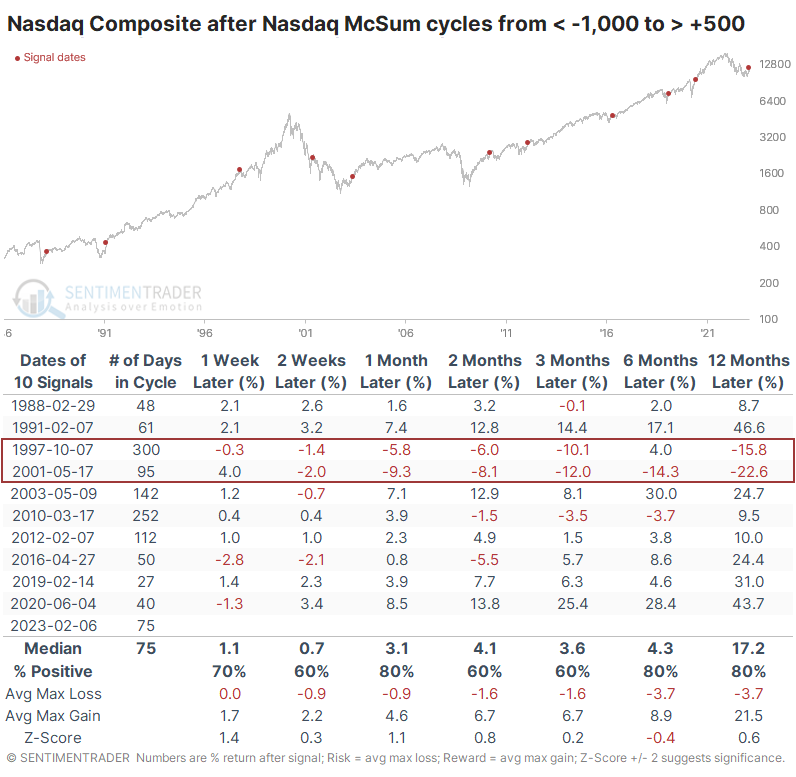
The Nasdaq, and the securities trading on that exchange, tend to be more volatile. So it did give a couple of false signals after similar cycles from one extreme to the other.
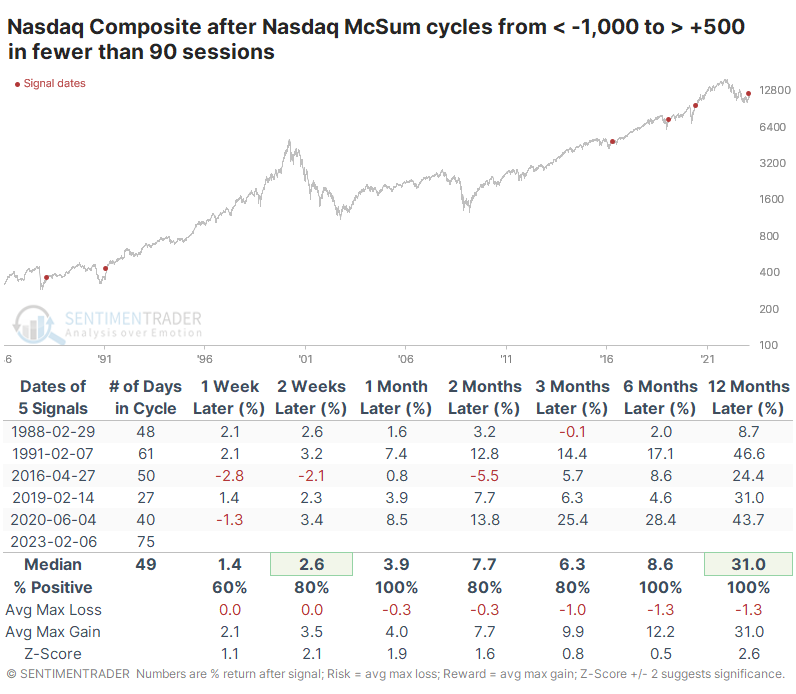
However, one difference now is the pace of the change in investor behavior. It took fewer than 90 days to cycle between extremes. The few other times it was this quick, future returns were excellent.
The improvement in internal momentum is not relegated to securities trading on the NYSE. It's also evident from multi-year highs in the Summation Indexes in the French CAC, German DAX, UK FTSE, and Hong Kong's Hang Seng.
What the research tells us...
As we've seen with other metrics in recent weeks, the types of readings we're seeing now in momentum and breadth are rarely, if ever, seen during protracted bear markets. When investors shift from near-depression, like last fall, to overwhelming optimism, it can precede choppy trading for weeks or even months. But with rare exceptions, it has resolved in higher prices for most equity indexes over the medium- to long-term.