
This S&P 500 pattern suggests short term caution

Key points:
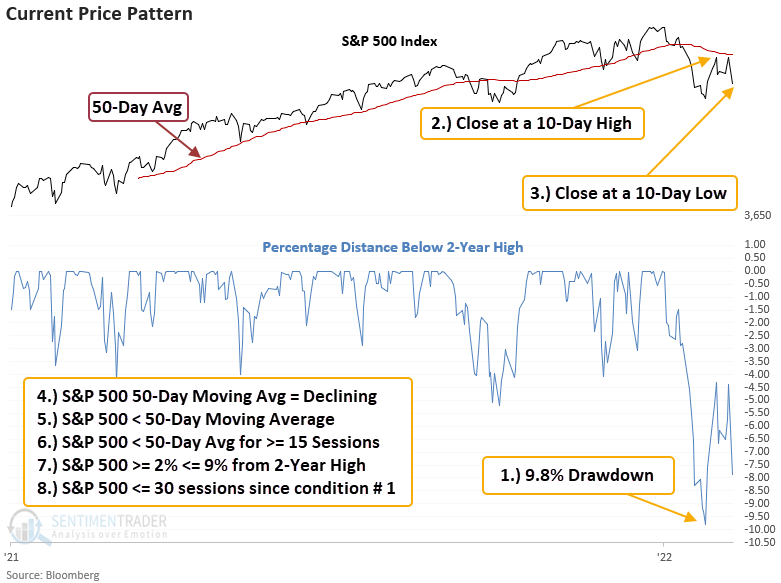
- The S&P 500 corrected by 9.8% and subsequently bounced below a declining 50-day average
- After registering a 2-week high, the index closed at a new 2-week low on Friday
- Stocks show negative returns in the short-term after similar patterns
Does the current S&P 500 pattern suggest a retest of the lows
Mark Twain once said, "history never repeats itself, but it often rhymes." Let's conduct a study to assess the outlook for stocks by coding a set of conditions based on the current S&P 500 pattern. Our study will seek to identify the following.
- The S&P 500 closes down 9.5% from a 2-year high
- The S&P 500 closes at a 10-day high
- The S&P 500 closes at a 10-day low (the final condition that triggers the signal)
- The S&P 500 50-day moving average is declining
- The S&P 500 is trading below its 50-day moving average
- The S&P 500 has traded below its 50-day average for 15 or more sessions
- The S&P 500 is down more than 2% but less than 9% from its 2-year high
- The S&P 500 is 30 days or less from its 9.5% drawdown date
Because the analysis closely corresponds to the current data, we need to acknowledge that the pattern may be subject to overfitting.
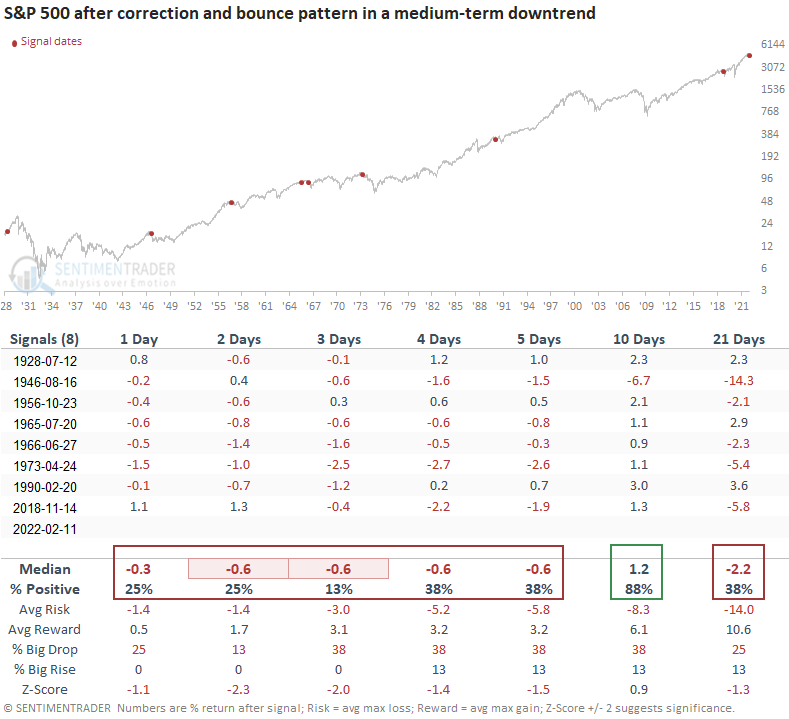
Ultra short-term time frames suggest weak returns for the S&P 500
This signal triggered 8 other times over the past 94 years. After the others, the S&P 500 shows weak returns and unfavorable win rates over the subsequent 5 day period. After the initial weakness, the 10-day time frame suggests the market can bounce before declining again. The sample size is small.
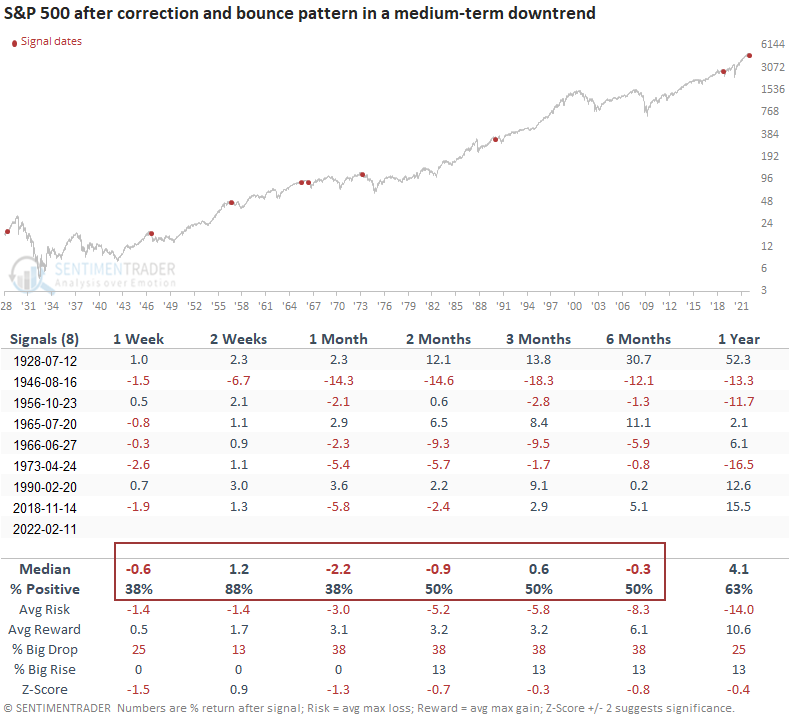
Long duration time frames suggest lackluster returns for the S&P 500
When we review signal performance with our standard table, the results look underwhelming across almost all time frames.
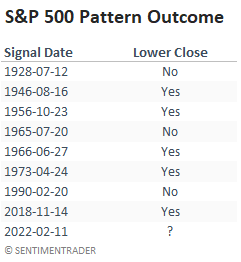
A new S&P 500 low or is the worst over for now
The current S&P 500 pattern resulted in a new low below the 9.5% drawdown pivot close in 5 out of 8 instances. I would also recognize that 3 of the signals resulted in full-blown bear markets.
What the research tells us...
When the S&P 500 corrects by 9.5% or more and subsequently bounces in a medium-term downtrend, the odds favor a retest of the original drawdown pivot close. Similar setups to what we're seeing now have preceded falling prices for the S&P 500 over the subsequent 1-week period. A close above the 50-day moving average in the near term could potentially negate the retest scenario.