Products
SentimenTrader Trading Tools
‍
Backtest Engine
My Trading Toolkit
Correlation Analysis
Seasonality
Market Prediction
Indicators & Data API
‍
Proprietary Indicators & Charts
Market Data API
Strategies & Scanner
‍
50+ Trading Strategies
Smart Stock Scanner
Smart Option Scanner
Research Reports
‍
Research Solutions
Reports Library
Free Resources
Simple Backtest Calculator
Simple Seasonality Calculator
The Kelly Criterion Calculator
Sentiment Geo Map
Public Research Reports
Education
Sentiment Indicators
Technical Indicators
Pricing
Company
About
In the News
Testimonials
Client Success Stories
Contact
Log inLoginSign up
< BACK TO ALL REPORTS

This signal suggests the bear market in technology is over

Dean Christians
2022-08-19
For only the 19th time since 1952, S&P 500 Technology stocks in a bear market cycled from greater than 90% to less than 50%. Let's assess the outlook for the technology sector after similar reversals.

Key points:

  • S&P 500 Technology stocks in a bear market cycled from > 90% to < 50%
  • After similar reversals, the sector was higher 89% of the time a year later
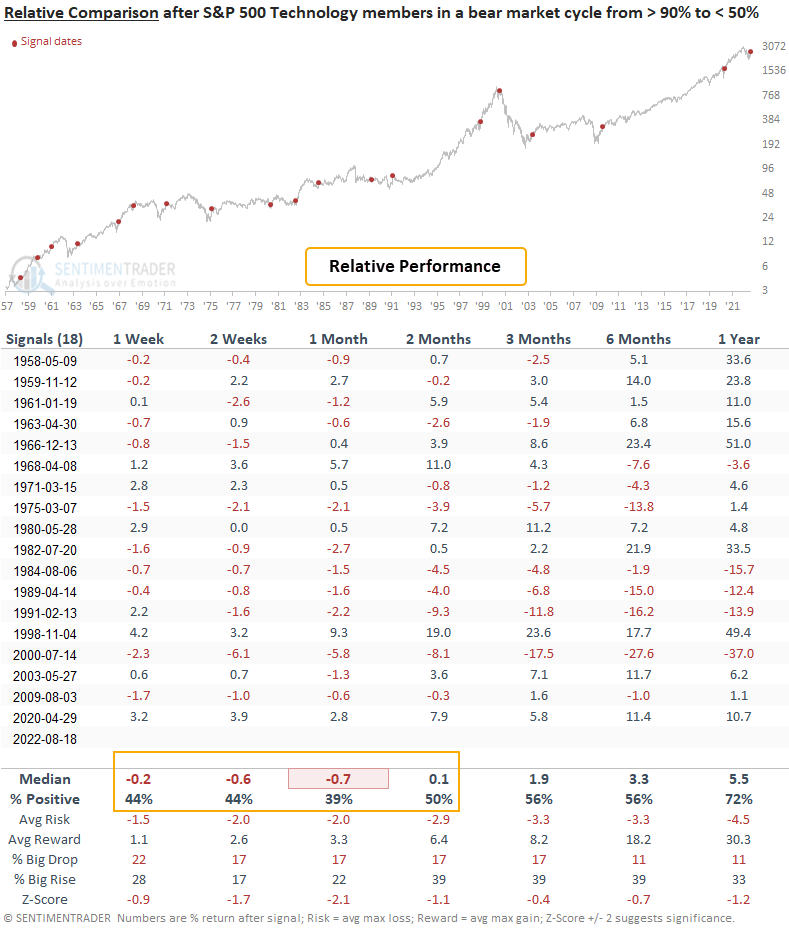
  • On a relative basis, the S&P 500 Technology sector could underperform the S&P 500 in the near term

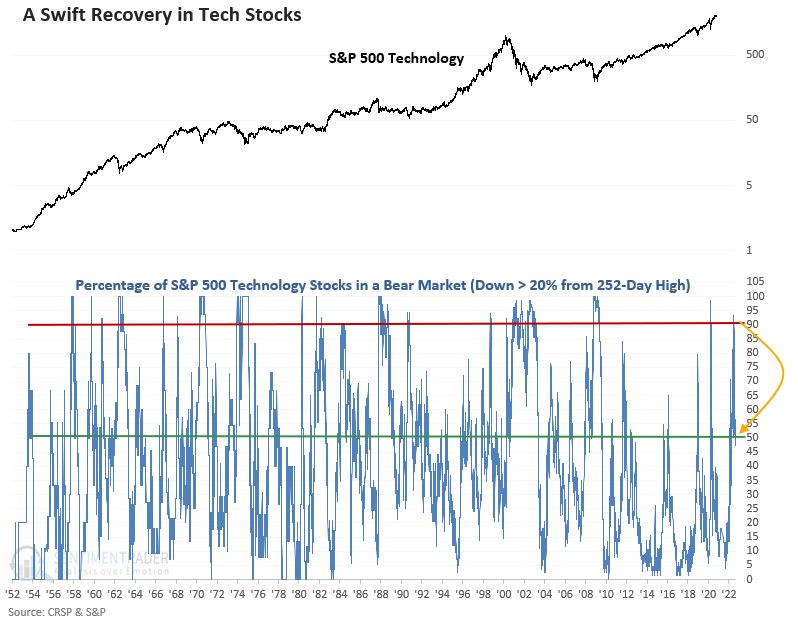
Technology stocks in a bear market reversed from an extreme level

The S&P 500 Technology sector has ripped higher since the June low, outperforming the S&P 500 by over 500 bps. I'm not surprised as the group had more than 90% of its stocks in a bear market as of June 30th, the highest level of any sector. On Thursday, the number of S&P 500 Technology stocks in a bear market dropped below 50%.

Let's assess the outlook for the S&P 500 Technology sector after the number of S&P 500 technology stocks trading down 20% or more from a 252-day high cycle from > 90% to < 50%.

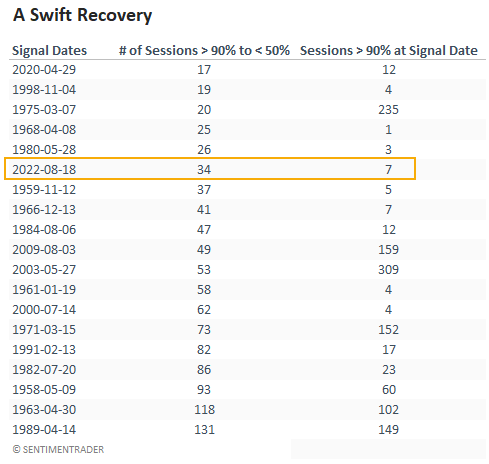
Technology stocks in a bear market reversed lower in only 34 sessions, marking one of the shorter number of days to recover in history. At the time of the cross below 50%, the indicator had spent seven sessions above 90%, which is brief compared to other instances.

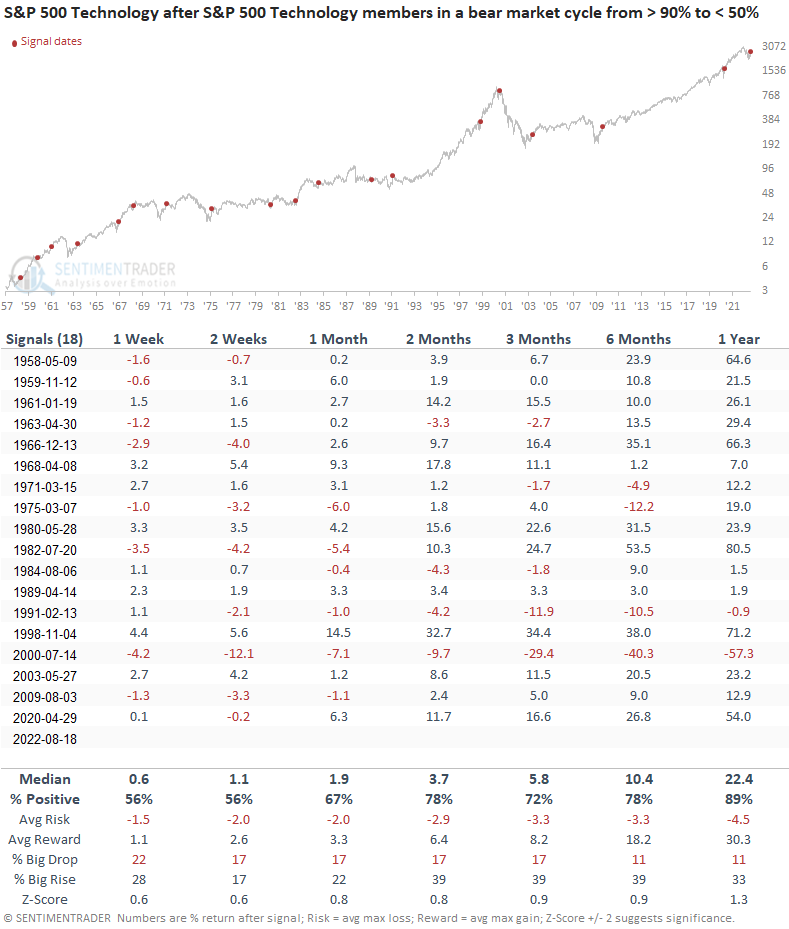
Similar signals preceded positive returns 89% of the time a year later

This study generated a signal 18 other times over the past 65 years. While returns and win rates look solid, we don't see any time frames with a z-score that shows significance. Drawdowns were relatively tame except for the July 2000 signal, which occurred near the early stages of the Dotcom bust.

Suppose I apply the signals to the S&P 500. In that case, the results look excellent, especially the z-scores across medium and long-term time frames. So, except for the July 2000 signal, what's good for technology is good for the broad market.

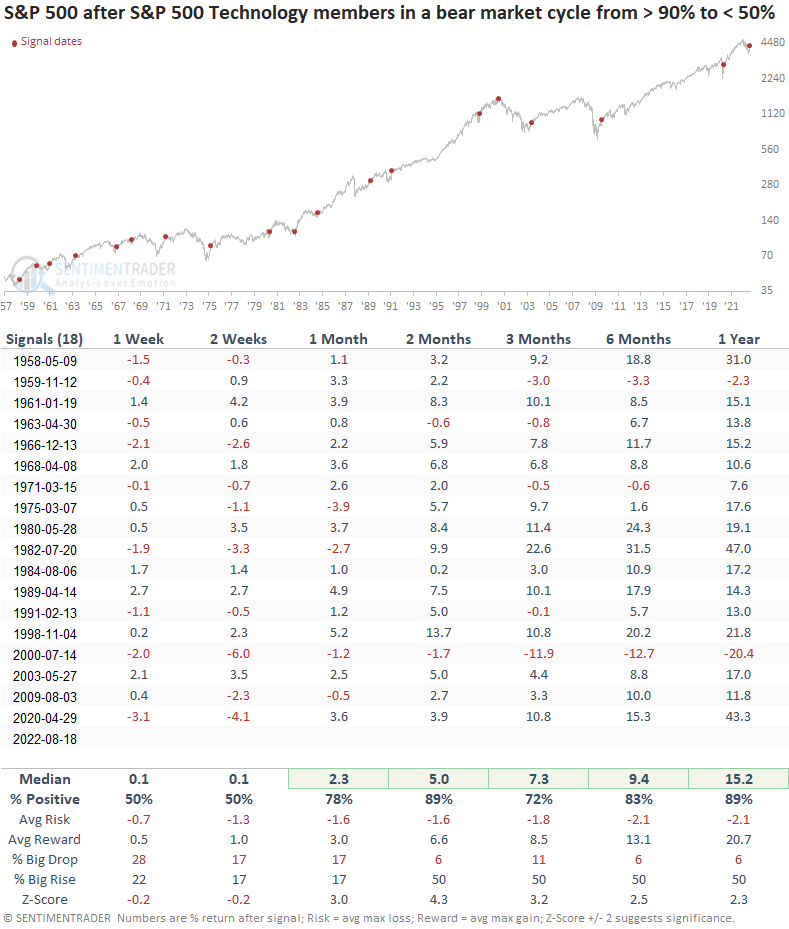
When I compare technology to the S&P 500, the sector tends to struggle in the first few months, which was the case in my previous note that highlighted the cross above 90%. 

What the research tells us...

The technology sector has staged an impressive recovery from a severely old condition. The reversal in the number of technology stocks in a bear market bodes well for the industry and the broad market. If we compare technology to the S&P 500, one should be mindful that the sector could underperform the S&P 500 in the near term.

PRODUCTS
SentimenTrader
Trading Tools
Indicators & Data API
‍
Strategies & Scanner
‍
Research Reports
FREE
RESOUrCES
Simple Backtest
Calculator
Simple Seasonality
Calculator
The Kelly Criterion
Calculator
Sentiment Geo Map
‍
Public Research Reports
‍
Education
Sentiment Indicators
‍
Technical Indicators
‍
Pricing
Bundle pricing
‍
FAQ
‍
Announcements
‍
COMPANY
‍
About
‍
In the News
‍
Testimonials
‍
Client Success Stories
CONTACT
‍
General Inquiries
‍
Media Inquiries
‍
Financial Professionals Inquiries
‍
© 2026 Sundial Capital Research Inc. All rights reserved.
Setsail Marketing
TermsPrivacyAffiliate Program
Risk Disclosure: The information and tools provided are for research and analytical purposes only and are not intended as investment advice. Market analysis involves uncertainty, and outcomes may differ from expectations. Users should conduct their own due diligence and consider their individual circumstances before making any financial decisions. Past performance is not necessarily indicative of future results.

Hypothetical Performance Disclosure: Hypothetical performance results have many inherent limitations, some of which are described below. No representation is being made that any account will or is likely to achieve profits or losses similar to those shown; in fact, there are frequently sharp differences between hypothetical performance results and the actual results subsequently achieved by any particular trading program. One of the limitations of hypothetical performance results is that they are generally prepared with the benefit of hindsight. In addition, hypothetical trading does not involve financial risk, and no hypothetical trading record can completely account for the impact of financial risk of actual trading. for example, the ability to withstand losses or to adhere to a particular trading program in spite of trading losses are material points which can also adversely affect actual trading results. There are numerous other factors related to the markets in general or to the implementation of any specific trading program which cannot be fully accounted for in the preparation of hypothetical performance results and all which can adversely affect trading results.

Testimonial Disclosure: Testimonials appearing on this website may not be representative of other clients or customers and is not a guarantee of future performance or success.