
This signal helps you spot a bear market like a pro

Everyone wants to find a way to prepare for a bear market and devastating losses. If you can get a heads-up that stocks are likely heading into a rough patch, then you can raise cash, buy hedges, or take other defensive measures.
Dean shows you a simple method, with the exact rules, to do just that.
Over decades as a Wall Street trader and researcher, he created and tested countless risk-off models that seek to identify the early stages of a bullish to bearish trend reversal for the stock market. His research concluded that market breadth is one of the best tools for identifying trend changes in advance of price action alone.
Breadth-based indicators offer an inside look at the participation of individual components within an index that provides valuable information. This look beneath the surface allows us to quantify a basket of securities underlying strength or weakness.
"Markets are strongest when broad and weakest when they narrow to a handful of issues." - Bob Ferrell
We can use the percentage of members above the 50-day moving average to identify a trend change that often foreshadows bear market or correction periods.
THE CONCEPT
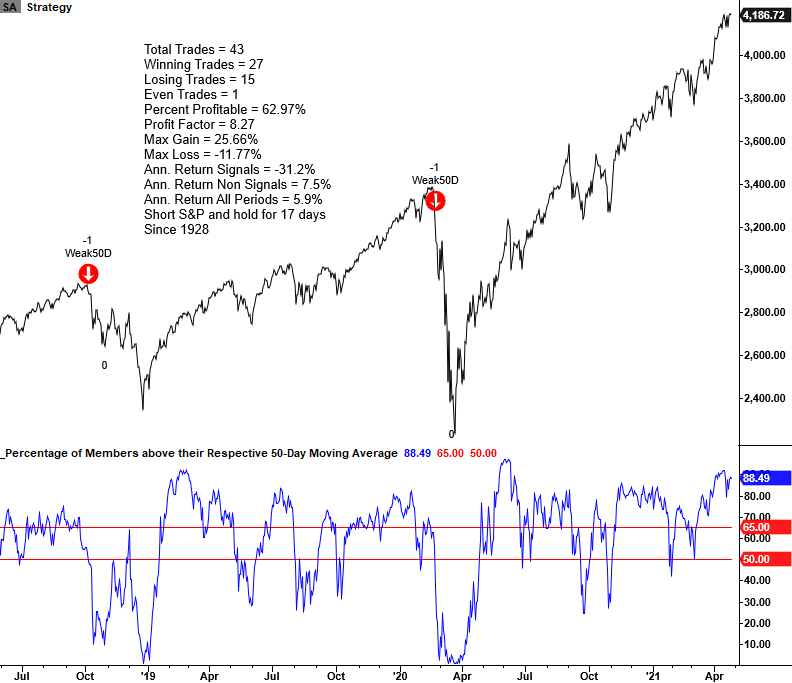
The percentage of members above the 50-Day moving average risk-off model identifies instances when a low number of Index members are trading above their respective 50-day average as the Index itself hovers near a high. The model will issue two separate alerts based upon the following conditions.
CONDITIONS FOR 1ST BREADTH SIGNAL
- Percentage of S&P 500 members <= 65%
- S&P 500 Index <= 0.25% from 252-Day High
- If Condition 1 & 2, start a days since true count
- If days since true count <= ten days and the percentage of S&P 500 members crosses below 50%, signal risk-off
- If percentage of members crosses above 66%, reset condition = true
CONDITIONS FOR 2ND BREADTH SIGNAL
- Percentage of S&P 500 members <= 54.5%
- S&P 500 Index <= 0.25% from 252-day high
- If Condition 1 & 2, start a days since true count
- If days since true count <= ten days and the S&P 500 5-day rate of change is -1% or more, signal risk-off
- If percentage of members crosses above 63%, reset condition = true
CURRENT CHART
Dean calculated performance statistics in the chart as a short signal, whereas annualized returns result from buying the S&P 500. Through the spring of 2021, this signal successfully shorted the S&P 63% of the time when holding for 17 trading days.
To see the full post with more details and charts, click here.
Using the percentage of members above the 50-day average has triggered ahead of several major market peaks. It wasn't perfect (nothing is), but it's a simple system, with readily available data, and triggered before 7 out of the last 10 major declines.
If you would like to follow this signal or learn more about how we use breadth-based indicators to assess market conditions, please visit www.sentimentrader.com for more information. With a database that starts in 1927 and contains over 300 times series, we can provide a historical perspective on market breadth unmatched by most other research services.
To see the full post with more details and charts, click here.

| Stat Box Twitter users really don't like utilities. Using machine learning, our Social Sentiment for XLU shows that there have been more than 6 negative tweets for every positive one on XLU over the past week. That ranks among the highest in 10 years. |
What else we're looking at
- A historical look Barron's Big Money optimism
- What happens in the months after Big Money is bullish versus bearish
- A signal in the Sentiment Risk Model just triggered
- Data is suggesting paying close attention to copper right now