Products
SentimenTrader Trading Tools
‍
Backtest Engine
My Trading Toolkit
Correlation Analysis
Seasonality
Indicators & Data API
‍
Proprietary Indicators & Charts
Market Data API
Strategies & Scanner
‍
50+ Trading Strategies
Smart Stock Scanner
Research Reports
‍
Research Solutions
Reports Library
Free Resources
Simple Backtest Calculator
Simple Seasonality Calculator
The Kelly Criterion Calculator
Sentiment Geo Map
Public Research Reports
Pricing
Company
About
In the News
Testimonials
Client Success Stories
Contact
Log inLoginSign up
< BACK TO ALL REPORTS

This price volatility signal suggests higher stock prices

Dean Christians
2021-12-16
Price volatility surged and subsequently reversed lower, triggering a buy signal for S&P 500 with an 88% win rate.

Key points:

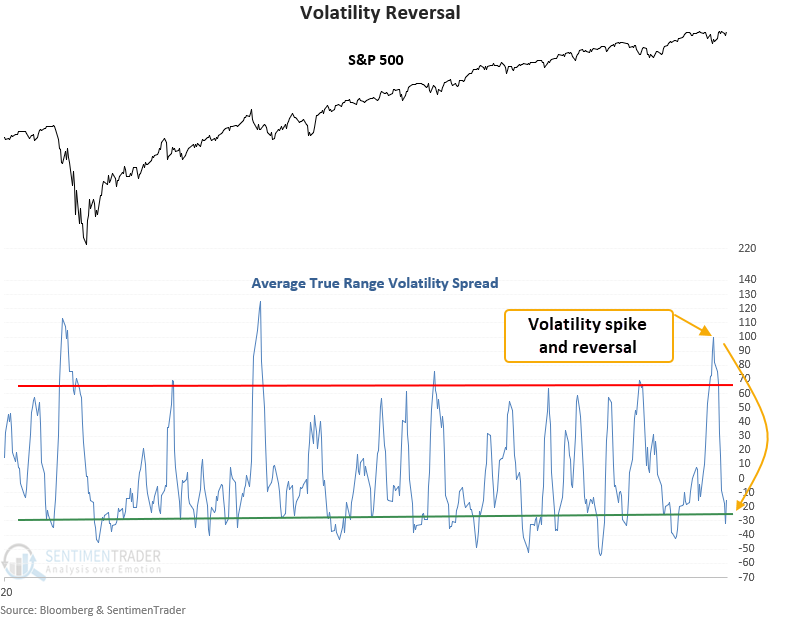
  • Price volatility recently spiked higher and subsequently reversed lower
  • A model based on the average true range indicator issued a buy signal
  • The S&P 500 rallied 88% of the time over the next 2 months after other signals

A price volatility model for identifying mean reversion opportunities

The S&P 500 has now cycled from a period of elevated volatility to a period of relative calm. This type of behavior often signals higher prices as investors become more comfortable with new buys.

The average true range spread signal identifies when a stock, ETF, or commodity reverses from a period of high volatility to low volatility in a quick manner. This same signal triggered an alert on 10/22/21, which shows a gain of 3.86% through 12/15/21.


Similar signals preceded gains 88% of the time

This signal has triggered 25 other times over the past 28 years. After the others, future returns and win rates were excellent on medium and long-term time frames. Consistency was outstanding in the 2 and 6-month time frames, with 21 out of 24 winners. And, the 6-month time frame is currently riding a 13 signal win streak.

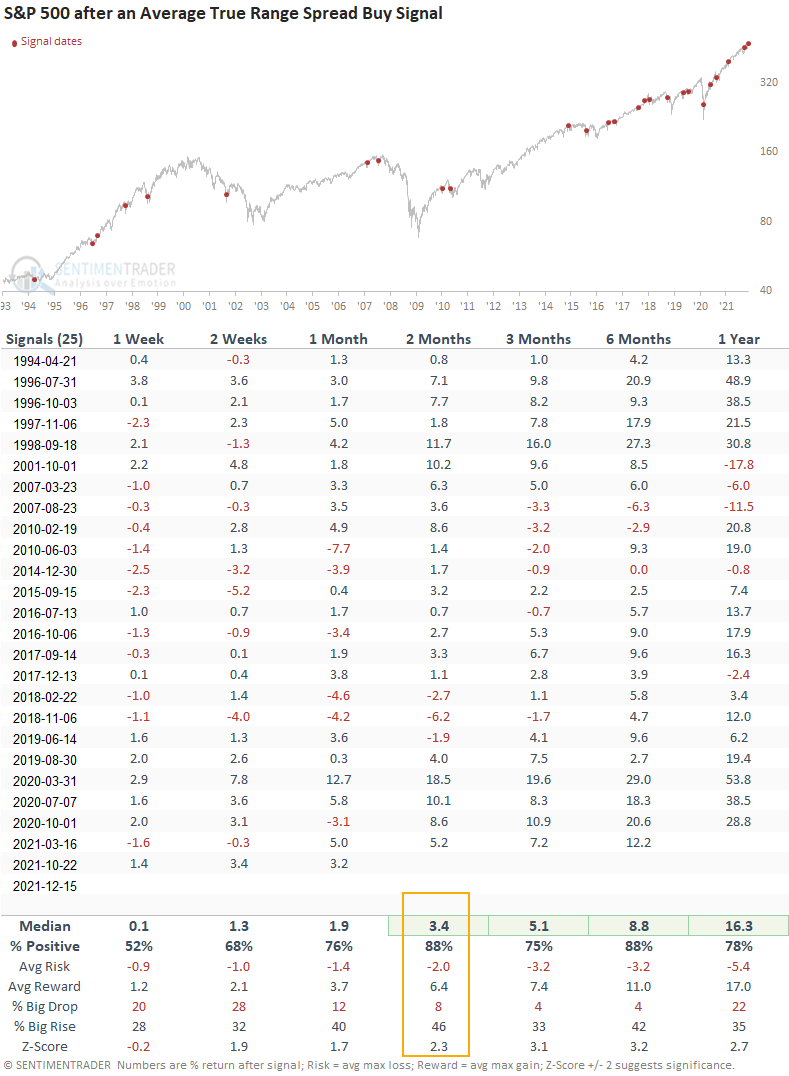
What the research tells us...

When the average true range spreads indicator cycles from high to low volatility, stocks tend to rise. Similar setups to what we're seeing now have preceded consistent gains on a medium and long-term basis with an 88% win rate 2 months later.

Sorry, you don't have access to this report

Upgrade your subscription plan to get access
Go to Dasboard
PRODUCTS
SentimenTrader
Trading Tools
Indicators & Data API
‍
Strategies & Scanner
‍
Research Reports
FREE
RESOUrCES
Simple Backtest
Calculator
Simple Seasonality
Calculator
The Kelly Criterion
Calculator
Sentiment Geo Map
‍
Public Research Reports
‍
Pricing
Bundle pricing
‍
Announcements
‍
FAQ
COMPANY
‍
About
‍
In the News
‍
Testimonials
‍
Client Success Stories
CONTACT
‍
General Inquiries
‍
Media Inquiries
‍
Financial Professionals Inquiries
‍
© 2025 Sundial Capital Research Inc. All rights reserved.
Setsail Marketing
TermsPrivacyAffiliate Program
Risk Disclosure: Futures and forex trading contains substantial risk and is not for every investor. An investor could potentially lose all or more than the initial investment. Risk capital is money that can be lost without jeopardizing ones’ financial security or life style. Only risk capital should be used for trading and only those with sufficient risk capital should consider trading. Past performance is not necessarily indicative of future results.

Hypothetical Performance Disclosure: Hypothetical performance results have many inherent limitations, some of which are described below. No representation is being made that any account will or is likely to achieve profits or losses similar to those shown; in fact, there are frequently sharp differences between hypothetical performance results and the actual results subsequently achieved by any particular trading program. One of the limitations of hypothetical performance results is that they are generally prepared with the benefit of hindsight. In addition, hypothetical trading does not involve financial risk, and no hypothetical trading record can completely account for the impact of financial risk of actual trading. for example, the ability to withstand losses or to adhere to a particular trading program in spite of trading losses are material points which can also adversely affect actual trading results. There are numerous other factors related to the markets in general or to the implementation of any specific trading program which cannot be fully accounted for in the preparation of hypothetical performance results and all which can adversely affect trading results.

Testimonial Disclosure: Testimonials appearing on this website may not be representative of other clients or customers and is not a guarantee of future performance or success.