Products
SentimenTrader Trading Tools
‍
Backtest Engine
My Trading Toolkit
Correlation Analysis
Seasonality
Market Prediction
Indicators & Data API
‍
Proprietary Indicators & Charts
Market Data API
Strategies & Scanner
‍
50+ Trading Strategies
Smart Stock Scanner
Smart Option Scanner
Research Reports
‍
Research Solutions
Reports Library
Free Resources
Simple Backtest Calculator
Simple Seasonality Calculator
The Kelly Criterion Calculator
Sentiment Geo Map
Public Research Reports
Education
Sentiment Indicators
Technical Indicators
Pricing
Company
About
In the News
Testimonials
Client Success Stories
Contact
Log inLoginSign up
< BACK TO ALL REPORTS

This pattern suggests the bear market is not over

Dean Christians
2022-07-15
The S&P 500 has declined for 5 consecutive days in a well-established downtrend. Similar conditions preceded negative returns for stocks across short and medium-term time frames.

Key points:

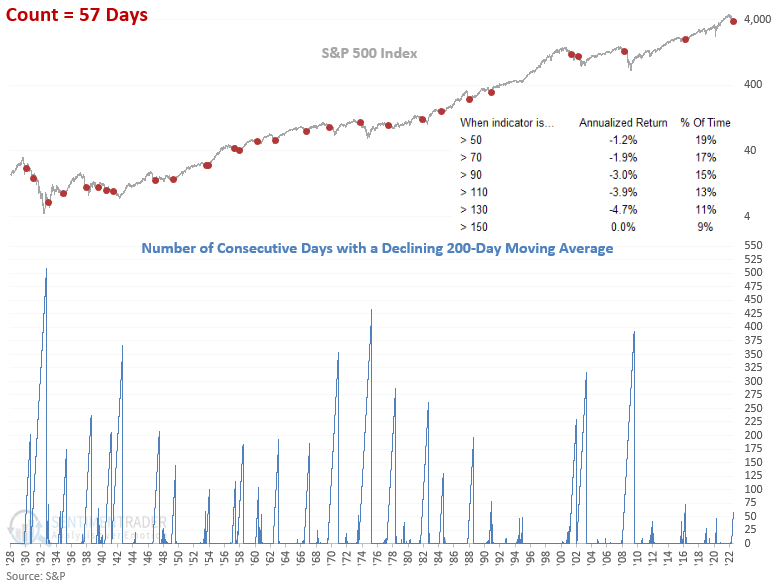
  • The S&P 500 has declined for 5 consecutive trading sessions
  • At the same time, the 200-day moving average for the S&P 500 has fallen for 57 straight days
  • Similar conditions preceded negative returns for stocks across short and medium-term time frames
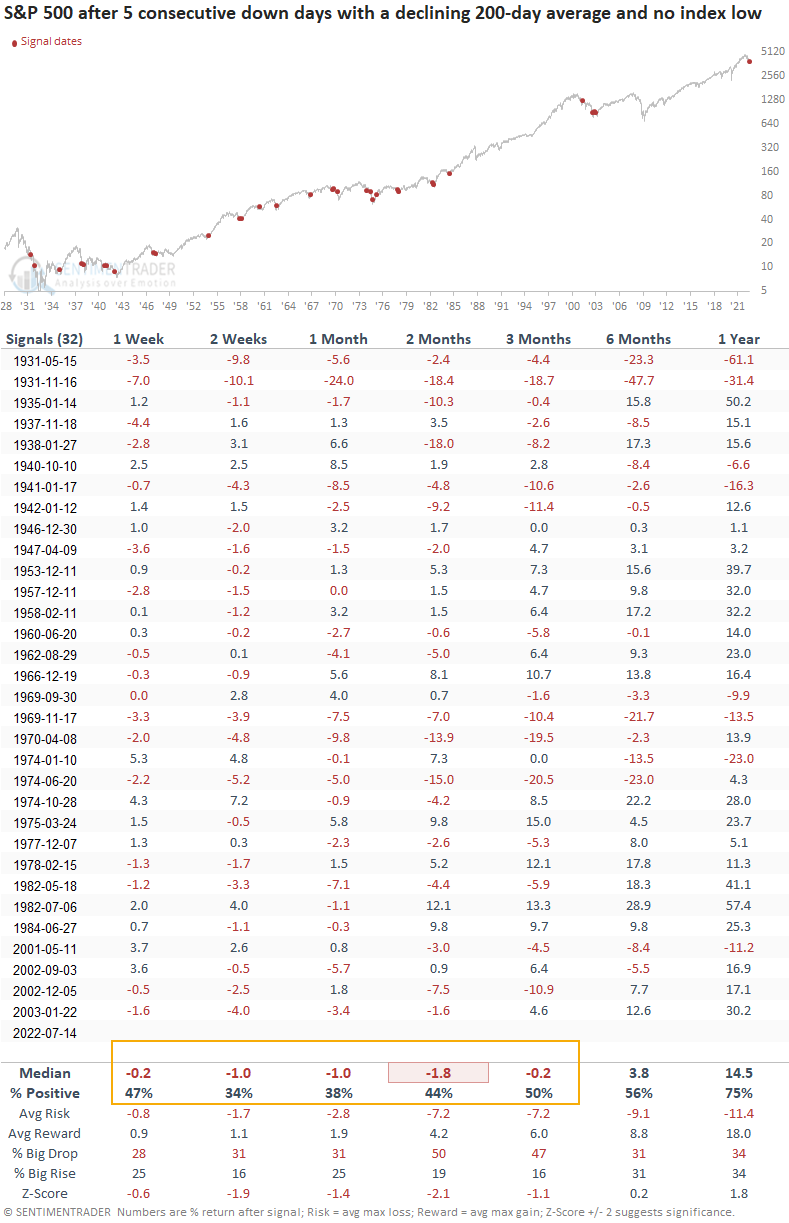
  • When I isolate instances that occurred when the index was above a low, the returns look even worse 

This price pattern suggests the S&P 500 could be heading for a lower low

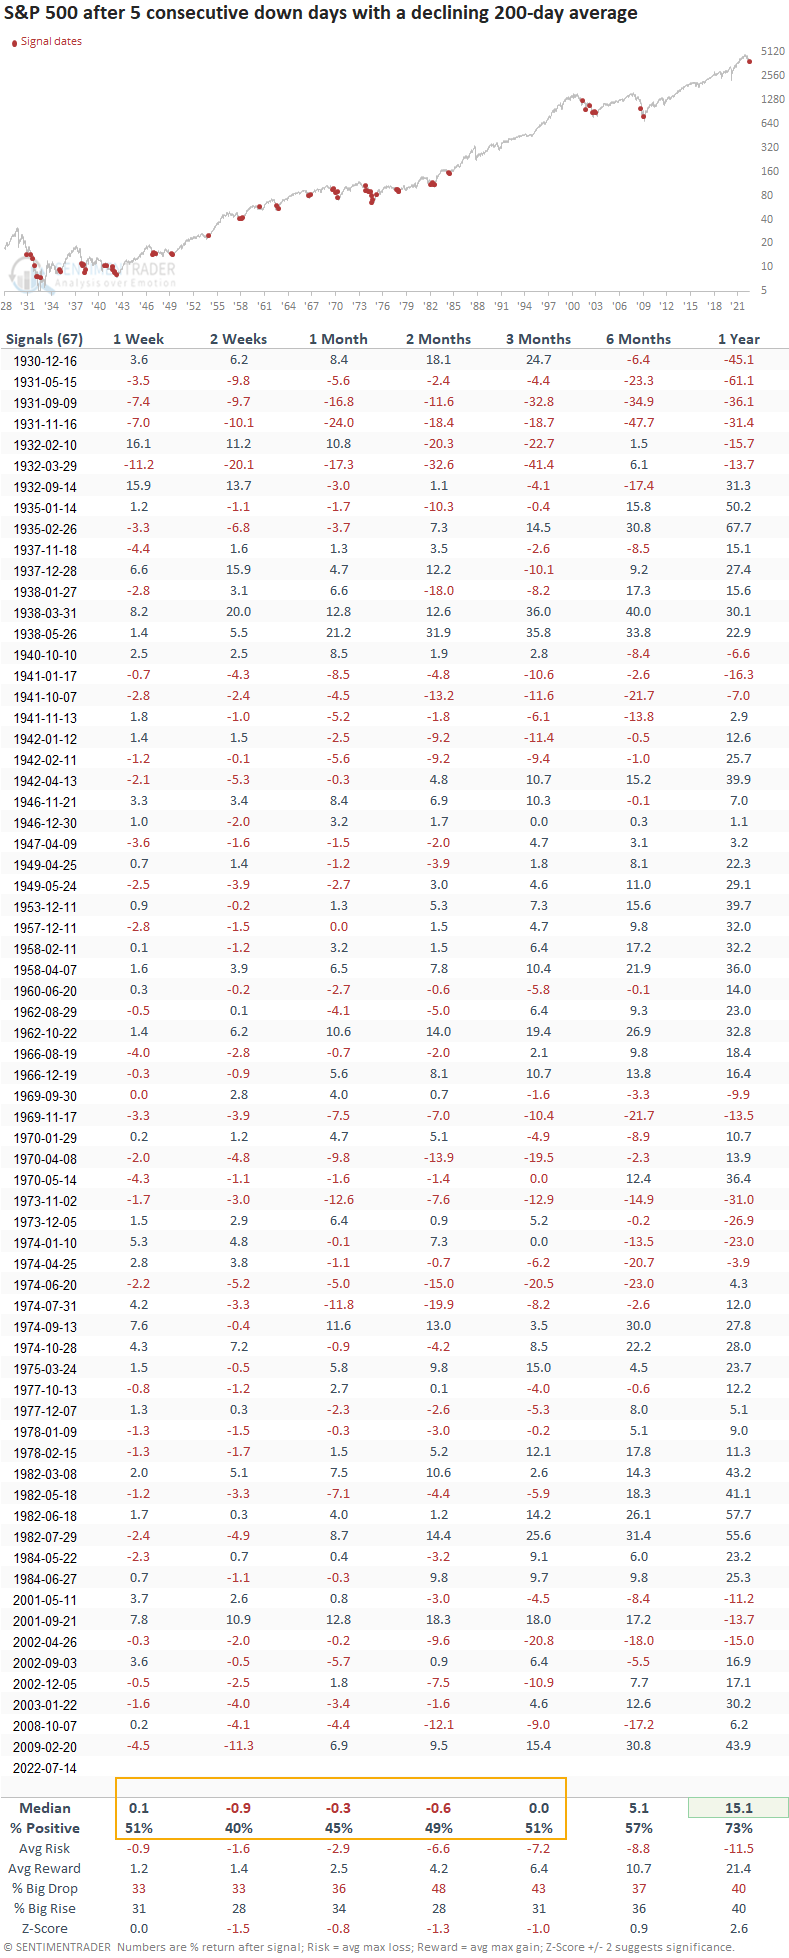
Let's conduct a study to assess the outlook for the S&P 500 when the index declines for 5 consecutive trading sessions and the slope of the 200-day moving average has fallen for 57 straight days or longer. I screened out repeats by requiring 1 month to pass before a new signal could trigger.

For only the 5th time in more than two decades and the 29th time since 1928, the slope of the 200-day moving average has fallen for 57 consecutive days. While the current downtrend is well-established, the slope count remains low relative to other bear market periods.

Similar price patterns preceded negative returns

This study generated a signal 67 other times over the past 92 years. After the others, S&P 500 returns, win rates, and z-scores were unfavorable across short and medium-term time frames. The signal had a negative return at some point in the first 3 months in 57 out of 66 instances.

What happens when the signal occurs, and the S&P 500 is not at a low

Let's add some context to the study. I will keep the original study parameters but now require that the S&P 500 does not close at a 21-day low at the time of a signal, which is the case now. This study generated a signal 32 other times over the past 91 years. After the others, S&P 500 returns, win rates, and z-scores were unfavorable across short and medium-term time frames, especially the 2-month window. The signal had a negative return at some point in the first 3 months in 31 out of 32 instances. So, the odds suggest the bear market is not over.

What the research tells us...

When the S&P 500 declines for 5 consecutive trading sessions and the slope of the 200-day moving average has fallen for 57 days or longer, we need to remember that the trend is not our friend. Similar setups to what we're seeing now have preceded falling stock prices across short and medium-term time frames. If the S&P 500 trades above a 21-day low when a signal occurs, performance looks even worse, and the odds suggest the bear market may not be over.

PRODUCTS
SentimenTrader
Trading Tools
Indicators & Data API
‍
Strategies & Scanner
‍
Research Reports
FREE
RESOUrCES
Simple Backtest
Calculator
Simple Seasonality
Calculator
The Kelly Criterion
Calculator
Sentiment Geo Map
‍
Public Research Reports
‍
Education
Sentiment Indicators
‍
Technical Indicators
‍
Pricing
Bundle pricing
‍
FAQ
‍
Announcements
‍
COMPANY
‍
About
‍
In the News
‍
Testimonials
‍
Client Success Stories
CONTACT
‍
General Inquiries
‍
Media Inquiries
‍
Financial Professionals Inquiries
‍
© 2026 Sundial Capital Research Inc. All rights reserved.
Setsail Marketing
TermsPrivacyAffiliate Program
Risk Disclosure: The information and tools provided are for research and analytical purposes only and are not intended as investment advice. Market analysis involves uncertainty, and outcomes may differ from expectations. Users should conduct their own due diligence and consider their individual circumstances before making any financial decisions. Past performance is not necessarily indicative of future results.

Hypothetical Performance Disclosure: Hypothetical performance results have many inherent limitations, some of which are described below. No representation is being made that any account will or is likely to achieve profits or losses similar to those shown; in fact, there are frequently sharp differences between hypothetical performance results and the actual results subsequently achieved by any particular trading program. One of the limitations of hypothetical performance results is that they are generally prepared with the benefit of hindsight. In addition, hypothetical trading does not involve financial risk, and no hypothetical trading record can completely account for the impact of financial risk of actual trading. for example, the ability to withstand losses or to adhere to a particular trading program in spite of trading losses are material points which can also adversely affect actual trading results. There are numerous other factors related to the markets in general or to the implementation of any specific trading program which cannot be fully accounted for in the preparation of hypothetical performance results and all which can adversely affect trading results.

Testimonial Disclosure: Testimonials appearing on this website may not be representative of other clients or customers and is not a guarantee of future performance or success.