Products
SentimenTrader Trading Tools
‍
Backtest Engine
My Trading Toolkit
Correlation Analysis
Seasonality
Market Prediction
Indicators & Data API
‍
Proprietary Indicators & Charts
Market Data API
Strategies & Scanner
‍
50+ Trading Strategies
Smart Stock Scanner
Smart Option Scanner
Research Reports
‍
Research Solutions
Reports Library
Free Resources
Simple Backtest Calculator
Simple Seasonality Calculator
The Kelly Criterion Calculator
Sentiment Geo Map
Public Research Reports
Education
Sentiment Indicators
Technical Indicators
Pricing
Company
About
In the News
Testimonials
Client Success Stories
Contact
Log inLoginSign up
< BACK TO ALL REPORTS

This pattern occurs during brutal bear markets

Dean Christians
2022-05-19
At the close of trading on Wednesday, a price pattern seen in some of the worst bear markets in history registered an alert. Let's assess the outlook for the S&P 500 after similar signals.

Key points:

  • The S&P 500 rallied more than 4% over 3 days and then declined by 4% on Wednesday
  • The 200-day moving average for the S&P 500 has fallen for 19 consecutive days
  • Similar conditions preceded negative returns for stocks in some of the most brutal bear markets in history
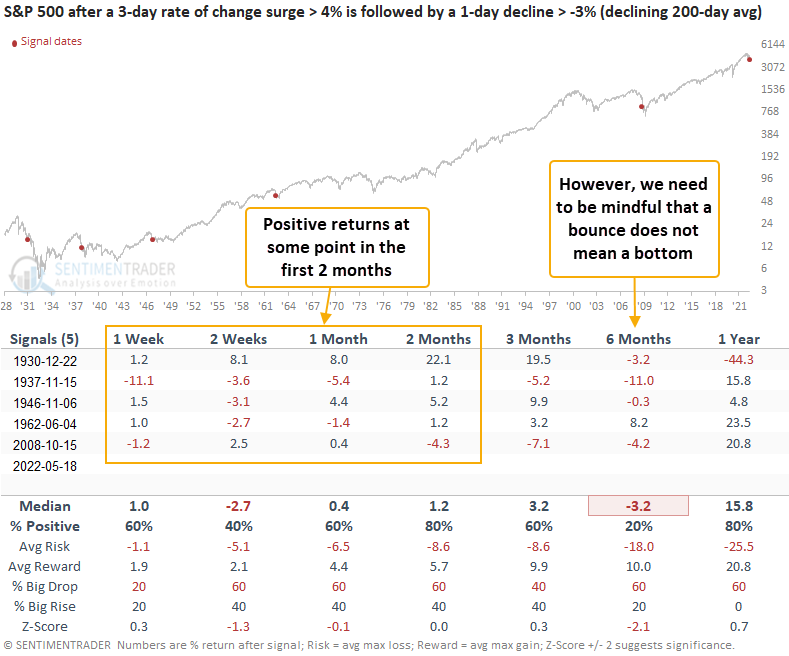
  • When I isolate the first signal in a bear market, we tend to see a multi-week bounce

This price pattern occurs during brutal bear markets

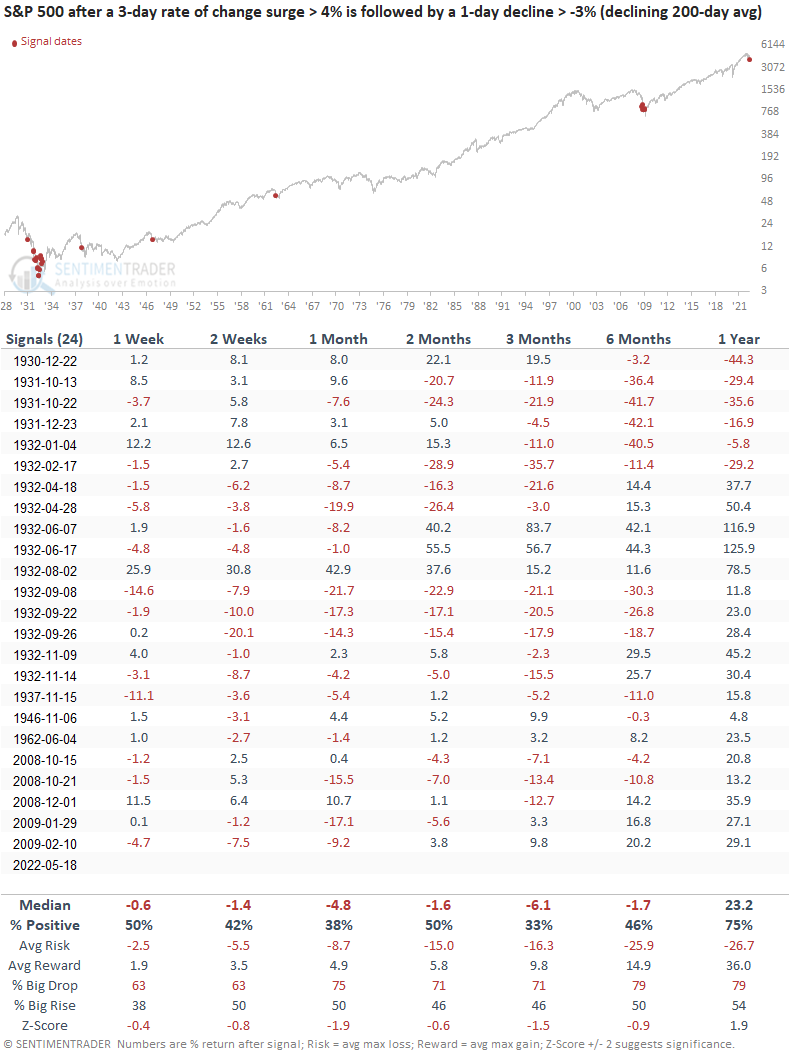
Let's conduct a study to assess the outlook for the S&P 500 when the index increases by 4% or more in a 3-day period and then subsequently declines by 3% or more on the following day. The study will require the 200-day moving average for the S&P 500 to be sloping downward for 15 consecutive sessions, which is a little less than now.


Similar price patterns preceded negative returns

This study generated a signal 24 other times over the past 92 years. After the others, S&P 500 returns, win rates, and risk/reward profiles were unfavorable across short and medium-term time frames. Interestingly, the pattern did not trigger in brutal bear markets like 1973-74 or 2000-02. Except for the 1929-32 period, the 1-year returns look favorable.

The first signal in a bear market

If we review the first signal in each bear market, the outlook table shows a positive return in every instance in the first 2 months. However, the 6-month window should remind us to utilize a trailing stop.

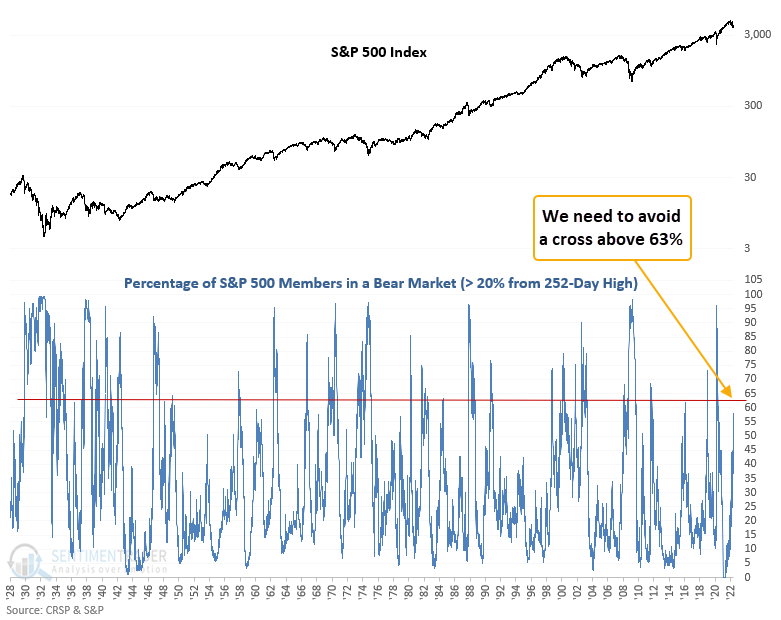
Where do we stand with an indicator that I'm monitoring closely

In a note on 5/11/22, I shared a study that suggested that if the number of S&P 500 members in a bear market could hold below 63%, the odds of a multi-week bounce looked compelling. So far, we remain below the critical level. You can monitor this indicator on the website. Click here. 

What the research tells us...

When the S&P 500 increases by 4% or more in 3 days and subsequently declines by 3% or more on the following day with a negative trend, we need to be mindful that we are in a brutal bear market environment. Similar setups to what we're seeing now have preceded falling stock prices across short and medium-term time frames. However, the first signal in a downtrend can often lead to a bear market bounce. As always, manage risk appropriately.

The environment remains highly challenging given that the stock market shows all the signs of a brutal bear market typically associated with a recession, yet the Federal Reserve remains hostile.

PRODUCTS
SentimenTrader
Trading Tools
Indicators & Data API
‍
Strategies & Scanner
‍
Research Reports
FREE
RESOUrCES
Simple Backtest
Calculator
Simple Seasonality
Calculator
The Kelly Criterion
Calculator
Sentiment Geo Map
‍
Public Research Reports
‍
Education
Sentiment Indicators
‍
Technical Indicators
‍
Pricing
Bundle pricing
‍
FAQ
‍
Announcements
‍
COMPANY
‍
About
‍
In the News
‍
Testimonials
‍
Client Success Stories
CONTACT
‍
General Inquiries
‍
Media Inquiries
‍
Financial Professionals Inquiries
‍
© 2026 Sundial Capital Research Inc. All rights reserved.
Setsail Marketing
TermsPrivacyAffiliate Program
Risk Disclosure: The information and tools provided are for research and analytical purposes only and are not intended as investment advice. Market analysis involves uncertainty, and outcomes may differ from expectations. Users should conduct their own due diligence and consider their individual circumstances before making any financial decisions. Past performance is not necessarily indicative of future results.

Hypothetical Performance Disclosure: Hypothetical performance results have many inherent limitations, some of which are described below. No representation is being made that any account will or is likely to achieve profits or losses similar to those shown; in fact, there are frequently sharp differences between hypothetical performance results and the actual results subsequently achieved by any particular trading program. One of the limitations of hypothetical performance results is that they are generally prepared with the benefit of hindsight. In addition, hypothetical trading does not involve financial risk, and no hypothetical trading record can completely account for the impact of financial risk of actual trading. for example, the ability to withstand losses or to adhere to a particular trading program in spite of trading losses are material points which can also adversely affect actual trading results. There are numerous other factors related to the markets in general or to the implementation of any specific trading program which cannot be fully accounted for in the preparation of hypothetical performance results and all which can adversely affect trading results.

Testimonial Disclosure: Testimonials appearing on this website may not be representative of other clients or customers and is not a guarantee of future performance or success.