Products
SentimenTrader Trading Tools
‍
Backtest Engine
My Trading Toolkit
Correlation Analysis
Seasonality
Market Prediction
Indicators & Data API
‍
Proprietary Indicators & Charts
Market Data API
Strategies & Scanner
‍
50+ Trading Strategies
Smart Stock Scanner
Smart Option Scanner
Research Reports
‍
Research Solutions
Reports Library
Free Resources
Simple Backtest Calculator
Simple Seasonality Calculator
The Kelly Criterion Calculator
Sentiment Geo Map
Public Research Reports
Education
Sentiment Indicators
Technical Indicators
Pricing
Company
About
In the News
Testimonials
Client Success Stories
Contact
Log inLoginSign up
< BACK TO ALL REPORTS

This momentum signal suggests caution for stocks

Dean Christians
2022-04-27
Momentum for sub-industry groups has reversed lower, triggering a signal that suggests one should maintain a cautious outlook on stocks.

Key points:

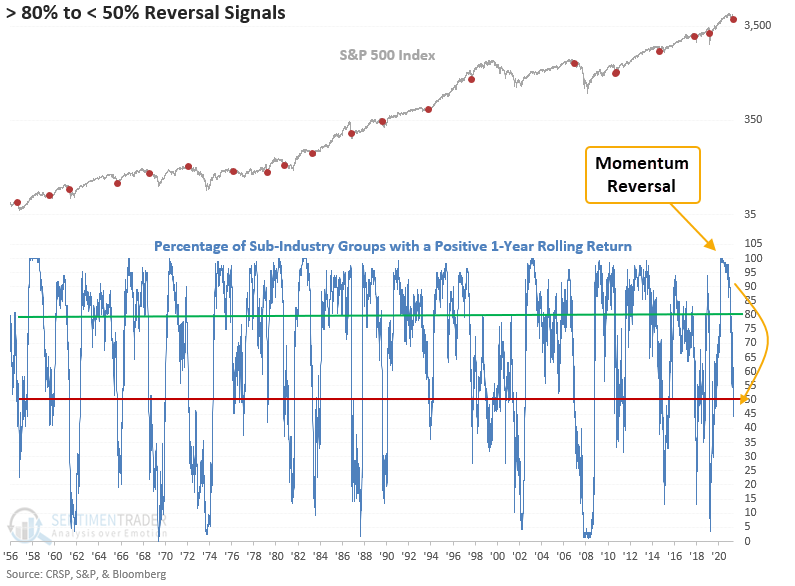
  • The number of sub-industry groups with a positive 1-year rolling return crossed below 50%
  • The decline occurred after a significant number of groups had positive momentum
  • The S&P 500 shows negative returns in the 2 & 3-month time frames 

Negative momentum begets more negative momentum

The number of S&P 1500 sub-industry groups with a positive 1-year rolling return fell below 50% on Tuesday. The downward shift in momentum occurred after more than 80% of the groups had positive returns as recently as February 2022.

Let's assess the outlook for stocks after the number of sub-industry groups with a positive 1-year rolling return cross below 50% with a reset condition of 80% to identify instances similar to the current one.


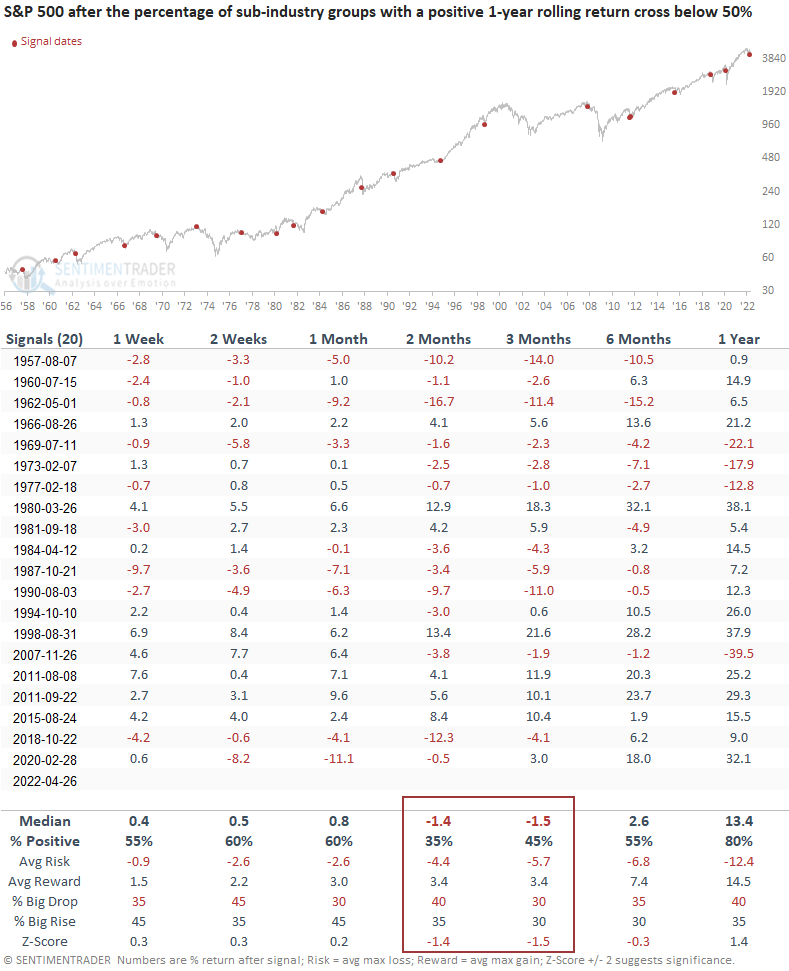
Similar reversals in momentum preceded negative returns for the S&P 500

This study generated a signal 20 other times over the past 65 years. After the others, S&P 500 future returns, win rates, and risk/reward profiles look okay in the short term. Recent signals in the 1-week time frame suggest there's a chance for an oversold bounce. However, the 2 & 3-month windows show negative returns with z-scores approaching significance. In 19 out of 20 instances, the S&P 500 closed below the signal date close in the next few months. I would note that the lower close for the 3/26/80 signal occurred one day later. And while the 8/31/1998 signal marked the low, the S&P 500 got within 2 points of that close on a retest in October.

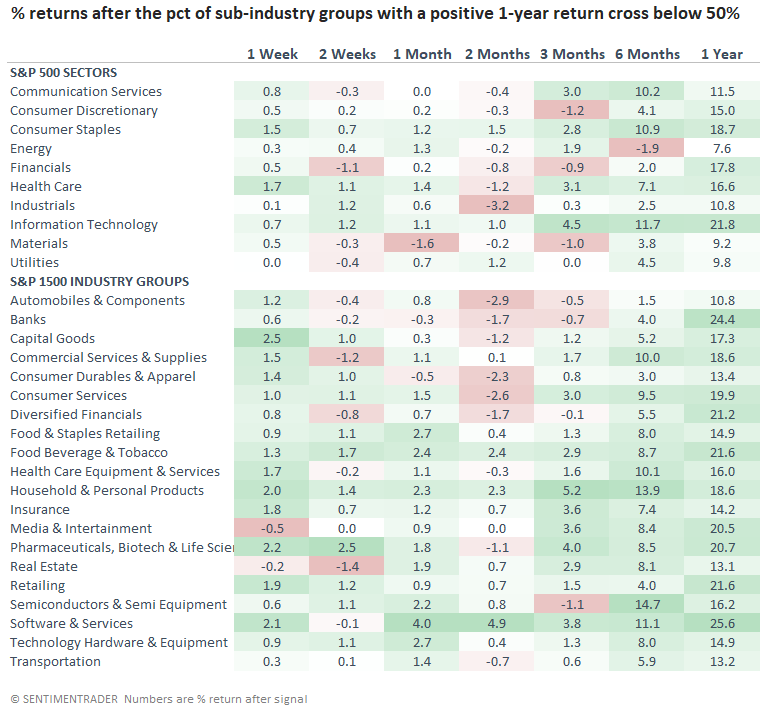
Sectors and industry group performance after signals

The sector and industry group outlook confirms the cautionary stance for the broad market in the 2 & 3-month time frames, especially for cyclical/value groups like industrials, financials, and consumer discretionary.

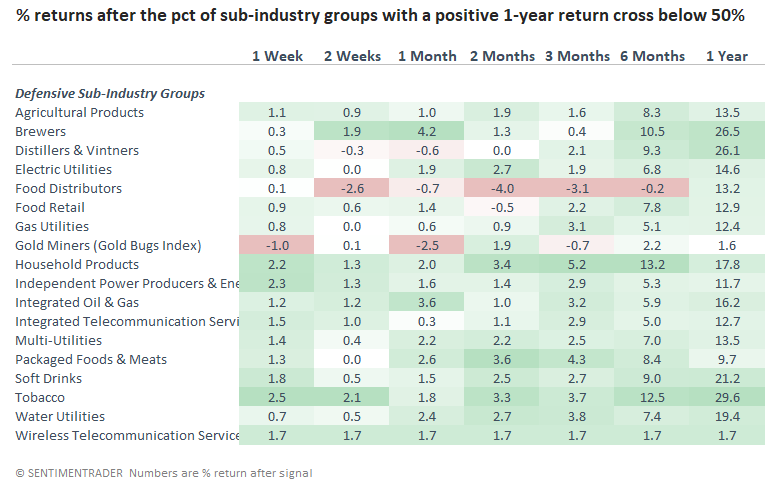
Defensive sub-industry group performance after signals

The following table contains 18 sub-industry groups that have performed the best in every bear market since 1957. So, if you're concerned about the outlook for the market, performance amongst these groups looks solid after sub-industry momentum signals.

What the research tells us...

When the number of sub-industry groups with a positive 1-year rolling return crosses below 50% after a reset above 80%, the downward shift in momentum begets more adverse price action for stocks on a medium-term basis. Similar setups to what we're seeing now have preceded negative returns and unfavorable risk/reward profiles in the 2 & 3-month time frames. The signal also suggests we should underweight cyclical/value-oriented groups and overweight defensive stocks in our portfolio.

PRODUCTS
SentimenTrader
Trading Tools
Indicators & Data API
‍
Strategies & Scanner
‍
Research Reports
FREE
RESOUrCES
Simple Backtest
Calculator
Simple Seasonality
Calculator
The Kelly Criterion
Calculator
Sentiment Geo Map
‍
Public Research Reports
‍
Education
Sentiment Indicators
‍
Technical Indicators
‍
Pricing
Bundle pricing
‍
FAQ
‍
Announcements
‍
COMPANY
‍
About
‍
In the News
‍
Testimonials
‍
Client Success Stories
CONTACT
‍
General Inquiries
‍
Media Inquiries
‍
Financial Professionals Inquiries
‍
© 2026 Sundial Capital Research Inc. All rights reserved.
Setsail Marketing
TermsPrivacyAffiliate Program
Risk Disclosure: The information and tools provided are for research and analytical purposes only and are not intended as investment advice. Market analysis involves uncertainty, and outcomes may differ from expectations. Users should conduct their own due diligence and consider their individual circumstances before making any financial decisions. Past performance is not necessarily indicative of future results.

Hypothetical Performance Disclosure: Hypothetical performance results have many inherent limitations, some of which are described below. No representation is being made that any account will or is likely to achieve profits or losses similar to those shown; in fact, there are frequently sharp differences between hypothetical performance results and the actual results subsequently achieved by any particular trading program. One of the limitations of hypothetical performance results is that they are generally prepared with the benefit of hindsight. In addition, hypothetical trading does not involve financial risk, and no hypothetical trading record can completely account for the impact of financial risk of actual trading. for example, the ability to withstand losses or to adhere to a particular trading program in spite of trading losses are material points which can also adversely affect actual trading results. There are numerous other factors related to the markets in general or to the implementation of any specific trading program which cannot be fully accounted for in the preparation of hypothetical performance results and all which can adversely affect trading results.

Testimonial Disclosure: Testimonials appearing on this website may not be representative of other clients or customers and is not a guarantee of future performance or success.