
This manufacturing survey suggests economic growth continues to slow

Key points:
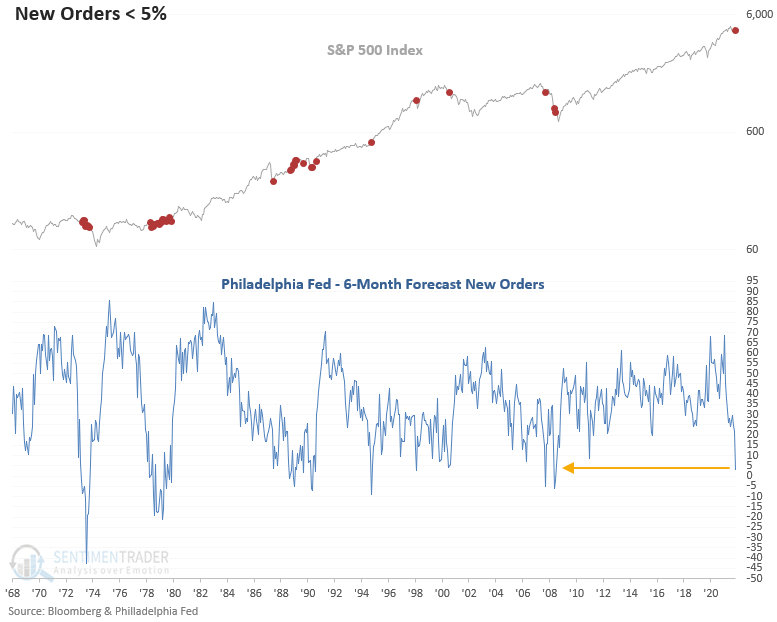
- The Philadelphia Fed 6-month forecast for new orders fell to 3.7% in April
- That's the lowest level for the survey since October 2008
- A broader measure of manufacturing and economic indicators suggests growth deceleration
- The S&P 500 shows flat returns for up to 6 months after similar declines
The 6-month forecast for new orders as a leading indicator
The Philadelphia Federal Reserve's monthly manufacturing survey, which targets CEOs, is conducted in the first week of each month and released on the third Thursday. So, the regional survey can potentially indicate the future direction of a broader survey like the ISM manufacturing report, released in the following month. One of the survey components is the 6-month forecast for new orders. The forecast provides us with an inside look at potential future business plans.
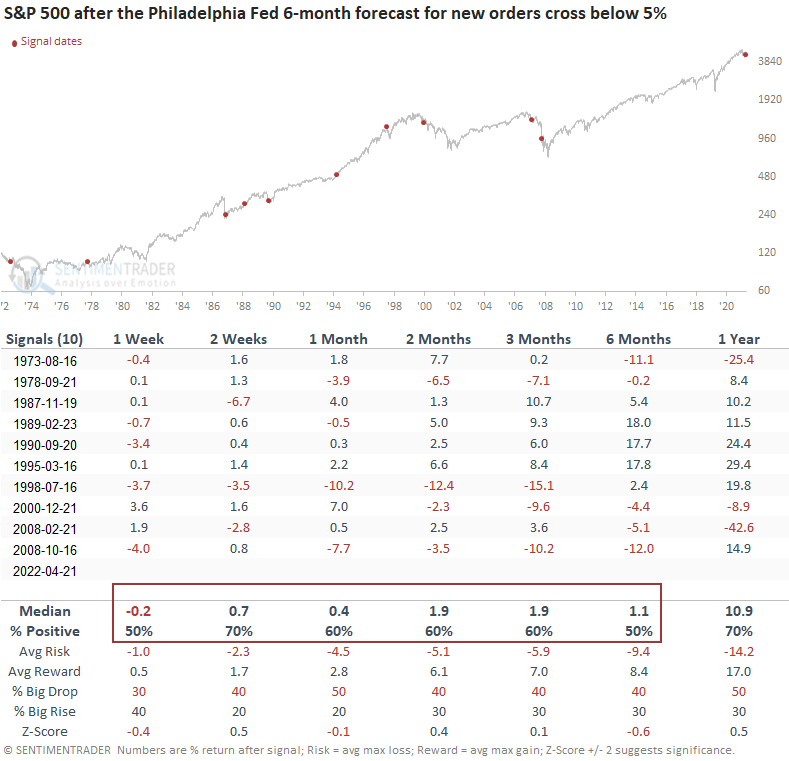
Let's assess the outlook for manufacturing, a broad economic index, and the stock market when the Philadelphia Fed 6-month forecast for new orders index falls below 5%. I will use a reset condition that requires the index to cross above 25% before a new signal can trigger again.
The 6-month forecast for new orders has fallen to the lowest level since October 2008.
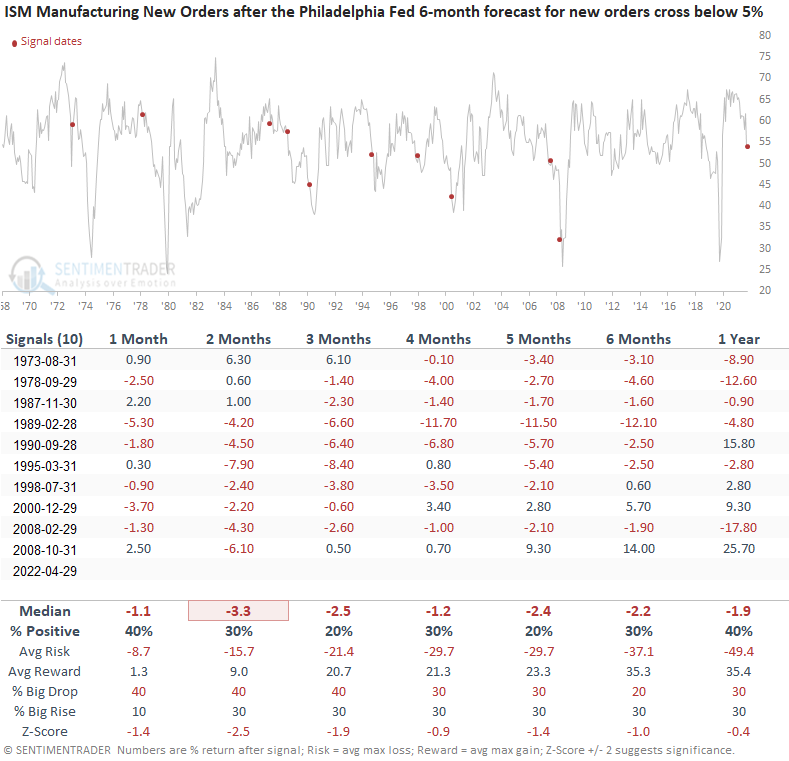
What happens to the ISM Manufacturing New Orders Index after signals
Applying the Philly Fed forecast signal dates to the ISM news orders index suggests a potential decline in new orders in the coming months. With the latest ISM new orders index at 53%, this sub-component could fall out of expansion territory.
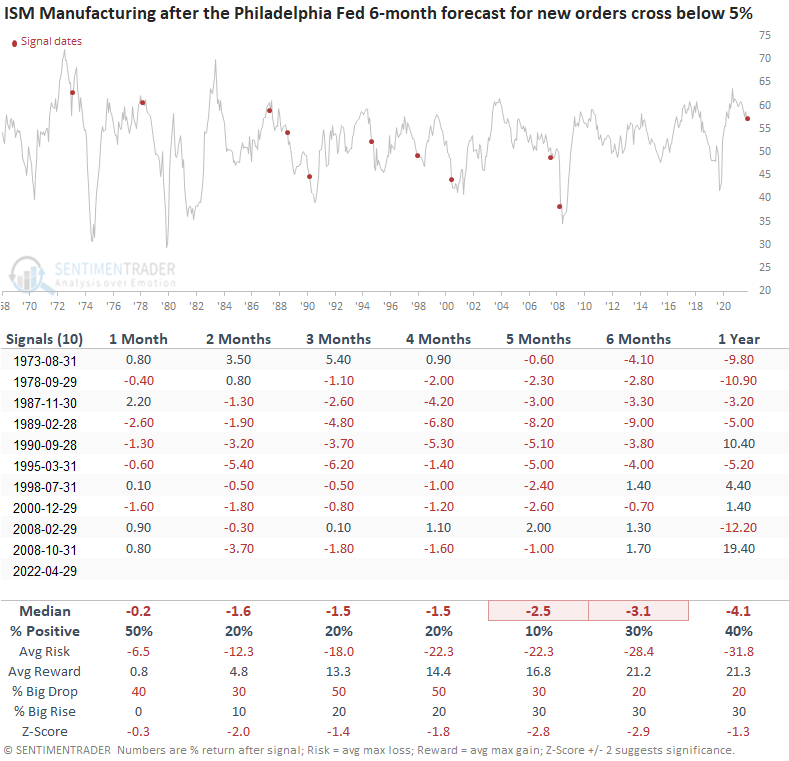
What happens to the ISM Manufacturing Index after signals
Applying the Philly Fed forecast signal dates to the ISM manufacturing index suggests a potential decline in the coming months. With the most recent ISM manufacturing index reading of 57.1%, it's difficult to say whether this broad measure of manufacturing would fall into contraction territory. However, I suspect it gets close.
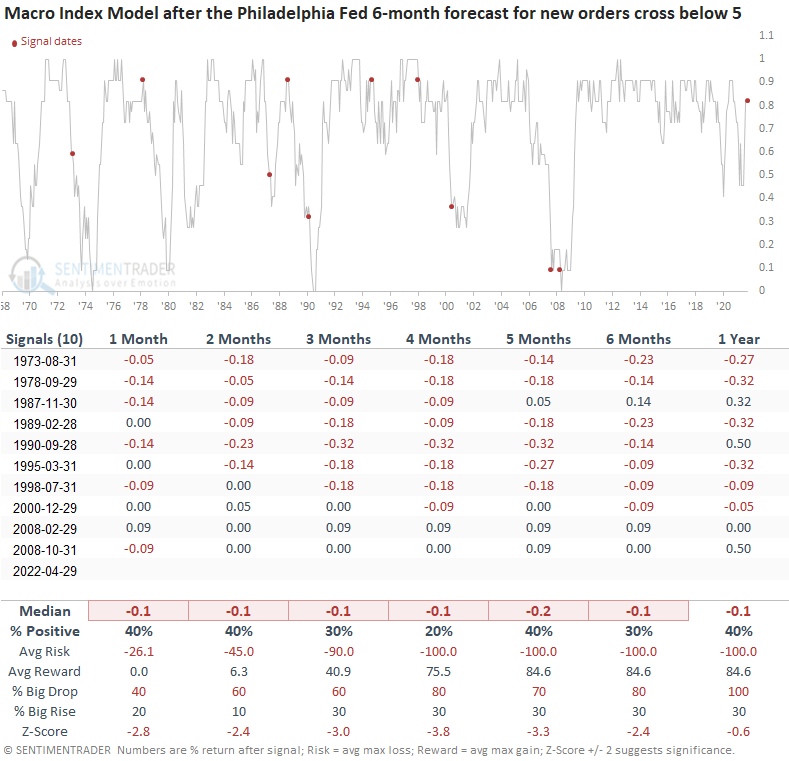
What happens to the Macro Index Model after signals
Applying the Philly Fed forecast signal dates to the SentimenTrader Macro Index Model suggests the index will likely fall below the favorable 70% level in the coming months. So, even though the U.S. economy is driven more by service-oriented industries, the broad economy could decelerate.
Similar signals preceded flat returns for the S&P 500
This study generated a signal 10 other times over the past 49 years. After the others, S&P 500 future returns look flat across short and medium-term time frames. 1995 is the only instance where the S&P 500 did not see a lower close at some point in the first 6 months.
I adjusted the signal dates to reflect the third Thursday of each month. i.e., the release day.
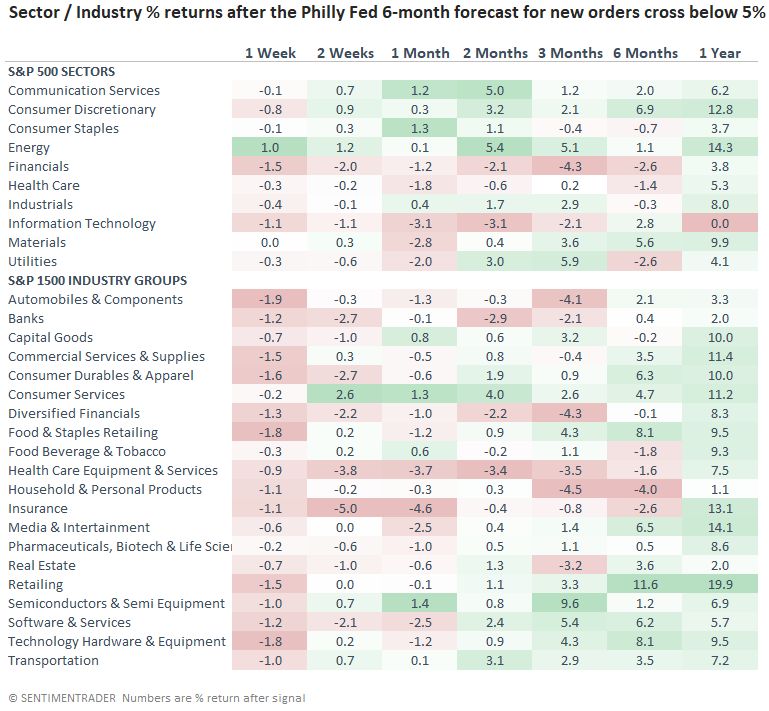
Sectors and industry group performance after signals
The sector and industry group outlook suggests a cautionary stance, especially for financials and technology.
What the research tells us...
When the Philadelphia Fed 6-month forecast for new orders falls below 5%, the survey suggests CEOs are concerned about the future outlook for growth in the manufacturing sector. Similar setups to what we're seeing now have preceded a deceleration in a broader manufacturing survey and a spillover effect to a wide-ranging basket of economic indicators. A review of the S&P 500, sectors, and industries suggests we should be mindful that we could be in a low return environment for the next 6 months.