Products
SentimenTrader Trading Tools
‍
Backtest Engine
My Trading Toolkit
Correlation Analysis
Seasonality
Market Prediction
Indicators & Data API
‍
Proprietary Indicators & Charts
Market Data API
Strategies & Scanner
‍
50+ Trading Strategies
Smart Stock Scanner
Smart Option Scanner
Research Reports
‍
Research Solutions
Reports Library
Free Resources
Simple Backtest Calculator
Simple Seasonality Calculator
The Kelly Criterion Calculator
Sentiment Geo Map
Public Research Reports
Education
Sentiment Indicators
Technical Indicators
Pricing
Company
About
In the News
Testimonials
Client Success Stories
Contact
Log inLoginSign up
< BACK TO ALL REPORTS

This is one of the most important markers of a healthy market

Jason Goepfert
2020-06-19
Most stocks, industries, sectors, and worldwide equity markets remain below their 200-day moving averages, an unhealthy market environment.

When it comes down to brass tacks, investing sounds simple. Buy stocks when investors are pessimistic during healthy market environments, and sell them when investors are optimistic during unhealthy ones.

Like most things, the difficulty comes in the implementation, where theory meets practice. The biggest challenge is defining pessimism and optimism and determining what is healthy and what is not.

One of the better ways to define the latter is by watching how many stocks and indexes can maintain longer-term trends. The default tends to be the 200-day moving average, which in all of our testing has served about as well as any other trend measure, with the added bonus of being simple.

Since February, most days have seen fewer than 60% of stocks in the S&P trading above their 200-day averages. It poked above that threshold a couple of weeks ago and then dropped right back below. That is not what typically happens during healthy markets. The same phenomenon can be seen among major industry groups and sectors.

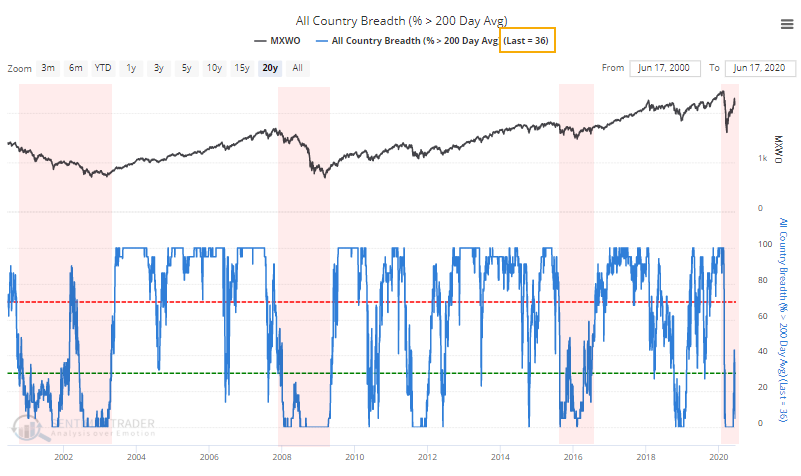
Even worldwide, with most major global indexes now trading below their 200-day averages again. 

Percentage of countries above 200 day moving average

This isn't necessarily a death knell for the rally. Whenever we're in a period of extreme volatility, these figures can jump around some. They're not meant for day trading, they're meant to help us identify periods of long-term healthy and unhealthy markets, and we should watch how they behave over periods of weeks or even months.


This is an abridged version of our recent reports and notes. For immediate access with no obligation, sign up for a 30-day free trial now.

We also looked at:

  • Charts showing the % of stocks, industries, and sectors trading above their 200-day moving averages
  • What happens among sectors and factors during summers when a Democrat vs Republican wins the White House
  • The Conference Board's Leading Indicator metric has turned up from a low level
  • Earnings revisions are turning up, too
  • Gamma exposure shows risks from the options market
  • The put/call ratio shows extreme complacency at the moment
PRODUCTS
SentimenTrader
Trading Tools
Indicators & Data API
‍
Strategies & Scanner
‍
Research Reports
FREE
RESOUrCES
Simple Backtest
Calculator
Simple Seasonality
Calculator
The Kelly Criterion
Calculator
Sentiment Geo Map
‍
Public Research Reports
‍
Education
Sentiment Indicators
‍
Technical Indicators
‍
Pricing
Bundle pricing
‍
FAQ
‍
Announcements
‍
COMPANY
‍
About
‍
In the News
‍
Testimonials
‍
Client Success Stories
CONTACT
‍
General Inquiries
‍
Media Inquiries
‍
Financial Professionals Inquiries
‍
© 2026 Sundial Capital Research Inc. All rights reserved.
Setsail Marketing
TermsPrivacyAffiliate Program
Risk Disclosure: The information and tools provided are for research and analytical purposes only and are not intended as investment advice. Market analysis involves uncertainty, and outcomes may differ from expectations. Users should conduct their own due diligence and consider their individual circumstances before making any financial decisions. Past performance is not necessarily indicative of future results.

Hypothetical Performance Disclosure: Hypothetical performance results have many inherent limitations, some of which are described below. No representation is being made that any account will or is likely to achieve profits or losses similar to those shown; in fact, there are frequently sharp differences between hypothetical performance results and the actual results subsequently achieved by any particular trading program. One of the limitations of hypothetical performance results is that they are generally prepared with the benefit of hindsight. In addition, hypothetical trading does not involve financial risk, and no hypothetical trading record can completely account for the impact of financial risk of actual trading. for example, the ability to withstand losses or to adhere to a particular trading program in spite of trading losses are material points which can also adversely affect actual trading results. There are numerous other factors related to the markets in general or to the implementation of any specific trading program which cannot be fully accounted for in the preparation of hypothetical performance results and all which can adversely affect trading results.

Testimonial Disclosure: Testimonials appearing on this website may not be representative of other clients or customers and is not a guarantee of future performance or success.