Data &
Technology
Research
Reports
Report Solutions
Reports Library
Actionable
Strategies
Free
Resources
Simple Backtest Calculator
Simple Seasonality Calculator
The Kelly Criterion Calculator
Sentiment Geo Map
Public Research Reports
Free Webinar
Pricing
Company
About
Meet Our Team
In the News
Testimonials
Client Success Stories
Contact
Log inLoginSign up
< BACK TO ALL REPORTS

This Indicator Shows Hedge Funds are Panic Buying

Jason Goepfert
2021-07-13
Hedge fund exposure to stocks has jumped in recent weeks to the highest in over a year.

We already know that small options traders, among many others, have been jumping once again into speculative trades. Now we can add hedge funds to the mix.

Many of them have had a rough start to the year, and now seem intent on making up for lost ground. Per the Wall Street Journal.

"Client notes from both Morgan Stanley and Goldman Sachs Group Inc. showed that fundamental stock-picking hedge funds posted negative alpha-trader shorthand for poor performance-in the first half of the year.

Part of the challenge for professional stock pickers is that markets have been heavily rotational, Mr. Dowling and several fund managers said. Markets this year have whipped back and forth between growth stocks and value stocks, making it difficult for managers to find winning trades."

The latest estimate of Hedge Fund Exposure shows that funds are nearly 40% net long stocks, a quick rise from almost being flat a month ago. Over the past few years, when it has climbed this high, the S&P ended up giving any further gains back, though it took a long time to play out during the momentum market immediately prior to the pandemic crash.

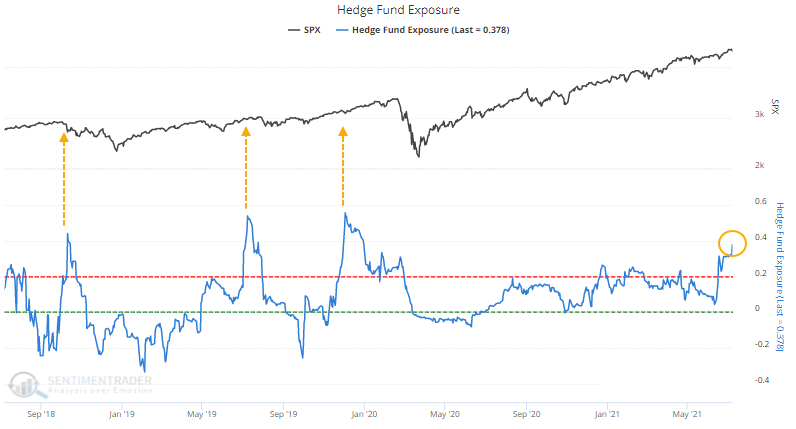
After any day since 2003 when Exposure was below zero, the S&P 500 returned an annualized 15.2%, versus only 1.4% when Exposure was above 25% as it is now.

In stocks, we continue to see a frustrating dichotomy between momentum and, well, pretty much everything else. Momentum has clearly been winning and anything counter to that has looked idiotic. Markets cycle between rewarding certain strategies over others but this has been a historically long stretch.


What else we're looking at

  • Full returns following a spike in Hedge Fund Exposure above 35%
  • How hedge funds appear to be positioned in bonds and the U.S. dollar
  • An update on absolute and relative trends in sector, industry, and country ETFs
  • A major update on corn and its prospects for the coming months

Stat box

On Monday, 45% of major S&P 500 sectors reached a 52-week high, the most in more than 2 months. Our Backtest Engine shows that over the past 5 years, there were 33 days with this many new sector highs and the S&P rallied over the next 3 months after 14 of those days.

Etcetera

Momentum market. With a 5-month streak, the S&P 500 has triggered the kind of momentum rarely seen in its history. This quick video shows it never lost ground over the next year after other signals.

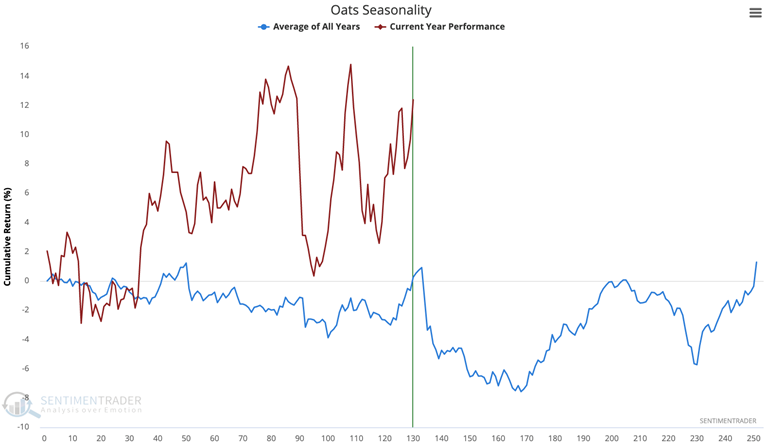
Ostentatious oats. Oat prices have mostly followed their typical seasonal pattern this year. For bulls, this could be an issue because the contract has tended to see its summer peak in mid-July.

oats seasonality

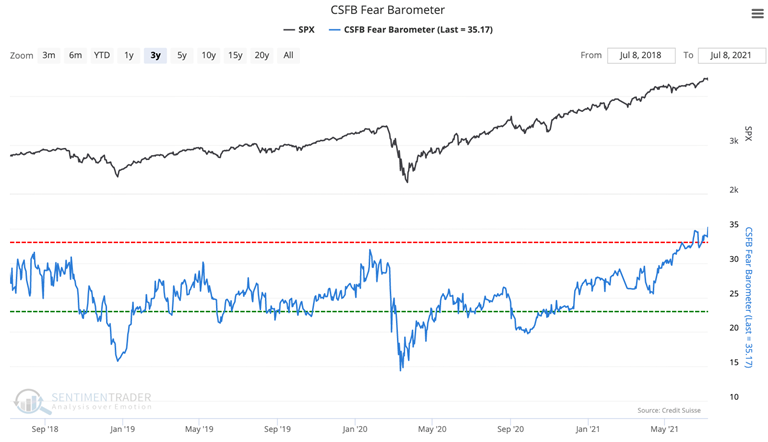
Scaredy cats. The CSFB Fear Barometer is at its highest point in the last three years. Like the SKEW index, this is showing that some investors are paying up for protective hedges.

csfb fear barometer

DATA &
TECHnologies
IndicatorEdge
‍
BackTestEdge
‍
Other Tools
‍
DataEdge API
RESEARCH
reports
Research Solution
‍
Reports Library
‍
actionable
Strategies
Trading Strategies
‍
Smart Stock Scanner
‍
FREE
RESOUrCES
Simple Backtest
Calculator
Simple Seasonality
Calculator
The Kelly Criterion
Calculator
Sentiment Geo Map
‍
Public Research Reports
‍
Free Webinar
COMPANY
‍
About
‍
Meet our Team
‍
In the News
‍
Testimonials
‍
Client Success Stories
Pricing
Bundle pricing
‍
Announcements
‍
FAQ
© 2024 Sundial Capital Research Inc. All rights reserved.
Setsail Marketing
TermsPrivacyAffiliate Program
Risk Disclosure: Futures and forex trading contains substantial risk and is not for every investor. An investor could potentially lose all or more than the initial investment. Risk capital is money that can be lost without jeopardizing ones’ financial security or life style. Only risk capital should be used for trading and only those with sufficient risk capital should consider trading. Past performance is not necessarily indicative of future results.

Hypothetical Performance Disclosure: Hypothetical performance results have many inherent limitations, some of which are described below. No representation is being made that any account will or is likely to achieve profits or losses similar to those shown; in fact, there are frequently sharp differences between hypothetical performance results and the actual results subsequently achieved by any particular trading program. One of the limitations of hypothetical performance results is that they are generally prepared with the benefit of hindsight. In addition, hypothetical trading does not involve financial risk, and no hypothetical trading record can completely account for the impact of financial risk of actual trading. for example, the ability to withstand losses or to adhere to a particular trading program in spite of trading losses are material points which can also adversely affect actual trading results. There are numerous other factors related to the markets in general or to the implementation of any specific trading program which cannot be fully accounted for in the preparation of hypothetical performance results and all which can adversely affect trading results.

Testimonial Disclosure: Testimonials appearing on this website may not be representative of other clients or customers and is not a guarantee of future performance or success.