Data &
Technology
Research
Reports
Report Solutions
Reports Library
Actionable
Strategies
Free
Resources
Simple Backtest Calculator
Simple Seasonality Calculator
The Kelly Criterion Calculator
Sentiment Geo Map
Public Research Reports
Free Webinar
Pricing
Company
About
Meet Our Team
In the News
Testimonials
Client Success Stories
Contact
Log inLoginSign up
< BACK TO ALL REPORTS

This Indicator Predicts Stocks Will Lose 36% Through 2023

Jason Goepfert
2021-06-18
Household allocations to stocks and mutual funds have climbed to 36.5% of all financial assets, a record high.

Consumers are flush, and they've got a whole lot riding on markets.

The latest Federal Reserve data on household assets, just released with a delay for Q1, shows that once again, equities have pushed to a record relative to all household financial assets. At 36.5% of all assets, mutual funds and equities account for a greater share than any point since at least 1952.

The chart below shows this measure against the S&P 500's return over the next decade. There has been a clear negative correlation, meaning that as households allocate more of their assets to stocks, future returns on those stocks decrease. 

Ratio of household stock allocation to total assets

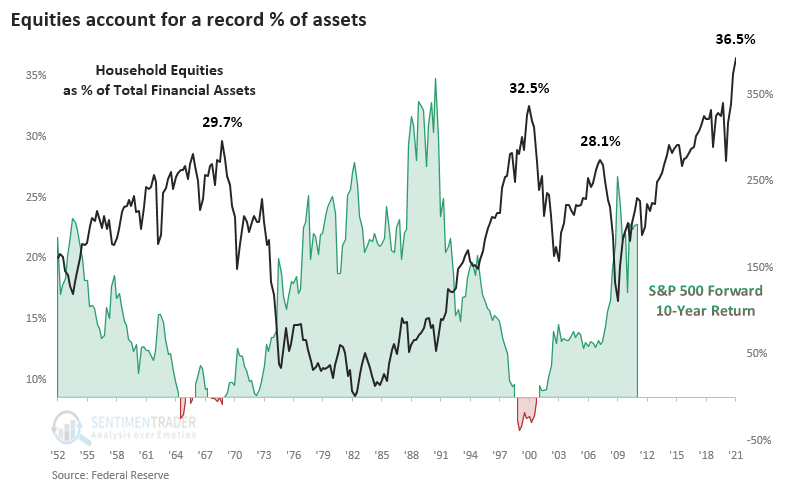
A similar look at the data shows the thing but in an even more extreme way. Relative to the country's output, stock holdings have soared and far surpass any historical extreme. When looking at those correlations to future returns, it suggests a 36% loss for stocks over the next 2 years. Of course, it's been extreme since 2015, so anyone using it as a bearish crutch has been hurting. 

One of the largest asset allocators in the market, pension funds, also picked up their stock exposure. At nearly 81% of all assets, funds are nearing a record allocation to stocks. 

There weren't many sectors that did well after peaks in the Equity / GDP Ratio. It's not a big surprise that the ones that held up the best tended to be more defensive. 

What else we're looking at

  • The correlation in Equities / Assets and Equities / GDP to S&P 500 returns across various time frames
  • What those correlations suggest for future returns
  • A breakdown of sector and factor returns following extremes in the ratios
  • A look at AMC and two options trades based on implied volatility
  • Mid-Cap stocks are seeing some internal deterioration
  • An update on a Breadth Composite chart for Mid-Caps
  • What it means for the U.S. dollar and gold when the buck surges on a FOMC interest rate decision day


Stat box

On Wednesday, the U.S. dollar soared in reaction to the latest Federal Reserve guidance on interest rates. Dean calculated that any time the dollar jumped 0.5% or more on a FOMC day, gold declined over the following two weeks 87% of the time.

Etcetera

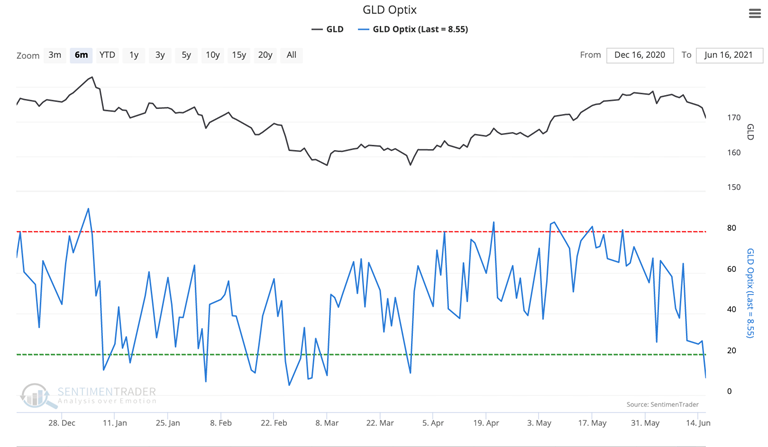
All that glitters is not gold. Late last week, our Optimism Index (Optix) on the GLD gold fund plunged from its recent high, falling to 23%. After Thursday's losses, the Optix fell below 3%, it's 2nd-lowest reading in 7 years.

gold gld optimism sentiment

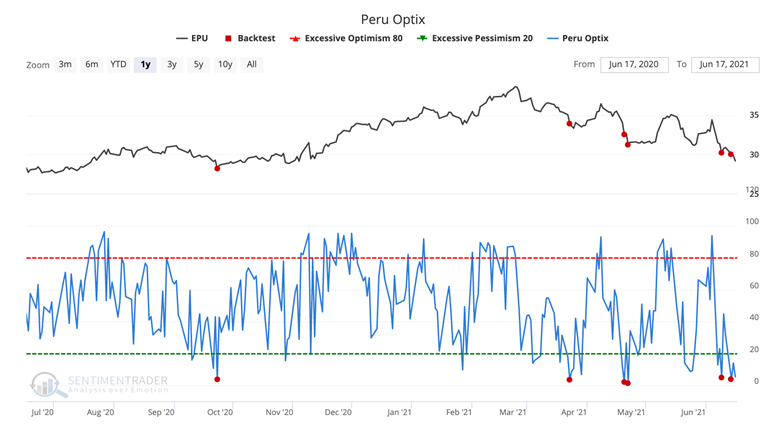
Peruvian pessimism. The Peru Optix continues to fall below, now below 5%, showing extreme pessimism. Our Backtest Engine shows that during the past 5 years, when the Optix is below five, the EPU fund rose over the next 3 months 86% of the time.

peru epu sentiment

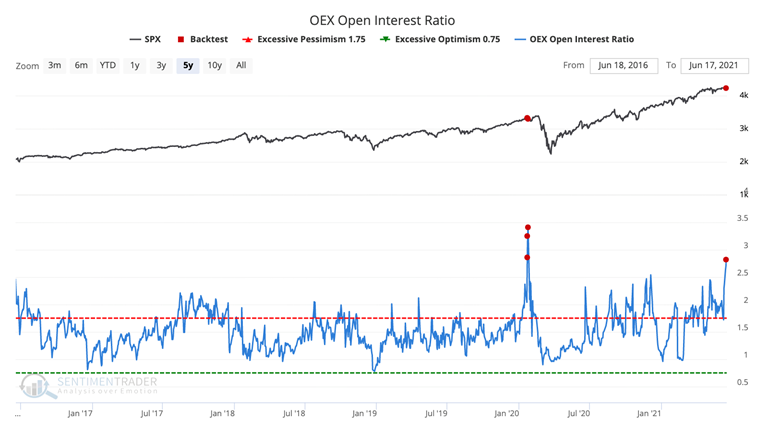
Peak interest. The OEX Open Interest Ratio has hit its highest point in almost a year, climbing to 2.82. Volume in these options has dwindled, but in the past, high ratios of outstanding puts to outstanding calls have preceded declines in the largest-cap stocks.

oex open interest

DATA &
TECHnologies
IndicatorEdge
‍
BackTestEdge
‍
Other Tools
‍
DataEdge API
RESEARCH
reports
Research Solution
‍
Reports Library
‍
actionable
Strategies
Trading Strategies
‍
Smart Stock Scanner
‍
FREE
RESOUrCES
Simple Backtest
Calculator
Simple Seasonality
Calculator
The Kelly Criterion
Calculator
Sentiment Geo Map
‍
Public Research Reports
‍
Free Webinar
COMPANY
‍
About
‍
Meet our Team
‍
In the News
‍
Testimonials
‍
Client Success Stories
Pricing
Bundle pricing
‍
Announcements
‍
FAQ
© 2024 Sundial Capital Research Inc. All rights reserved.
Setsail Marketing
TermsPrivacyAffiliate Program
Risk Disclosure: Futures and forex trading contains substantial risk and is not for every investor. An investor could potentially lose all or more than the initial investment. Risk capital is money that can be lost without jeopardizing ones’ financial security or life style. Only risk capital should be used for trading and only those with sufficient risk capital should consider trading. Past performance is not necessarily indicative of future results.

Hypothetical Performance Disclosure: Hypothetical performance results have many inherent limitations, some of which are described below. No representation is being made that any account will or is likely to achieve profits or losses similar to those shown; in fact, there are frequently sharp differences between hypothetical performance results and the actual results subsequently achieved by any particular trading program. One of the limitations of hypothetical performance results is that they are generally prepared with the benefit of hindsight. In addition, hypothetical trading does not involve financial risk, and no hypothetical trading record can completely account for the impact of financial risk of actual trading. for example, the ability to withstand losses or to adhere to a particular trading program in spite of trading losses are material points which can also adversely affect actual trading results. There are numerous other factors related to the markets in general or to the implementation of any specific trading program which cannot be fully accounted for in the preparation of hypothetical performance results and all which can adversely affect trading results.

Testimonial Disclosure: Testimonials appearing on this website may not be representative of other clients or customers and is not a guarantee of future performance or success.