Products
SentimenTrader Trading Tools
‍
Backtest Engine
My Trading Toolkit
Correlation Analysis
Seasonality
Indicators & Data API
‍
Proprietary Indicators & Charts
Market Data API
Strategies & Scanner
‍
50+ Trading Strategies
Smart Stock Scanner
Research Reports
‍
Research Solutions
Reports Library
Free Resources
Simple Backtest Calculator
Simple Seasonality Calculator
The Kelly Criterion Calculator
Sentiment Geo Map
Public Research Reports
Pricing
Company
About
In the News
Testimonials
Client Success Stories
Contact
Log inLoginSign up
< BACK TO ALL REPORTS

This Fundamental Indicator Just Ended a Record Positive Streak

Jason Goepfert
2021-05-25
For the first time in more than a year, economic reports have started to disappoint economists. That ends the longest streak in 20 years.

For the first time in a year, economic data is disappointing those who predict it.

The Citi Economic Surprise Index briefly turned negative near the end of last week. That's the first time the index has been negative since May of last year.

The index measures how much that economic data is beating or missing economists' forecasts. As a group, economists tend to self-correct as new data comes in, and then they extrapolate into the future, so the index consistently swings between extremes.

Citi economic surprise index below zero

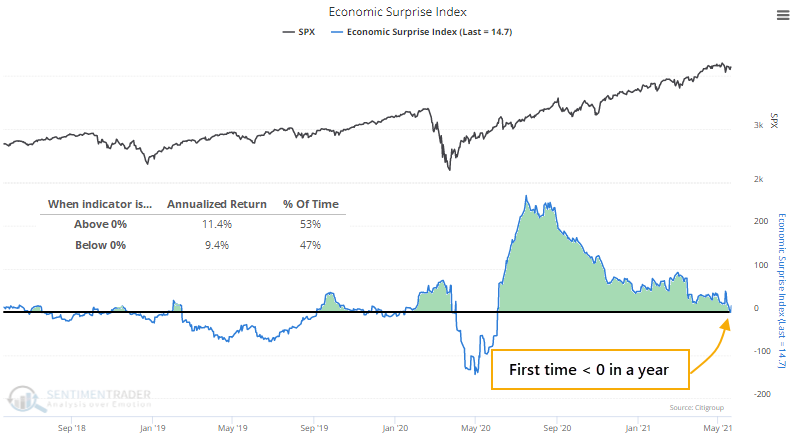
We can see from the chart that the S&P 500 has a very slight tendency to show a better return when surprises are positive than when they're negative, but it's not a big difference.

What may be more notable is that this is ending a record streak of days with positive surprises.

Perhaps stocks will dip once economic data starts to disappoint after investors had become comfortable with positive surprises? To check, we can look at the S&P's future returns after the few other times when a long streak of positives was interrupted.

There were only four other times when Economic Surprises lasted six months or longer, and after the ends of those streaks, the S&P showed mixed returns. There were two times when it fell immediately, and the other two saw their short-term gains wiped out in the months ahead. All four showed a positive one-year return, though.

Stat Box

On Monday, 69% of gold mining stocks were trading above their 200-day moving average. This is nearing a level that indicates overbought conditions, and rallies in miners often fail around this level - but if they don't, it's a sign of strong buying interest that tends to then persist for months afterward. We update this figure, along with a handful of other unique breadth metrics for gold mining stocks, on our site each day for members.


What else we're looking at

  • Full details for S&P 500 returns after economic surprises turn negative
  • Future returns in gold and the dollar were more compelling after surprises turned negative
  • Sector and factor returns after the same signals
  • One particular industry is entering a bullish seasonal window
  • What happens when there is a spike then retreat in Nasdaq 100 stocks falling below their Bollinger Bands
  • An update to industry, sector, and country ETF absolute and relative trends
PRODUCTS
SentimenTrader
Trading Tools
Indicators & Data API
‍
Strategies & Scanner
‍
Research Reports
FREE
RESOUrCES
Simple Backtest
Calculator
Simple Seasonality
Calculator
The Kelly Criterion
Calculator
Sentiment Geo Map
‍
Public Research Reports
‍
Pricing
Bundle pricing
‍
Announcements
‍
FAQ
COMPANY
‍
About
‍
In the News
‍
Testimonials
‍
Client Success Stories
CONTACT
‍
General Inquiries
‍
Media Inquiries
‍
Financial Professionals Inquiries
‍
© 2025 Sundial Capital Research Inc. All rights reserved.
Setsail Marketing
TermsPrivacyAffiliate Program
Risk Disclosure: Futures and forex trading contains substantial risk and is not for every investor. An investor could potentially lose all or more than the initial investment. Risk capital is money that can be lost without jeopardizing ones’ financial security or life style. Only risk capital should be used for trading and only those with sufficient risk capital should consider trading. Past performance is not necessarily indicative of future results.

Hypothetical Performance Disclosure: Hypothetical performance results have many inherent limitations, some of which are described below. No representation is being made that any account will or is likely to achieve profits or losses similar to those shown; in fact, there are frequently sharp differences between hypothetical performance results and the actual results subsequently achieved by any particular trading program. One of the limitations of hypothetical performance results is that they are generally prepared with the benefit of hindsight. In addition, hypothetical trading does not involve financial risk, and no hypothetical trading record can completely account for the impact of financial risk of actual trading. for example, the ability to withstand losses or to adhere to a particular trading program in spite of trading losses are material points which can also adversely affect actual trading results. There are numerous other factors related to the markets in general or to the implementation of any specific trading program which cannot be fully accounted for in the preparation of hypothetical performance results and all which can adversely affect trading results.

Testimonial Disclosure: Testimonials appearing on this website may not be representative of other clients or customers and is not a guarantee of future performance or success.