Products
SentimenTrader Trading Tools
‍
Backtest Engine
My Trading Toolkit
Correlation Analysis
Seasonality
Market Prediction
Indicators & Data API
‍
Proprietary Indicators & Charts
Market Data API
Strategies & Scanner
‍
50+ Trading Strategies
Smart Stock Scanner
Smart Option Scanner
Research Reports
‍
Research Solutions
Reports Library
Free Resources
Simple Backtest Calculator
Simple Seasonality Calculator
The Kelly Criterion Calculator
Sentiment Geo Map
Public Research Reports
Education
Sentiment Indicators
Technical Indicators
Pricing
Company
About
In the News
Testimonials
Client Success Stories
Contact
Log inLoginSign up
< BACK TO ALL REPORTS

This FOMC pattern suggests higher stock prices

Dean Christians
2021-12-15
The S&P 500 closed down on consecutive days before an FOMC decision day. Similar setups have preceded gains in stock prices across multiple time frames.

Key points:

  • The S&P 500 closed down on consecutive days before an FOMC decision day
  • On Monday, the S&P 500 fell 0.91%, and on Tuesday, it closed down 0.75%
  • The S&P 500 showed a tendency to rally after other signals

Stock trends around FOMC decision days show a clear pattern

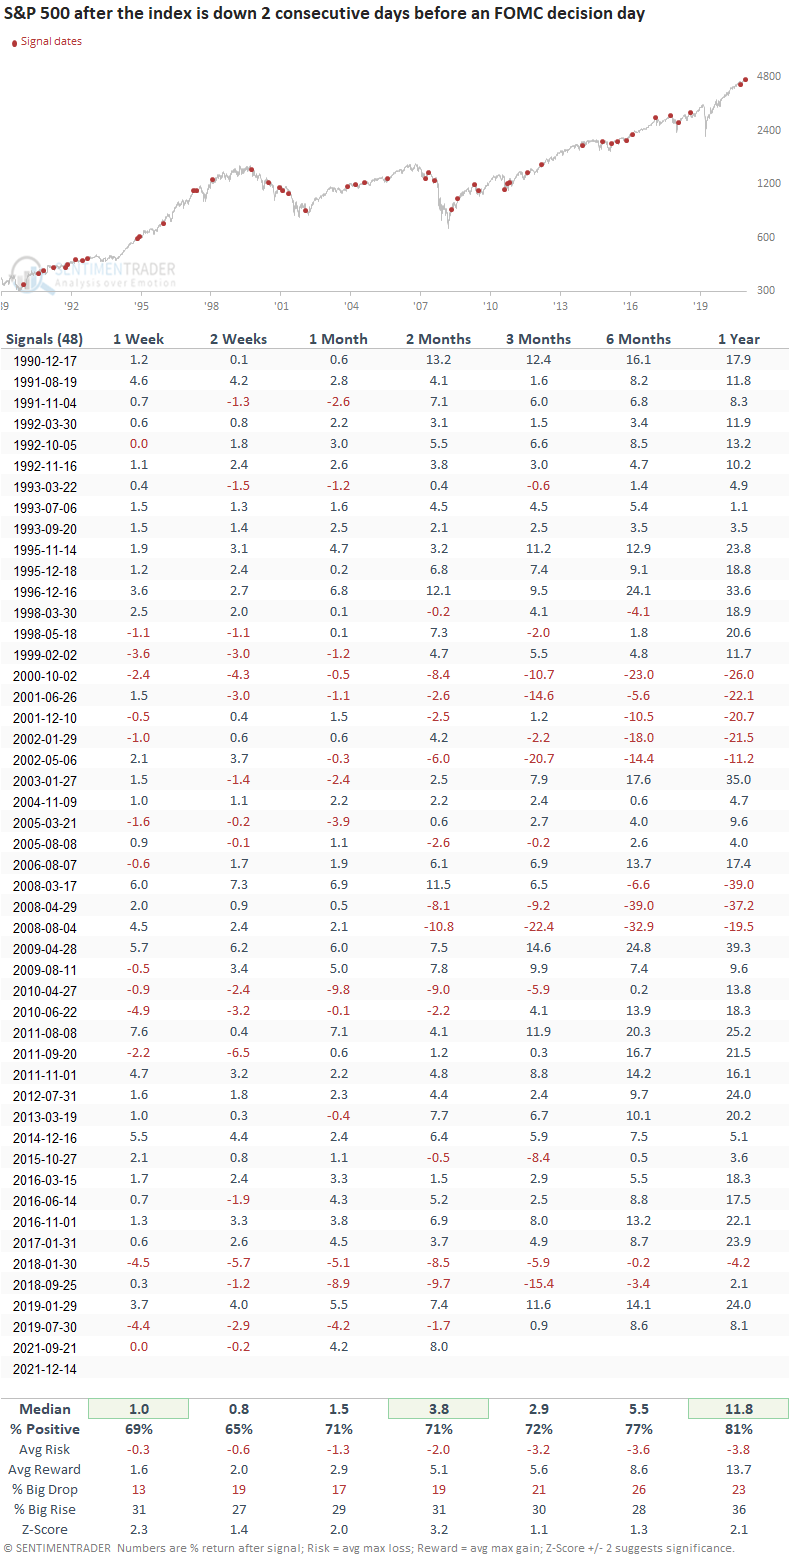
Traders may be showing some anxiety ahead of Wednesday's FOMC decision and statement, with the S&P 500 suffering fairly large back-to-back declines. Let's assess the outlook for the S&P 500 when the index closes down on consecutive days prior to an FOMC decision day.

This signal has triggered 48 other times over the past 32 years. After the others, future returns and win rates were solid, with several significant risk/reward profiles. If you exclude the 2000-02 and 2007-08 bear markets, the 1-year time frame shows one instance with a negative return.

Returns when the S&P 500 is in an uptrend

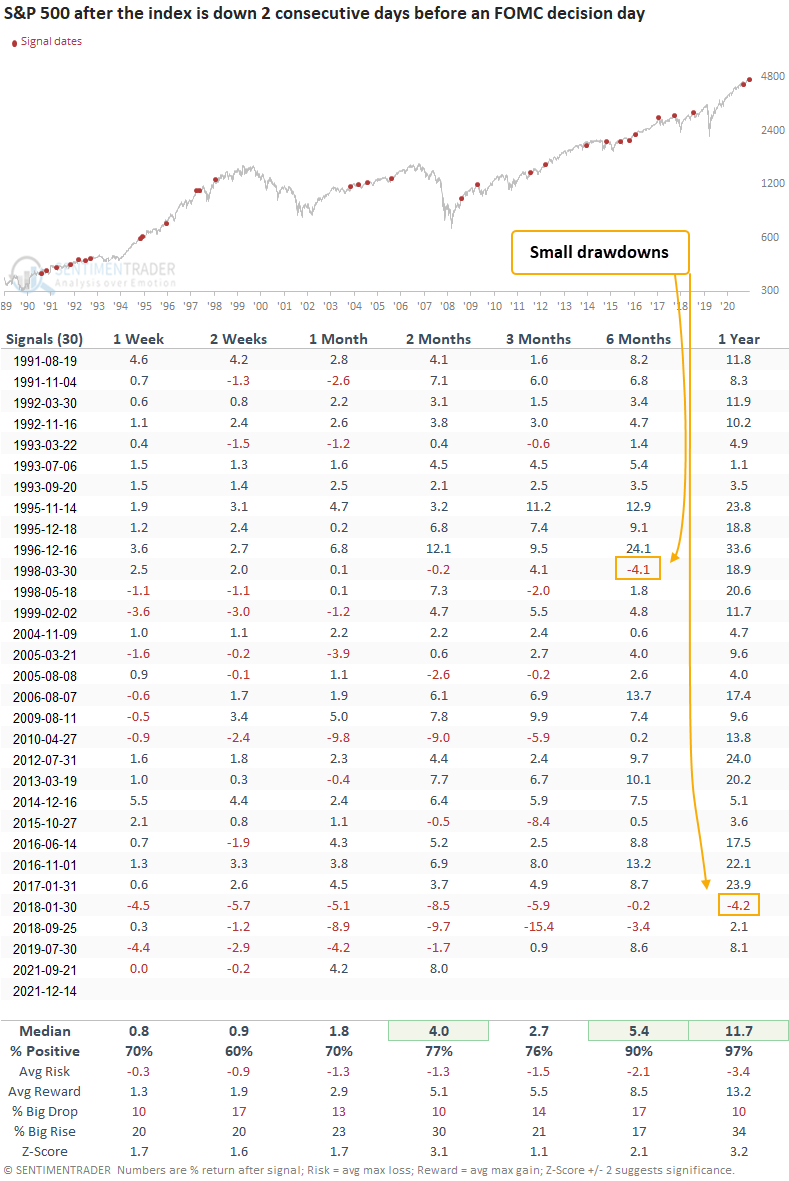
Let's add some context to the study. I will keep the previous conditions and now include a trend filter. The S&P 500 must be trading above its 200-day moving average, which is the case now.

This signal has triggered 30 other times over the past 31 years. After the others, future returns and win rates were solid, especially in the 6-12 month time frame. And, drawdowns were minimal in the two long-term time frames. 

Results when the S&P 500 is down 0.5% or more

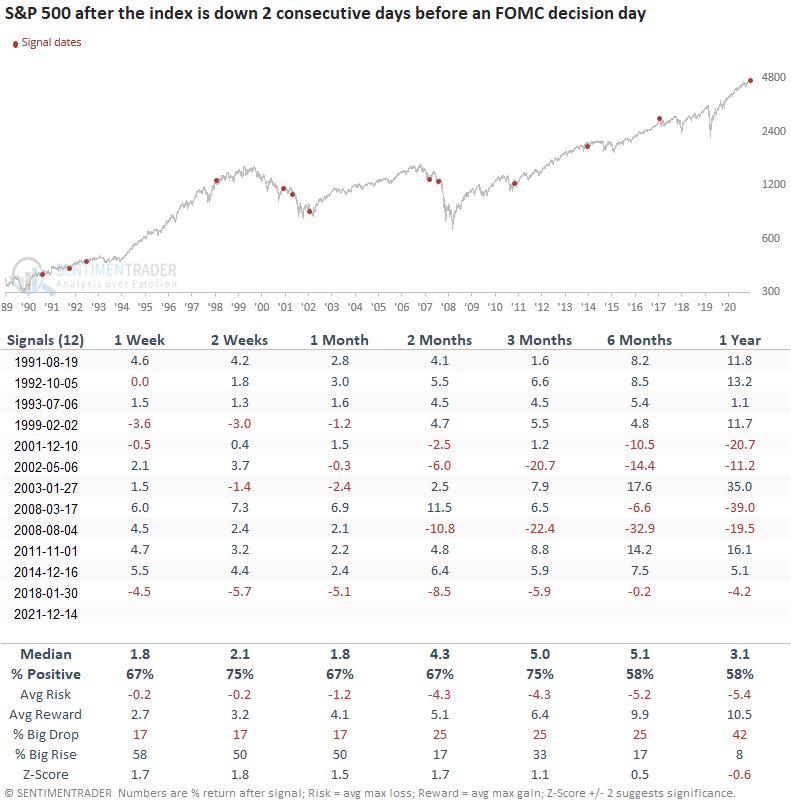
With the S&P 500 down 0.91% and 0.75% respectively on Monday and Tuesday, let's isolate historical instances when the S&P 50 closes down 0.5% or more on the two days before a decision day.

This signal has triggered 12 other times over the past 31 years. After the others, future returns and win rates were solid on a short to medium-term basis. However, bear market instances impacted the long-term results.  

Short-term results when the S&P 500 is down 0.5% or more

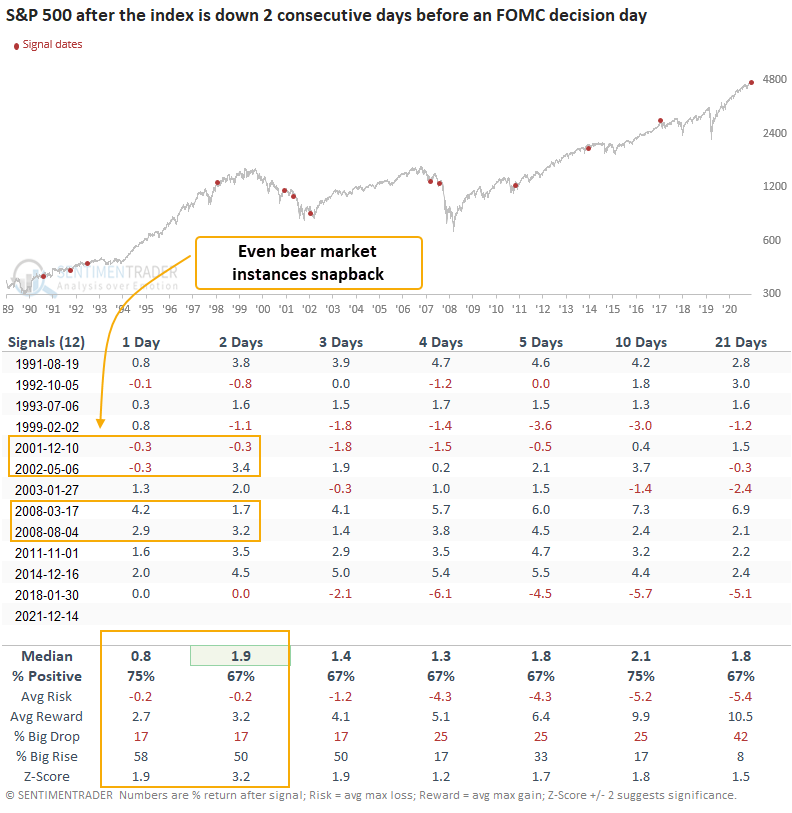
If I shorten the study time frames, the pattern shows a strong tendency to recover over the subsequent few sessions. The 2-day window shows an excellent return and risk/reward profile.

What the research tells us...

Stock trends around FOMC decision days show a clear bias for a snapback when the S&P 500 closes down on consecutive days before a decision day, especially in a market uptrend. Similar setups to what we're seeing now have preceded solid returns and win rates for the S&P 500 across multiple time frames. 

PRODUCTS
SentimenTrader
Trading Tools
Indicators & Data API
‍
Strategies & Scanner
‍
Research Reports
FREE
RESOUrCES
Simple Backtest
Calculator
Simple Seasonality
Calculator
The Kelly Criterion
Calculator
Sentiment Geo Map
‍
Public Research Reports
‍
Education
Sentiment Indicators
‍
Technical Indicators
‍
Pricing
Bundle pricing
‍
FAQ
‍
Announcements
‍
COMPANY
‍
About
‍
In the News
‍
Testimonials
‍
Client Success Stories
CONTACT
‍
General Inquiries
‍
Media Inquiries
‍
Financial Professionals Inquiries
‍
© 2026 Sundial Capital Research Inc. All rights reserved.
Setsail Marketing
TermsPrivacyAffiliate Program
Risk Disclosure: The information and tools provided are for research and analytical purposes only and are not intended as investment advice. Market analysis involves uncertainty, and outcomes may differ from expectations. Users should conduct their own due diligence and consider their individual circumstances before making any financial decisions. Past performance is not necessarily indicative of future results.

Hypothetical Performance Disclosure: Hypothetical performance results have many inherent limitations, some of which are described below. No representation is being made that any account will or is likely to achieve profits or losses similar to those shown; in fact, there are frequently sharp differences between hypothetical performance results and the actual results subsequently achieved by any particular trading program. One of the limitations of hypothetical performance results is that they are generally prepared with the benefit of hindsight. In addition, hypothetical trading does not involve financial risk, and no hypothetical trading record can completely account for the impact of financial risk of actual trading. for example, the ability to withstand losses or to adhere to a particular trading program in spite of trading losses are material points which can also adversely affect actual trading results. There are numerous other factors related to the markets in general or to the implementation of any specific trading program which cannot be fully accounted for in the preparation of hypothetical performance results and all which can adversely affect trading results.

Testimonial Disclosure: Testimonials appearing on this website may not be representative of other clients or customers and is not a guarantee of future performance or success.